




Silver Falls Below $59 as Rate Hike Fears Outweigh Safe-Haven Buying


Silver falls below $59 as Hormuz tensions lift rate hike fears and pressure demand. June CPI will determine whether prices recover or slide toward $50.
- Silver fell below $59 per ounce on July 13 as the US carried out its fourth strike against Iran in a week and renewed uncertainty over the Strait of Hormuz increased pressure across commodity markets.
- Industrial uses account for 58% of silver demand, exposing solar panels, semiconductors, and electric vehicles to higher energy costs from Hormuz disruption and higher financing costs as markets price in additional Fed rate hikes.
- Silver closed at $60.26 per ounce on July 11, more than 50% below its January 2026 high of $121.78. The metal is down 16.62% year to date and trades 14.3% below its 50-day moving average of $70.30, signaling continued downside momentum.
- The Abaxx Exchange Silver Singapore (SSP) futures contract traded more than 30,000 contracts in its first 14 days after launching on May 22, 2026. The physically deliverable contract for 0.9999 fine silver gives Asian commercial participants a regional pricing venue alongside CME futures.
- Bunker Hill Mining restarted silver production at its Silver Valley, Idaho mine with a 1,800 to 2,500 tonne-per-day processing facility operated in partnership with Teck, adding a new source of US silver supply.
Hormuz Disruption Raises Energy & Financing Costs, Pressuring Silver Demand
Silver fell below $59 per ounce after the US carried out its fourth strike against Iran in a week and Tehran again claimed the Strait of Hormuz was closed "until further notice," lifting oil prices and strengthening expectations for additional Fed rate hikes. Industrial uses account for 58% of silver demand, while higher real interest rates weaken the remaining 42% tied to investment demand.
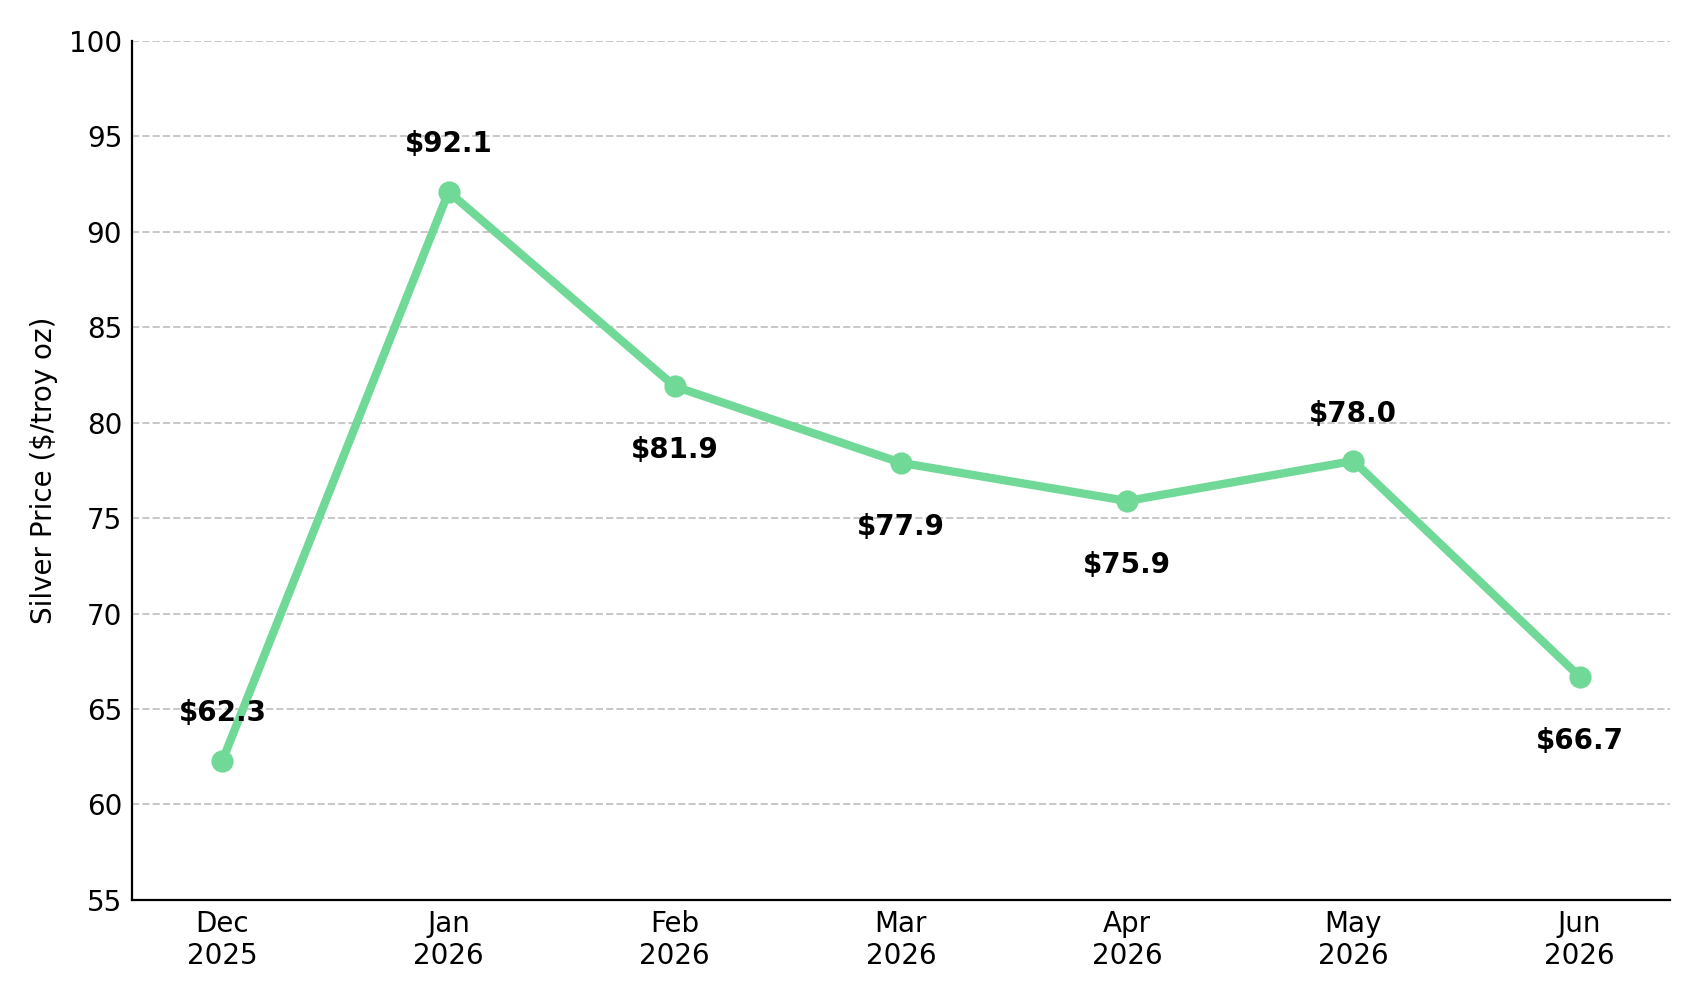
This combination left silver exposed to higher energy and financing costs instead of attracting safe-haven buying. Silver closed at $60.26 per ounce after falling 3.6% for the week and 16.62% year to date, showing that higher rate expectations outweighed both geopolitical demand and the oversold RSI reading of 40.6.
Higher Energy Costs & Fed Rate Expectations Weaken Silver's Two Demand Drivers
Industrial demand drives most of silver's weakness. Solar panels, semiconductors, and electric vehicles account for 58% of silver demand and face higher energy and financing costs as oil prices rise and the Fed maintains a hawkish stance.
Fed projections showed nine of 18 policymakers expected at least one additional rate increase before year-end, while markets priced a roughly 50% chance of a September hike before the latest Middle East escalation. June CPI data and Fed Chair Kevin Warsh's congressional testimony will determine whether that probability rises toward 65%, increasing pressure on silver through higher real interest rates.
June CPI & Fed Signals Will Determine Silver's Q3 Price Direction
Silver's next move depends on June CPI and developments in the Strait of Hormuz. A CPI reading below 3.8% and easing Hormuz disruption could lift silver toward $70 to $80 and narrow the gold-silver ratio toward its 50-year average of 60. A reading of 4.0% or higher could raise the probability of a September rate hike to about 65% and push silver toward $50, with $45.51 as the downside target.
Although the RSI of 40.6 points to oversold conditions, annualized 30-day volatility of 51.13% means either outcome could unfold within a month. Fed Chair Kevin Warsh's congressional testimony and the Fed Beige Book are the next catalysts for rate expectations.
Asian Physical Silver Pricing Offers Miners an Alternative Demand Channel
Silver miners face different demand risks depending on where they sell their production. Producers serving solar, semiconductor, and EV markets in North America and Europe could face weaker demand if higher energy prices and interest rates delay new projects. By contrast, miners with Asian off-take agreements or access to the Singapore SSP contract may benefit from stronger regional physical demand. \
The SSP contract traded more than 30,000 contracts in its first 14 days, while Bunker Hill Mining restarted silver production in Idaho, adding new US supply. Producers with all-in sustaining costs above $55 per ounce would face margin pressure if June CPI raises the probability of a September rate hike to about 65%.
June CPI & Asian Physical Demand Will Drive Silver's Next Move
Silver remains below $59 as higher oil prices reinforce expectations for additional Fed rate hikes, with markets pricing about a 50% chance of a September increase before the June CPI report. An RSI of 40.6 points to oversold conditions, but the annualized 30-day volatility of 51.13% means either a rebound or another selloff remains likely. A June CPI reading below 3.8% would reduce rate hike expectations and support a recovery toward $70 to $80.
A CPI reading of 4.0% or higher could lift the probability of a September rate hike to about 65% and push silver toward $50. The gold-silver ratio near 70 remains above its 50-year average of about 60, but higher interest rates continue to limit a catch-up move in silver. June CPI is the next major catalyst for silver prices. A CPI reading below 3.8% supports the recovery case, while 4.0% or higher strengthens the bearish outlook. SSP trading volume will indicate whether Asian physical demand is absorbing the selloff despite continued weakness in CME futures.
Analyst's Notes





Subscribe to Our Channel


Stay Informed


