




COMEX Deliveries Top 37 Million Ounces as Sixth-Year Silver Deficit Tightens Physical Supply


Silver tops $59.50 as COMEX deliveries exceed 37M ounces and a sixth straight supply deficit tightens the market, keeping a $60 breakout in focus.
- Silver traded above $59.50 an ounce, up more than 1%, as a COMEX delivery squeeze met a sixth consecutive annual supply deficit, bringing $60 back into focus.
- July COMEX deliveries exceeded 37 million ounces while warehouse inventories remained at multi-year lows.
- About 70% of global silver supply is a byproduct of copper, zinc, and lead mining, limiting the market's ability to increase output.
- The gold:silver ratio ended June at 70:1, about 17% above its modeled equilibrium of 59.65:1, with similar gaps historically narrowing by half over a median 17.3 months.
- A daily close above $59.75 would confirm the next breakout, while a close below EMA50 support or a September Fed rate hike priced above 55% would weaken the rally.
Geopolitical Supply Risks & COMEX Tightness Strengthen Physical Silver Demand
Silver rose above $59.50 an ounce, up more than 1%, bringing the metal back within reach of the $60 level. The rally followed a Houthi embargo on Saudi-linked shipping in the Red Sea and an attack on the Caspian Pipeline Consortium's Black Sea export terminal, raising concerns over broader commodity supply risks.
July COMEX deliveries exceeded 37 million ounces while warehouse inventories remained at multi-year lows, reinforcing signs of tight physical supply. Major silver ETFs recorded rising holdings and net inflows, indicating that physical buying, rather than futures positioning alone, is supporting the price rally.
Byproduct Mine Supply Limits New Silver Production as Industrial Demand Accelerates
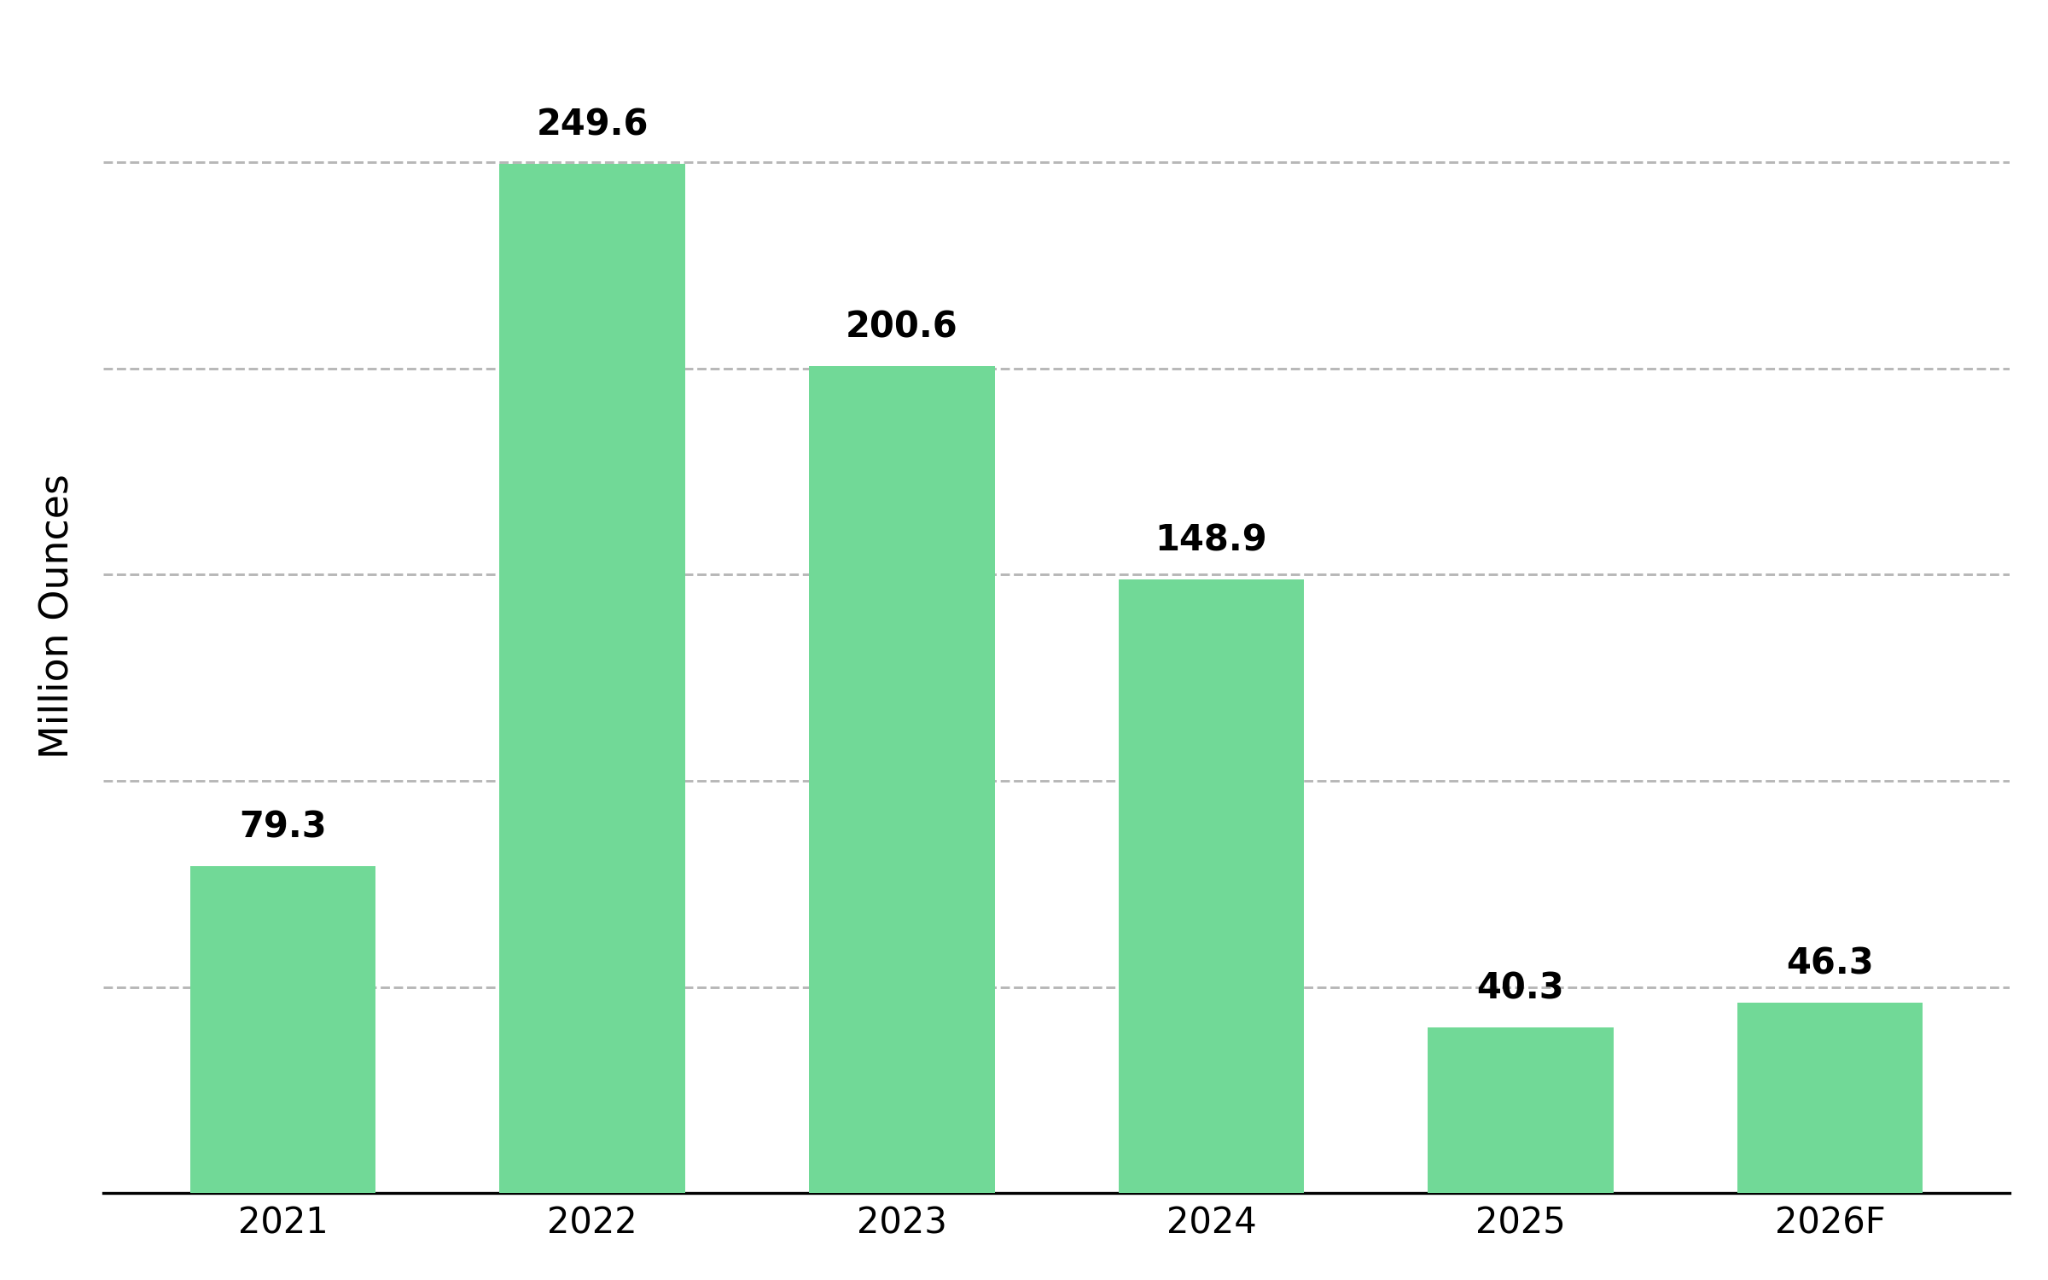
Silver's supply deficit predates the latest geopolitical disruptions. The Silver Institute forecasts a sixth consecutive annual deficit of about 46.3 million ounces in 2026 as record demand from AI data centers, solar manufacturing, and electric vehicles outpaces supply. About 70% of global silver supply comes from copper, zinc, and lead mining, limiting output growth.
A Houthi embargo on Saudi-linked shipping in the Red Sea and an attack on the Caspian Pipeline Consortium's Black Sea export terminal increased commodity supply risks. Weaker-than-expected US manufacturing data weakened the dollar, making silver cheaper for non-US buyers and supporting demand.
Fed Policy Outlook & Dollar Strength Set Silver's Bull & Bear Case
About 70% of mined silver is produced as a byproduct of copper, zinc, and lead mining, limiting supply growth despite higher prices. Industrial applications accounted for 63% of fabrication demand in 2025, up from 41% in 1990, making demand less responsive to higher prices.
Base case: The Fed holds rates at its next meeting, allowing silver to retest $59.75 if EMA50 support holds.
Bull case: A sixth straight supply deficit, tight physical inventories, and geopolitical risk drive a breakout above $59.75 if the Fed holds rates.
Bear case: A September Fed rate hike strengthens the dollar, breaks EMA50 support, and hits silver and mining equities hard, echoing the earlier 36% drawdown.
Physical Demand Supports Silver While Mining Equities Increase Price Risk
Silver exposure comes through physical holdings, including ETFs, and mining equities with operational leverage to the metal price. Endeavour Silver and First Majestic Silver outperformed spot silver during the rally, but that leverage also increases downside risk. Silver fell 36% from its January 2026 high to the end of May, roughly double gold's 18% decline.
The Silver Institute's forecast for a sixth consecutive annual deficit, together with more than 37 million ounces delivered through the July COMEX contract and rising ETF holdings, indicates that physical demand is supporting the rally rather than futures buying alone. The next Fed decision and any escalation in the Red Sea or Black Sea remain the key near-term catalysts. The gold:silver ratio has historically taken a median 17.3 months to close half the gap to its long-run equilibrium, suggesting any normalization will likely unfold over months rather than around a single event.
$59.75 Close Confirms Breakout While EMA50 Holds the Trend
Silver remains above its 50-day exponential moving average (EMA50), keeping the technical uptrend intact. If EMA50 support holds, physical silver, silver ETFs, and mining equities should continue to benefit from the COMEX delivery squeeze and a sixth consecutive annual supply deficit.
A close below EMA50 support or a September Fed rate hike priced above 55% would weaken the rally. A stronger dollar could push the gold:silver ratio above 70:1 and pressure mining equities more than the metal itself. Key catalysts are the next Fed decision, COMEX delivery activity, weekly ETF holdings, and a close above $59.75.
Analyst's Notes





Subscribe to Our Channel









Stay Informed






