Update on Novo Resources (NVO) - We Don't Want to Say I Told You So...


An update on Novo Resources following the release of their technical report on Beatons Creek. We compare their results to our previous valuations from a 2020 Crux Investor Report.
An update on Novo Resources following the release of their technical report on Beatons Creek. We compare their results to our previous valuations from a 2020 Crux Investor Report.
Introduction
On 27 September last year we published a comprehensive review report on Novo Resources, which included a valuation of its’ Beatons Creek project. Our report was highly sceptical about the merits of the Pilbara conglomerate prospects, but it gave Beatons Creek the benefit of the doubt. Beatons Creek is the only property for which the company has been able to release a resource estimate, and accompanying technical report.
After publication, the report was aggressively trolled by some in the investment community with our very own Matt Gordon receiving unacceptable levels of abuse. The vitriol from unsavoury and anonymous characters on the internet is the reason why we Analysts maintain our anonymity. Names have been withheld to protect the rational – that kind of thing.
The good news is that Novo Resources has published a new technical report on Beatons Creek. The brand new preliminary economic assessment (“PEA”) on Beatons Creek, dated 31 March 2021, gave it an after-tax NPV5 value of US$250 million. Our report from September 2020, gave an after-tax NPV7.5 value of US$253 million. We used a higher discount rate as the project still needs to prove itself, the gold price was over $100/oz higher, but we are in the same ball-park as the company itself. Note that the market capitalisation on 31 March was US$538 million.
To everyone who trolled Matt last year after we published our report; Shame on you!
Getting back to the business of looking at resource companies, the PEA press release gives some important information previously not available. For full details we will have to wait for at least another month before the PEA report is published and available for scrutiny. Right now, however, we can glean the following useful information from it. You’re welcome.
Mineable Inventory
Being included in a PEA the plant feed in the production schedule that is allowed to include Inferred Resources cannot be classified Mineral Reserves but it can be called Mineable Inventory. Table 1 shows the Mineable Inventory compared to the latest declared mineral resources, which were estimated by a Novo Resources contractor and peer reviewed by an outside expert Optiro Pty Ltd.
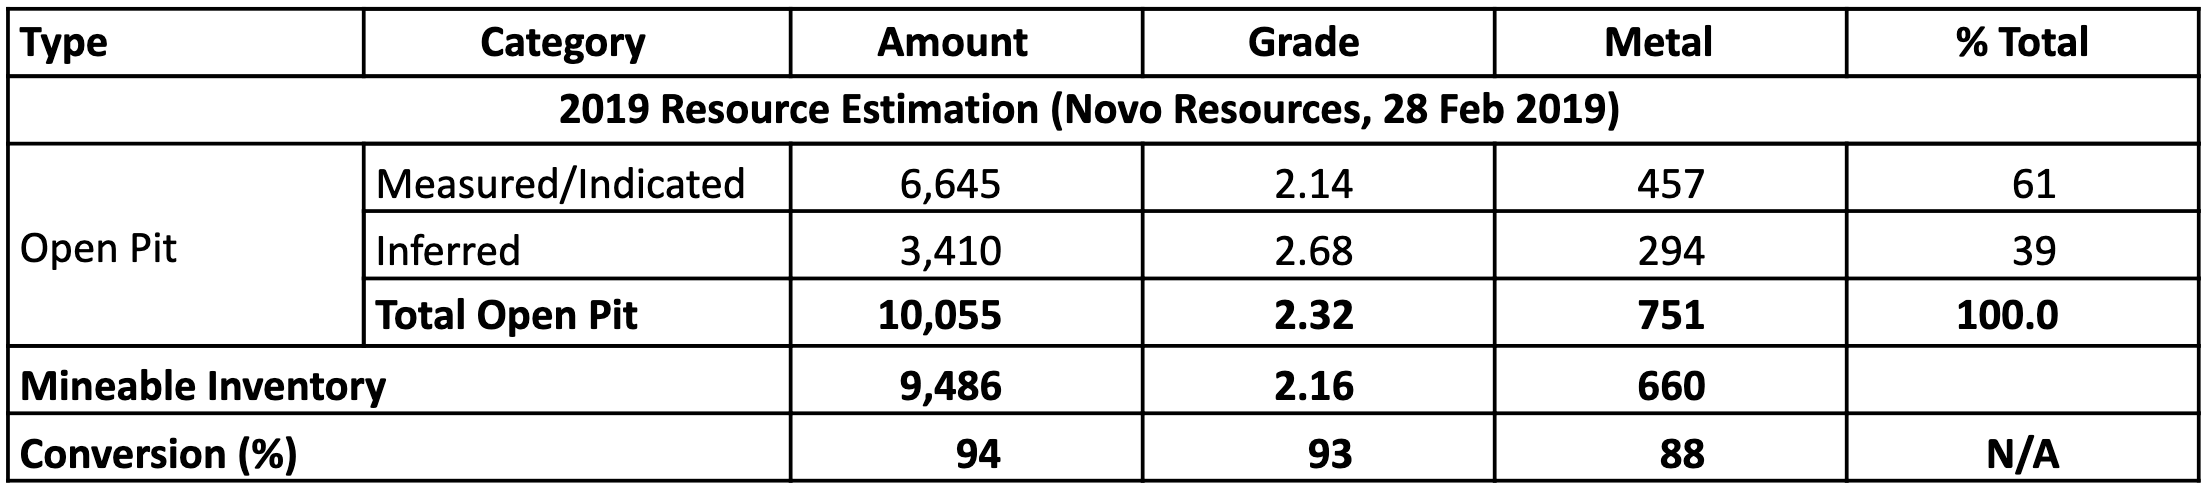
The table shows that almost 40% of gold contained in open pit resources is accounted for by Inferred Resources at a considerably higher grade than Indicated Resources. The inferred resource has a grade of 2.68 g/t gold, whereas the more thoroughly evaluated Measured / Indicated Resources have a grade of 2.14 g/t gold. It should be of concern that lower confidence resources happen to have much higher grade (+25%) than higher confidence resources.
Look also at the “conversion” line in Table 1. The ‘Metal’ column shows that 88% of the open-pit resource gets turned into mineable inventory but at this stage it is not clear how much of the Inferred resources were converted to Minable Inventory. Note also that there is no real explanation why the grade figure in the Mineable Inventory (2.16 g/t Au) is 7% lower than the grade figure for the Total open pit (2.32 g/t Au), although this is likely to be a dilution factor.
Dilution is a significant challenge at Beatons Creek. Indeed, we question whether the company has been sufficiently conservative in its dilution assumptions. A test mining programme in 2016 extracted almost 30,000 tonnes of mineralised material, with strict geological control, and with test pits dug in advance of mining, and dilution was estimated at 20%. Given that during commercial mining such control cannot be practically maintained we assumed 30% dilution for our valuation. Remember that the gold at Beatons Creek is found in narrow reefs, and if Novo Resources can achieve 30% dilution they will be doing well. It does not help that barren conglomerates occurring above and below reportedly display similar characteristics to the gold-bearing target horizons, making visual control difficult.
All in all, we doubt the assumed PEA feed grade and we maintain our 30% dilution assumption.
Strip Ratio
Without information on waste stripping requirements in the technical reports predating the PEA, we had to guesstimate the strip ratio in our earlier report, settling on 5:1 given the bulk sample of oxide material alone had a strip ratio of almost 3:1. When applying the 30% dilution rate, which made same of the overburden waste part of the plant feed, the effective strip rate dropped to 3.6:1.
The PEA uses a life of mine (“LOM”) strip ratio of 8.43:1, which is a material increase from the number we had used. Again, when applying a dilution of 30% the strip rate should drop to a level of around 6.64:1. Whereas the LOM in the PEA is just over 6 years, our schedule increases to almost 8 years because of dilution.
Economically the most important impact of the higher dilution rate is an 18% drop in annual gold production.
Some Cost Discrepancies in the PEA Press Release
When crunching some of the numbers in the PEA press release there are a number of discrepancies. Table 2 derives cost metrics (shown as blank cells with the pertinent results highlighted orange brown) from numbers provided in the press release (highlighted in yellow) to illustrate this point.
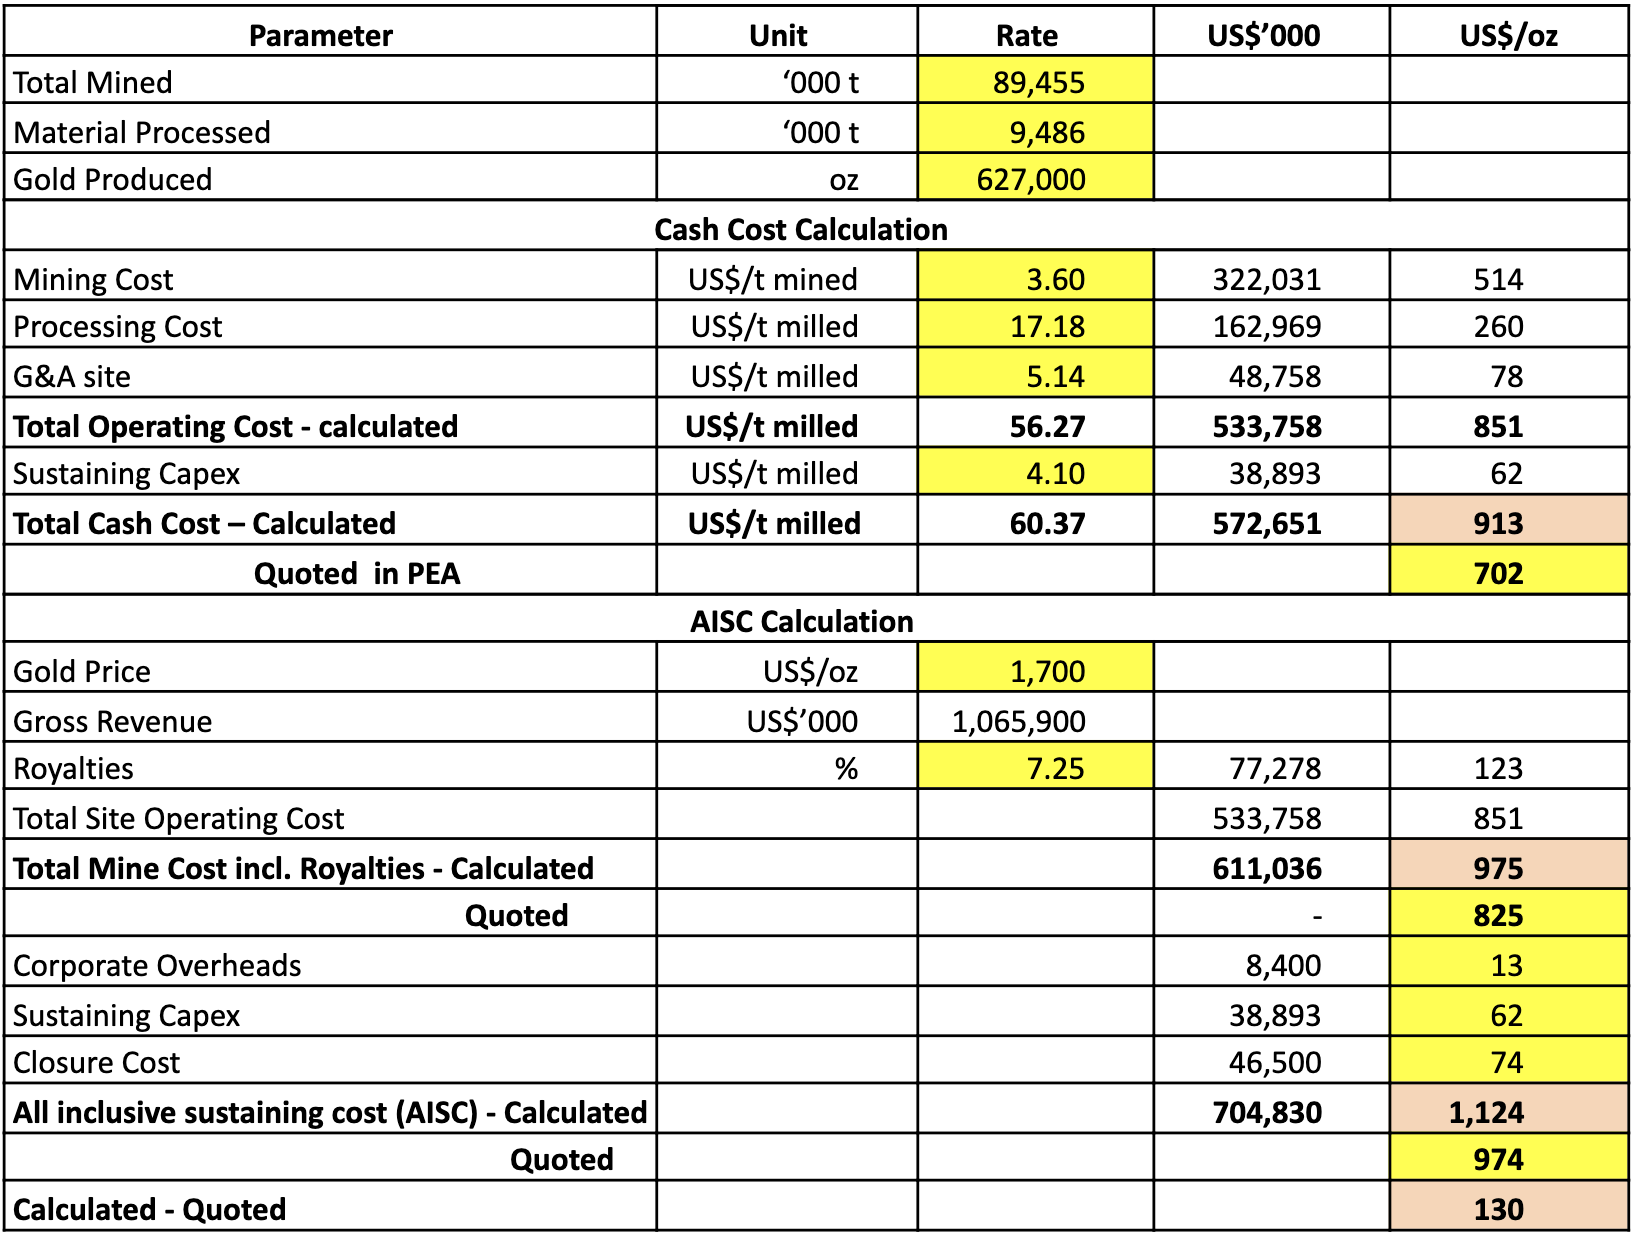
There is a difference between calculated (US$913/oz) and quoted (US$702/oz) Cash Cost per ounce produced of US$209. The difference between Total Mine Cost including Royalties (quoted US$825/oz) and Total Cash Cost (US$702/oz) is fully explained by the royalties amounting to US$123/oz based on a rate of 7.25% on gross revenue quoted in the PEA press release.
The information for corporate overheads (optimistically low at US$1.2 million per annum), sustaining capital expenditure and closure cost are very helpful and were not included in the September 2020 Crux Investor valuation as being too uncertain.
Curiously, the discrepancy between calculated and quoted AISC is at US$130/oz much lower than the Cash Cost discrepancy.
Without the full PEA report available it is impossible at this stage to find the reason for the discrepancies.
Tax Discrepancies in the PEA Press Release
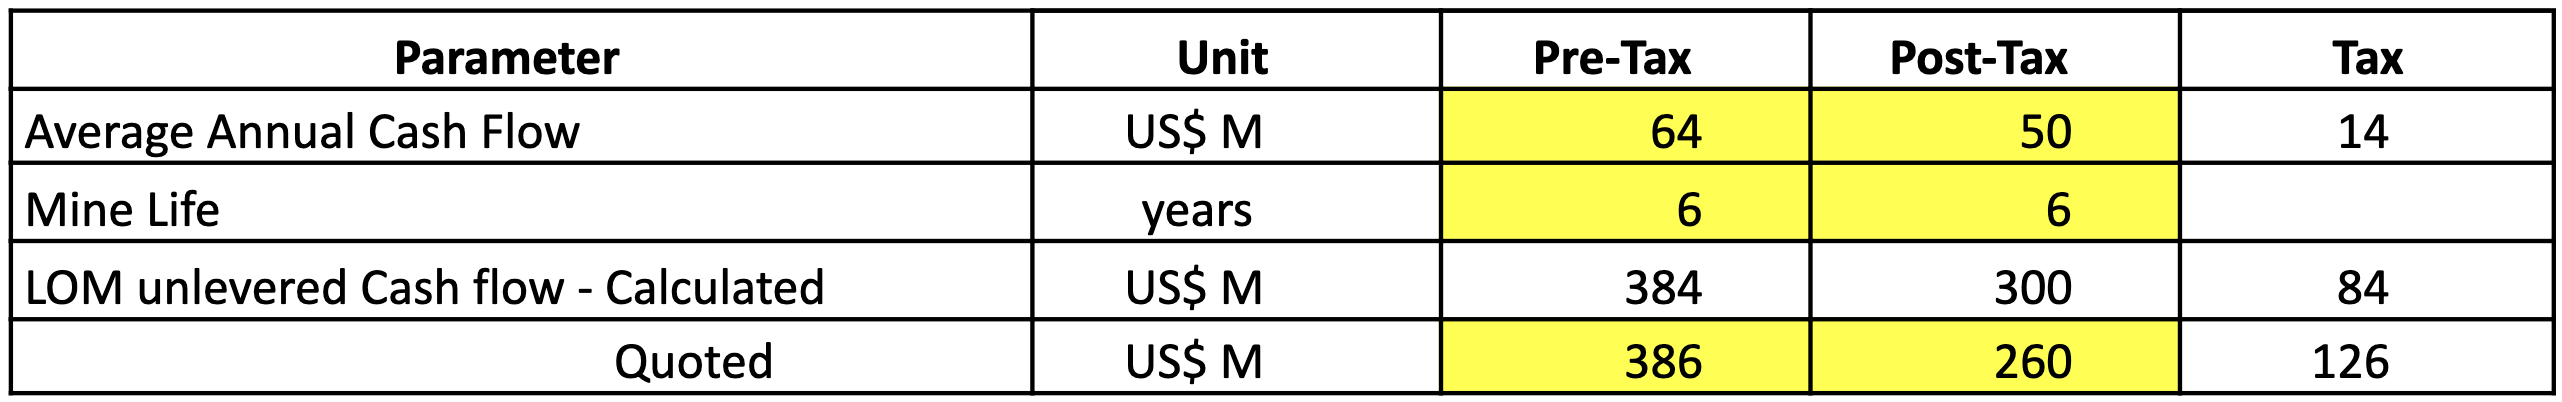
The press release includes a table with results for the economical assessment both pre- and post-tax. Logically from this the total tax burden should be derived. However, as Table 3 illustrates there are significant discrepancies between the tax burden derived from the summation of annual numbers and totals. Again, the highlighted cells contain the numbers provided by Novo Resources, but this time Novo Resources has a more conservative number than we do. Our calculated tax burden of US$84 million is lower than the quoted tax burden of US$126 million. And again, the full detail of the PEA when it is published should help our analysis hone in on the correct tax number.
Main Assumptions – Crux Investor and PEA
Table 4 summarises the material assumptions used in the PEA and also in the report we did last September and applied to this “April 2021 update of the cash flow model”.
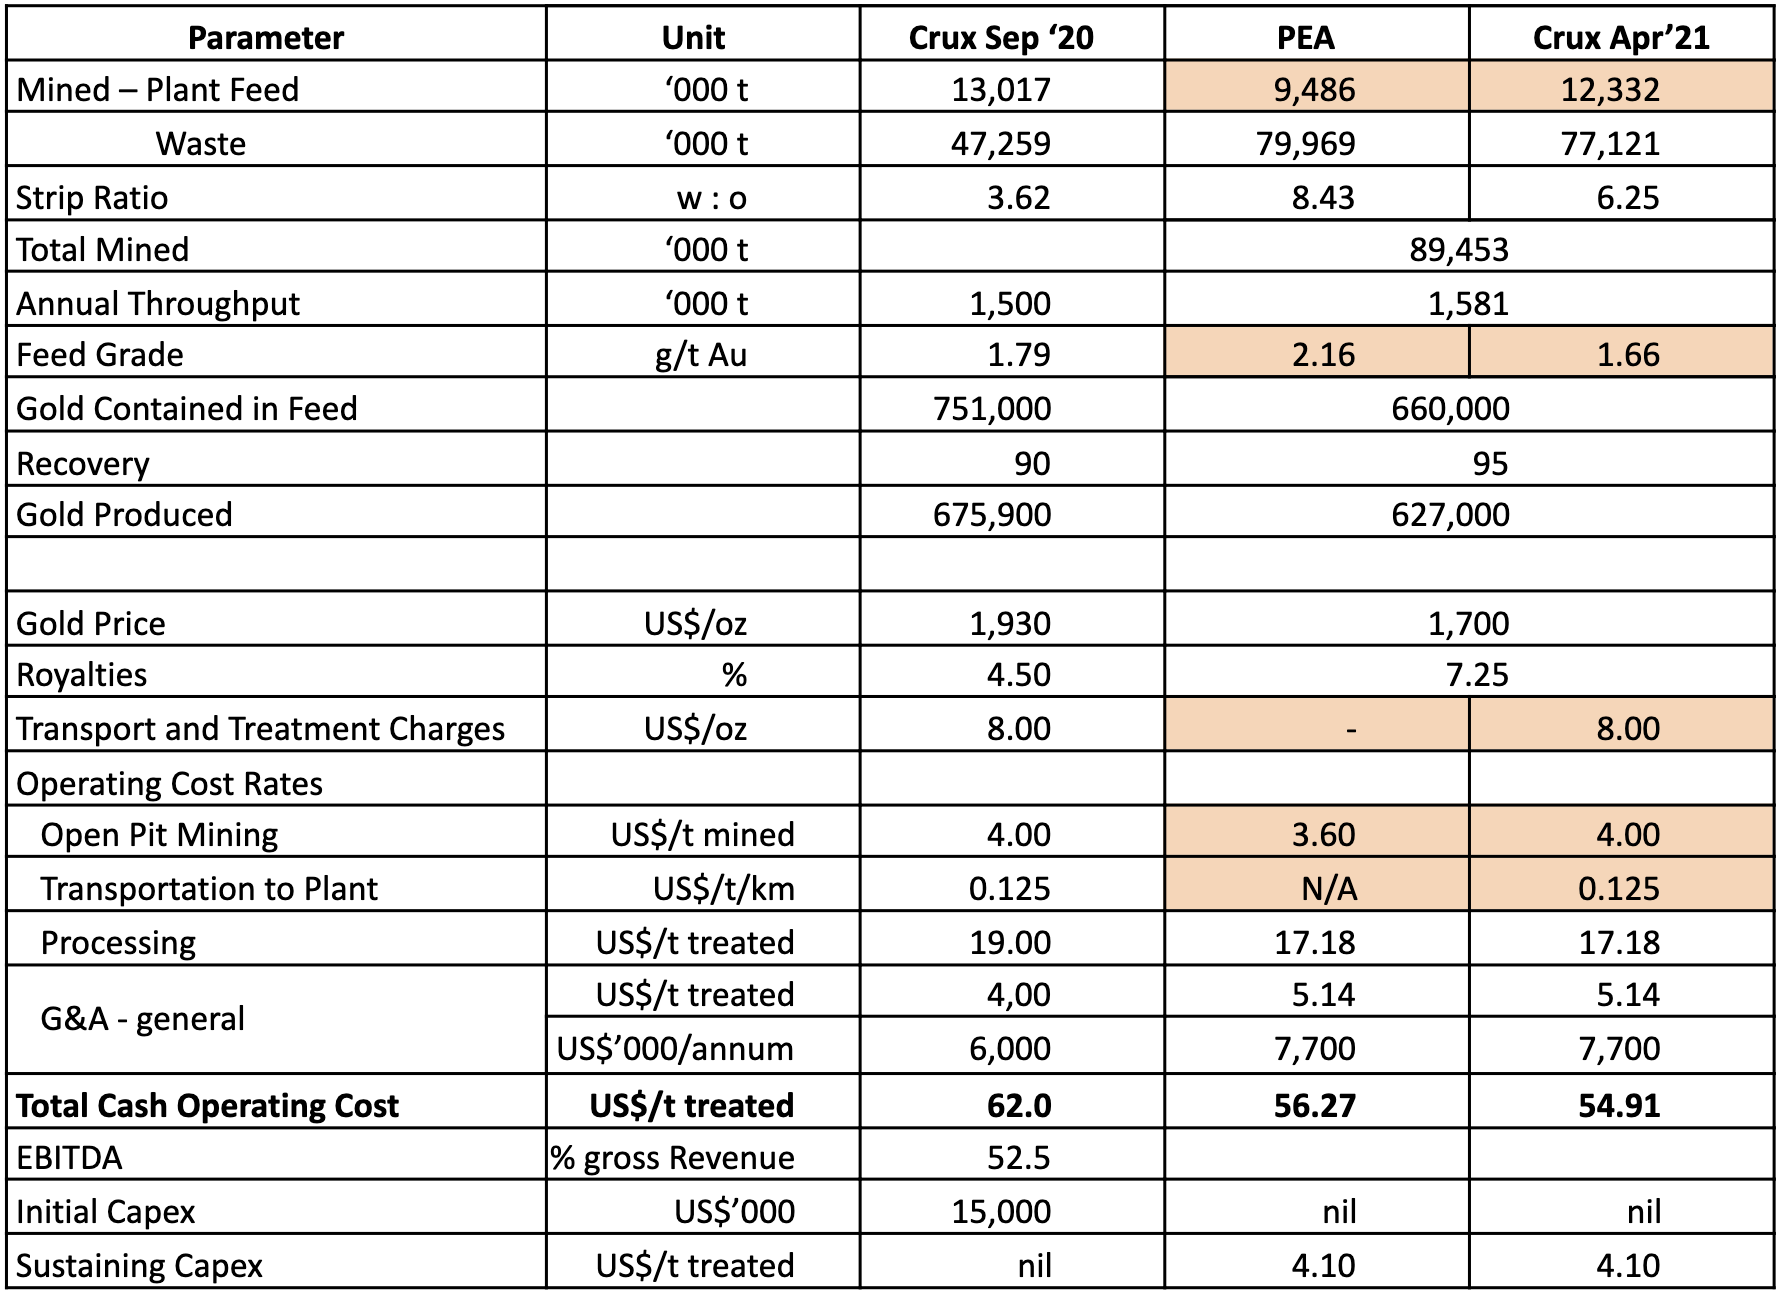
The table shows that we have only made a few changes to cost input parameters in addition to the assumed dilution rate. The mining cost of US$3.60/t has been increased to US$4.0/t as the job has been outsourced to a mining operator, who needs to recoup its investment in mining equipment and needs to earn a profit, the relatively small size of equipment needed to be able to selectively load ore in narrow horizons and the relatively small scale of operation.
It is not evident whether Novo Resources has included a provision for transportation to the process plant at 14 km distance. We have added US$0.125 per tonne per kilometre as a provision.
Let’s see what this does to the economics of the project.
Economic Assessment
Table 5 shows the results of the economic assessment for PEA and our Crux assumptions.
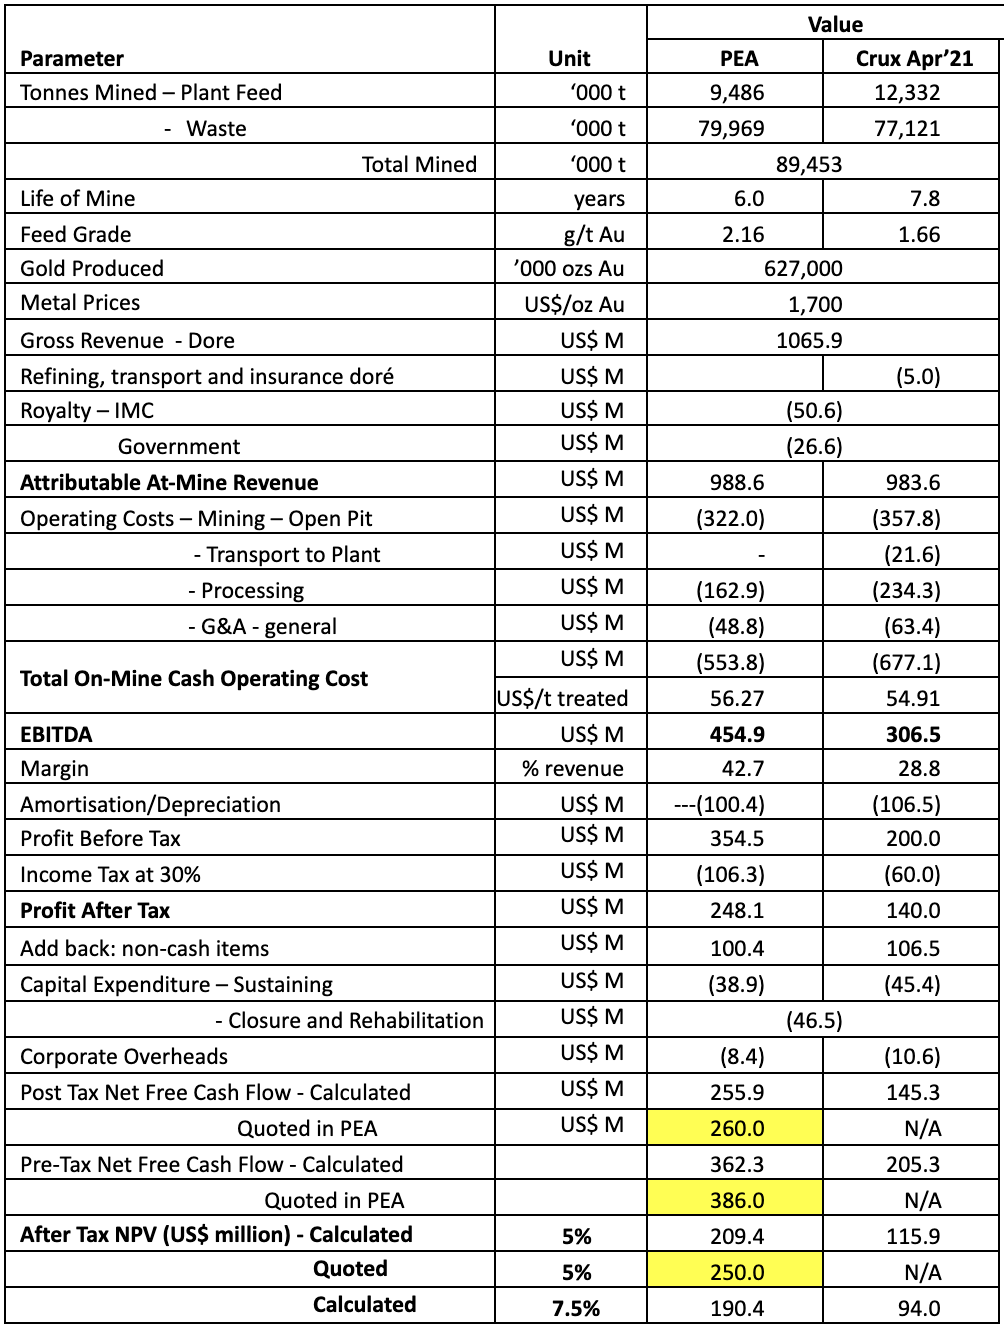
When we use the Novo Resources PEA assumptions to calculate the results, unsurprisingly we get a similar after-tax net free cash flow figure of US$ 255.9 M that is only 1.6% lower than the US$260.0 M quoted by Novo Resources. This difference can be almost fully explained by including transport and treatment charges for the doré.
However, things look very different when all of the points discussed in the previous sections are included in the calculation, namely 30% dilution, an 11% higher mining unit cost rate, and the cost of transportation of ore to the plant. Higher dilution results in a longer LOM resulting in overall higher cost per ounce because of fixed costs (keeping the entire operation running for longer) and processing costs (more tonnes at a lower grade). The overall effect is a drop in net free cash flow of US$115 million. Novo Resources quote a Post Tax Net Free Cash Flow of US$260 million. We calculate it to be US$145 million.
Not only is the absolute number smaller, but when the future time value of money is taken into account via a Discounted Cash Flow (“DCF”) model the Net Present Value (“NPV”) drops significantly. The value today of far-dated cash flow is less than near-dated cash flow which may sound boring, but we all know that £100 in the pocket today is better than the promise of £105 in the pocket in a years’ time.
Our NPV analysis is as follows. Once we have calculated the Post Tax Net Free Cash Flow (US$145.3 M), we then go back to the DCF, apply an appropriate discount rate (5% or 7.5%), to the future years’ value, to generate an NPV. Our figures show an NPV5 of US$115.9 M, and an NPV7.5 of US$94.0 M.
Something strange, however, happens with the Novo Resources figures. Novo Resources quote a Post Tax Net Cash Flow of US$260 M, and then gives the NPV5 of US$250 M. Hmmm, something is wrong here. When we discount our DCF by 5%, the NPV drops by 20%. When Novo Resources discounts the DCF by 5% the company says the NPV drops by 4% (250/260 = 0.9615). (Shurely shome mishtake….Ed?). This is a mathematical impossibility. More information please.
Conclusions
At the end of this update review, we come to the following conclusions:
Novo Resources own valuation of Beatons Creek endorses Crux Investor's conclusion in September 2020 that the company is valued at much more than the intrinsic value of Beatons Creek alone.
There are a number of obvious discrepancies in the press release on the PEA. Given the brevity of the announcement it is not possible to identify the reasons for these discrepancies, which will have to await the publication of the full PEA report. However, the drop of the quoted after-tax net free cash from US$260 million to US$250 million after supposedly discounting at 5% is a mathematical impossibility.
Using the PEA input parameters but including 30% dilution and some adjustments to the operating cost, Crux Investor arrives at a net present value of US$116 million when discounting at 5% and US$94 million when discounting at 7.5%, the higher rate being considered as the more appropriate one to use for this high-risk project.
In September we wrote that the Enterprise Value US$469 million was partially supported by the NPV of Beatons Creek at US$253 million, which represents 54% of the EV. On 14 April, however, the Enterprise Value is US$584 million, and the NPV of Beatons Creek is US$94 million, which represents a mere 16% of the EV. Ouch. Caveat Emptor.
We flag that there are still risks surrounding the value of the project at US$94 million such as:
- Risks associated with the much higher gold grade attributed to Inferred Resources compared to Indicated Resources.
- The results of the bulk sampling exercise in 2018 giving a much lower overall grade of 1.88 g/t Au than the block model grade of 3.16 g/t for the sampled sites.
- The tricky conditions for mining a narrow horizon with gold that is visibly not different from the horizons above and below.
- The difficulties of preventing substantial dilution mining a narrow horizon under commercial mining conditions.
- The implication of all of the above to lead to major revisions to the operating cost and further eroding value.
We think it is an ominous signal that no further news has been forthcoming from the company since the first gold pour on 16 February, which is now 2 months ago.
Want to hear more from the Analysts?
Are you looking for consistent returns for more confident investing? That's where we come in. Crux Investor is an investing app for busy people.
You’ll receive a single stock recommendation each month, curated by industry experts and presented in a clear and focused one-page memo. You’ll also receive access to a platform full of programmes that will allow you to grow your financial knowledge, overall, all at your own pace.
Crux Investor is for anyone interested in saving time while investing with confidence. It's an ideal resource for the novice that needs guidance and is tired of throwing money away with guesses and gambles. But it's also a perfect fit for the experienced investor that wants a faster and more efficient way to arrive at the perfect stock or significantly increase their knowledge.
Finally, you can afford the analysts the big funds use. No more gambling, no more guesswork. Instead, save time, slay stress, and start investing with confidence by joining Crux Investor today.
Analyst's Notes


Subscribe to Our Channel


Stay Informed