

Marimaca Copper (TSXV:MARI): The Golden Cross - An Insight into Marimaca Copper's Buying Signal


Article on the buying signal for Marimaca Copper whereby the 50 day MA crossed above the 200 day MA
On January 25th, 2021, a crucial event occurred in the trading history of Marimaca Copper Corp (TSXV:MARI) - the 50-day moving average (MA) crossed above the 200-day MA, a significant buying signal known as the 'Golden Cross'.
The 'Golden Cross' is one of the most closely watched indicators by institutional traders and analysts worldwide. This bullish signal, which occurs when the short-term 50-day MA moves above the long-term 200-day MA, is a sign of potential positive momentum for a stock. In the case of Marimaca Copper, the occurrence of this signal suggested an imminent bullish run.
Following the crossover in January 2021, the 50-day MA has remained consistently above the 200-day MA. This sustained positive trend is an encouraging sign for investors, signaling continued upward momentum and a stable long-term bullish trend. Despite a noticeable convergence between these two MAs, the fact that the 50-day MA hasn't dipped below the 200-day MA reinforces the strength of this positive trend.
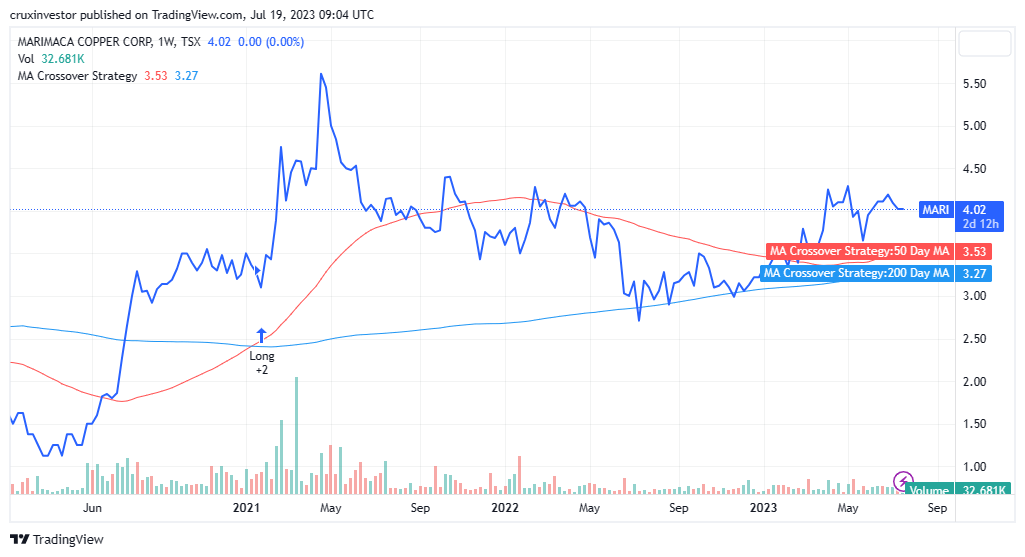
In the year-to-date context of Marimaca Copper's stock performance, we've observed a significant uptick. According to the data presented, the price rose 43.06% in the last 12 months, a strong showing that underscores the company's robust market presence.oreover, the most recent data suggests that the company's stock price gained 0.752% on the last trading day, rising from $3.99 to $4.02.
Notably, the latest trading volumes also saw a substantial increase. Specifically, on the last trading day, 22 thousand more shares were traded than the day before, signaling growing investor interest and potentially contributing to an upward price movement.
In conclusion, the sustained 'Golden Cross' pattern in Marimaca Copper's trading activity and its strong annual performance are strong indicators of an enduring bullish trend. While the 50-day MA and 200-day MA have been converging, the fact that the 50-day MA remains above the 200-day MA implies the continuation of this upward momentum. Thus, despite short-term fluctuations, the long-term trend for Marimaca Copper seems to be heading towards an optimistic trajectory.
Rather than following the previously mentioned method of technical analysis, Crux Investor's investment strategy doesn't heavily depend on technical indicators such as moving averages. Instead, their primary focus lies on fundamental analysis in making their investment choices. Of course, as with any investment plan, individual investors are advised to carry out their independent investigations and decide how much weight they wish to place on technical analysis in controlling their investment portfolios. This would involve a careful examination of different analytic methods and a clear understanding of their risk tolerance. With these considerations in mind, investors can construct a bespoke strategy that complements their financial objectives and market outlook.
To find out more, go to the Marimaca Copper website
Analyst's Notes


Subscribe to Our Channel


Stay Informed


