Your Guide To The Crux Investor Index: Do Higher-Rated Miners Deliver Bigger Returns?


Does the Crux Score predict mining stock returns? We analyze 1Y & 5Y data to reveal if higher-rated miners outperform—or if hidden gems exist below!
Origins of The Crux Investor Index
Before we even had a web presence, our small team of expert industry analysts kept an internal-use-only numeric scoring system to map out which companies we wanted to invite for interview or keep tabs on for our family office investments.
The methodology behind it was and is straightforward:
- Weigh certain criteria that matter to our investment thesis, such as Management Track Record, Scaleablility of Project, Commodity Price Risk & Industry Trends, Social Licence, Jurisdictional Risk, Technical/Operational Factors and more.
- Aggregate these inputs into a single weighted average out of 10.
- Review the rating for every company under review once per quarter, or whenever material news is released which might significantly change our outlook for that company.
Why We Went Public
In February 2022, we decided to show Crux Score (as it was known then) on our site for all the companies on our database in a “whole‐of‐market” approach. Our hope was and still is is that it provides discerning retail and professional investors alike with an extra data point—alongside their own due diligence—to help navigate the resource sector’s complexity.
It’s important to note: The Crux Investor Index is based on our own team’s fundamentals-driven, long-term, growth-oriented investment approach. That is the basis on which we assess risk and deploy capital. Not all investment styles or time horizons will align with ours. And yes, you’ll likely find “low‐scoring” companies that happen to enjoy stellar returns over specific short time frames—perhaps due to unexpected arbitrage, speculation, or unusual news events.

The Bigger Picture: Crux Investor Index Distribution
Our coverage is ever‐expanding - 1.3% of companies we track are still unscored as of January 2025. With new entrants, it’s a constant work in progress. However, we aim to keep coverage near 99%.
Overall, The Crux Investor Index is typically on the cautious side:
- Nearly ⅔ of companies (64%) in our database hold an index of 4 or lower.
- Just 9% are rated 7 or more. (This is obviously a much smaller cohort, reflecting how few companies truly check all the boxes in the eyes of our analysts.)
- Among companies rated 8+, ⅔ (66%) are later‐stage developers or producers (reflecting lower risk profiles, proven assets and/or track records).
These distributions shouldn’t be a shock for those who’ve followed the ups and downs of the resource sector over time. Explorers, by definition, carry more risk and thus typically have lower scores. And in cyclical industries like mining or energy, many players underperform in the long run.
The Crux Investor Index in Action: Analyzing 1‐Year & 5‐Year Returns
To understand general performance at a glance, we grouped the companies from our entire database into three main brackets:
- “Higher‐Scoring”: Crux Investor Index of 7 or more
- “Mid-Scoring”: Crux Investor Index of 5-6
- “Lower‐Scoring”: Crux Investor Index of 4 or below
We then compared Performance 1Y (the change over the last 12 months) and Performance 5Y (the cumulative change over five years) and the trend was decisively clear.

The High‐Scorers (7+)
Collectively, these companies demonstrated:
- Strong average 1Y returns, often in the +40% to +80% range.
- Even stronger 5Y returns—in many cases, triple‐digit to quadruple‐digit gains.
Certainly, outliers exist. Some well‐managed producers or near‐production developers soared in value, especially in commodity cycles that favoured gold, copper, lithium, or uranium.
Example: WA1 Resources (Crux Index = 8) posted a 5‐year performance in excess of +5,300%—an astronomical figure by most measures. This success likely stems from catalytic discoveries, effective capital raises, and positive commodity pricing that lined up with their critical metals focus.
Not every single company with a high Crux Investor Index had all‐green performance. A few have negative 1‐year returns, perhaps from short‐term commodity headwinds. Yet overall, their multi‐year results remain strong, reflecting more stable long‐term fundamentals.
Example: ISOEnergy (Crux Index = 9) posted a 5‐year performance in excess of +754%, but down ~30% on the 1Y scale, largely attributable to U spot rally coming off 15+ year Highs in Jan / Feb 2024.
Interestingly, when drilling down further into this grouping and looking at the performance of those companies with a 7, 8 or 9 rating (no companies have a 10), the 8's perform the best over 1 and 5 years.

Our conclusion as to why the 9's have performed less well that our 8's, is that the 9's tend to be larger, more established, and lower-risk, may have less room for explosive growth compared to their slightly smaller yet well-positioned Crux 8 counterparts. The Crux 8 group likely benefits from strong momentum and positive catalysts while still maintaining a relatively stable risk profile, making them the sweet spot for long-term performance at present.
The Mid‐Scorers (5-6)
The mid‐rated companies are typically higher risk than the High-Scorers in our view. More of them are late-stage explorers / early developers but agood number display at least a view through to production / commercial event; and most have some clearly defined near-term catalysts.
- Flat 1Y returns
- Variable 5Y returns, averaging 80%
That said, exceptions do happen—some 5‐6 scorers can deliver big returns for those comfortable with short‐term or special‐situation bets (perhaps where companies are reliant on attracting the right JV partners with the right incentives to invest and develop a project before the market assigns credit)
Example: GR Silver Mining (Crux Index = 6) showed 1Y SP uplift of 90%, following their financial turnaround (settling of their dispute with Mako Mining, disposal of non-core assets, new discoveries and ultimately new management at board level).
Example: Ridgeline Minerals (Crux Index = 6) has a healthy 1Y performance of 21% in the current environment, and 625% over 5Y by pursuing their prospect generator model where South32 and Nevada Gold Mines have JV’d to fund exploration whilst Ridgeline retain non-dilutive free carries to production on these partnered projects, whilst advancing 100% owned assets.
The Low‐Scorers (4 or Less)
By contrast, these lower‐rated companies are typically the highest risk. Most of them are early‐stage explorers / developers with limited or no production, operating in uncertain jurisdictions, or lacking - as far as Crux Investor can see - any near‐term catalysts. Information is limited.
- A significant portion had negative or only modest 1‐year returns.
- Over 5 years, plenty posted subpar or negative results, especially if they stalled on financing, encountered drilling challenges, or had repeated stock dilutions.
That said, exceptions do happen—some sub‐4 scorers can and have delivered huge 1Y and 5Y returns, Larvotto Resources (1Y 839% growth) and Founders Metals (5Y 1270% growth) being 2 such examples.
This highlights the complexity of the resource space. Our Index is an aggregated, forward‐looking estimate that emphasizes fundamental risk (especially when contrasted with an absence of information which is greater the earlier in a mining companies development journey you go).

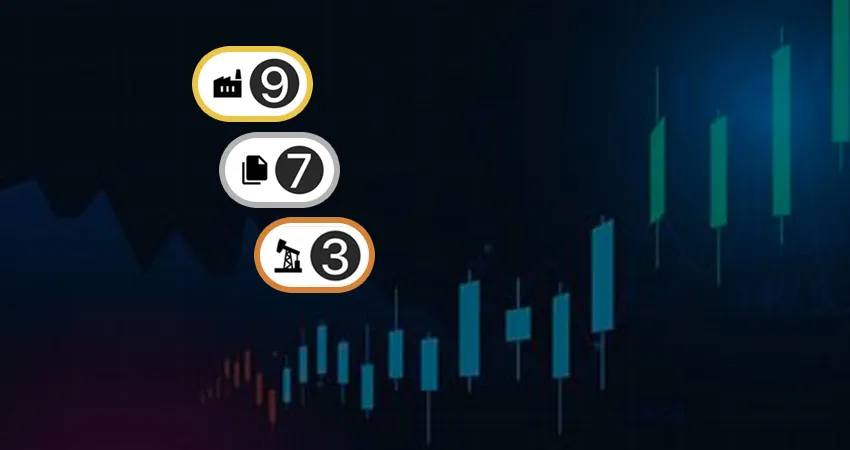
How We Display Score & Development Stage
Each company’s Index is displayed on our site, alongside an icon denoting its most advanced stage of development. So a single project in production means the entire company is flagged as “producer,” even if it also has multiple earlier‐stage assets.
Why do we do this?
- Indexing is stage‐sensitive—An explorer with an Index of 8 is in a fundamentally different situation than a long‐producing gold miner with an Index of 8.
- Clearer context—You can then interpret whether “8 out of 10” means strong fundamentals for a late‐stage asset or a truly exceptional exploration story.
If you spot a company on our site without a stage icon, it might be because they’re newly formed, or we missed an update. (We do try to catch these at each quarterly review.)
Is Crux Investor Ever “Wrong”?
The Crux Investor Index is, at the end of the day, a human and fundamentals‐driven set of assessments. We track an enormous number of companies, and we don’t claim omniscience! Some companies with a low Index do occasionally enjoy booms as we've already detailed above - like a major discovery hole or a sudden commodity spike. At the exploration end of the spectrum, the risk factors naturally tend us towards the lower indexes and there is typically an absence of data on which to offset that risk factor.
And conversely, some companies with high Indices can disappoint in the short run if they face permitting delays or commodity‐cycle downturns.
Example: Fortescue Metals Group (Crux Index = 7) had a 1Y performance of –35.6%, even though its 5Y stands at +63.57%. Over the short run, negative iron ore sentiment, currency fluctuations, or cost pressures might have weighed on share price—despite Fortescue’s strong track record and overall fundamentals that contributed to the “7” rating.
The Crux Investor Index is not about calling next week’s price swings. We embed a medium‐to‐long‐term vantage point. That’s why Fortescue still ranks well with us when following the longer term trend - exactly the type of trend that the Crux Investor Index tries to capture.
Summing It All Up
Index Ranges
- 64% of the companies we track hold a Crux Index of 4 or lower, reflecting the inherent risk in early‐stage or uncertain juniors.
- Only 9% get a 7 or above, typically for reasons like strong balance sheets, experienced management, low jurisdictional risk, or advanced/larger assets.
Performance Trends
- Higher‐Scoring companies (≥7) show much stronger returns both on average 1Y and 5Y. Many have soared beyond +200%, +500%, or even +1,000% in the five‐year window.
- Mid‐Scoring companies (5-6) can be a mixed bag: mostly modest or negative average returns, albeit with some big winners like Ridgeline Minerals.
- Lower-Scoring companies (<= 4) can are mostly negative returns, with some outliers
Methodology
- Crux Index is updated quarterly or when pivotal news arises.
- It’s a weighted average that includes Commodity Risk, Technical & Operational Factors, Management Execution, and more.
- We remain bullish on many commodities in the mid‐ to long‐term, so our scoring might underplay short‐term volatility that can still produce major gains (or losses).
Disagreements & Disclaimers
- We welcome corrections on factual developments.
- Otherwise, Crux Investor Index reflects our views. You should always do independent due diligence before investing.
- We accept no liability for decisions made based on Crux Investor Index.
Final Thoughts
If there’s a single takeaway, it’s this: higher Crux Investor Indices have tended to correlate with stronger 1‐year and 5‐year share price performance—but that doesn’t guarantee future returns. Nor does it invalidate lower‐scoring speculative plays that might see short‐term spikes.
Ultimately, The Crux Investor Index is one piece of the puzzle, aiming to distill fundamental risk/reward and longer‐term potential. Our distribution and track record so far suggest the metric can be a valuable directional indicator, though like all tools, it must be used in conjunction with your own analysis and an understanding of your personal risk tolerance.
“We encourage you to use The Crux Investor Index as one input among many, mindful that any major shift in a company’s fundamentals—or even a random market mania—can always surprise us and lead to outlier results.”
Want to Know More?
- Feel free to visit our site for the complete list of companies and their Crux Investor Indexes, with updates posted at least quarterly or upon significant news.
- If you spot outdated data or have found a development that might impact a company’s rating, get in touch here.
Happy investing! And remember: the best trades combine solid fundamentals, a well‐timed entry, and that ever‐important commodity cycle tailwind. Let The Crux Investor Index be part of your toolkit—but never a substitute for deep research.
Analyst's Notes


Subscribe to Our Channel


.jpg)
.jpg)


Stay Informed