

Iran-Driven Oil Inflation & Fed Rate Paralysis Suppress Silver 35% Below Record Despite a Sixth Consecutive Annual Supply Deficit


Iran war oil shock and Fed rate paralysis suppress silver 35% below its January 2026 record despite a sixth consecutive 46.3Moz structural deficit.
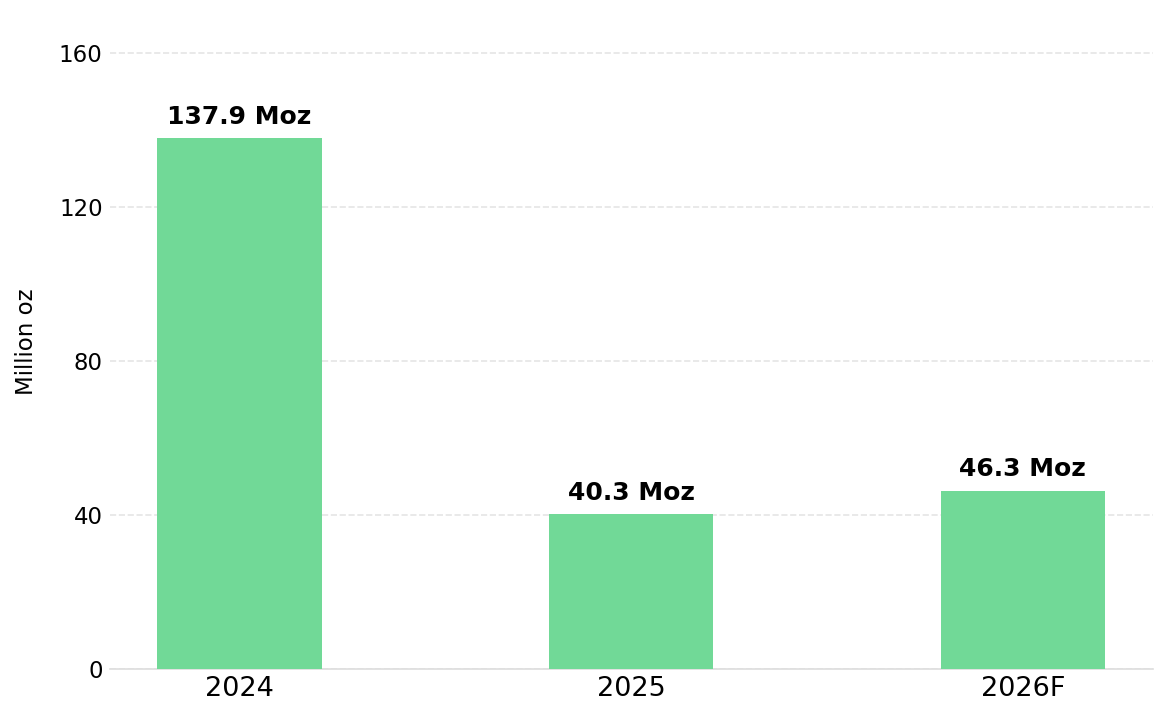
- The Silver Institute and Metals Focus April 15, 2026 World Silver Survey projects a 46.3 million ounce deficit in 2026, 15% wider than 2025's shortfall, with 762 million troy ounces drawn from stocks since 2021 and squeeze risk flagged by Metals Focus Managing Director Philip Newman.
- Silver has corrected 35% from its January 29, 2026 record of $121.6 per ounce to near $79 to $80 per ounce in April 2026, as Brent crude near $100 per barrel, a firm dollar, and the Federal Reserve hold at 3.5% to 3.75% with one 2026 cut raise the opportunity cost of a non-yielding metal.
- Federal Open Market Committee minutes from March 17 to 18, 2026 confirm a divided committee, with the vast majority judging upside inflation and downside employment risks had increased with Middle East developments. J.P. Morgan Global Research forecasts the Federal Reserve will stay on hold at the April 28 to 29 meeting and through the remainder of 2026, with the next move likely a 25 basis point hike in the third quarter of 2027.
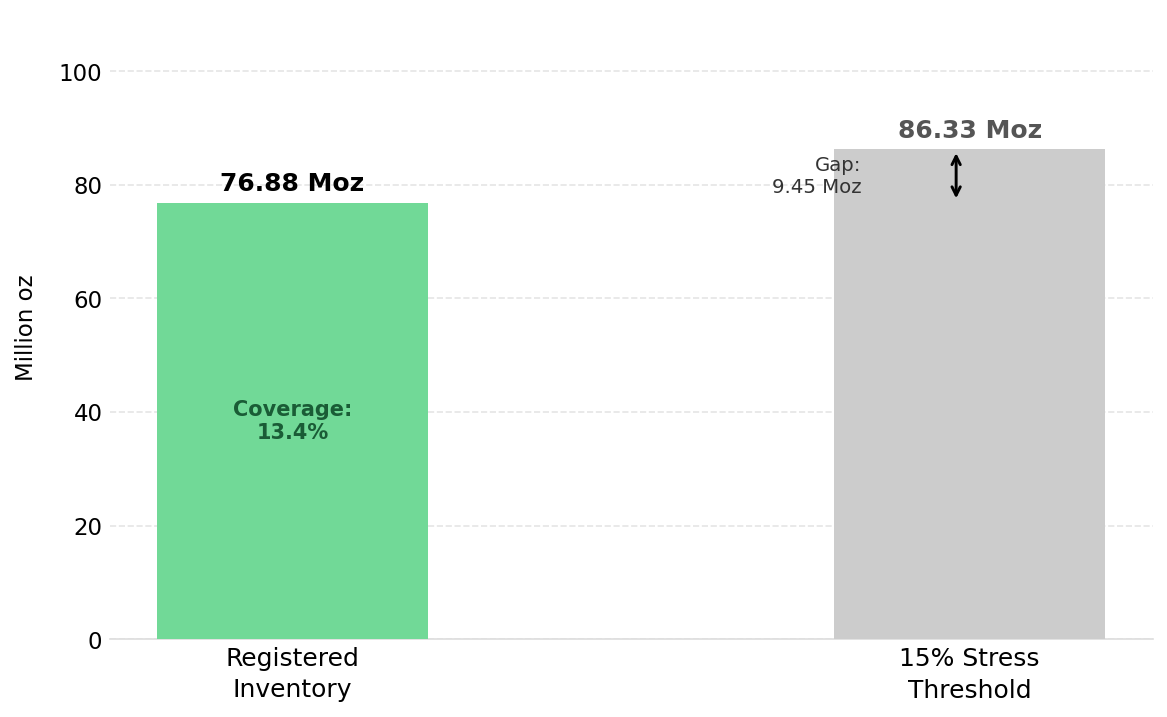
- COMEX registered silver inventory at 76.88 million ounces against 575.5 million ounces of open interest, a coverage ratio of 13.4% below the 15% stress threshold for six consecutive periods per CME Group data, as First Notice Day approaches with eligible inventory draining across four vaults.
- Silver equity returns are determined by execution: producers at bottom-quartile all-in sustaining costs (AISC) and development-stage companies advancing resources toward maiden Preliminary Economic Assessments (PEAs) without dilutive financings are best positioned when macro suppression resolves.
Macro Capital Rotation Suppresses Silver Despite a Persistent Deficit
Silver's approximately 35% correction from its January 29, 2026 all-time high of $121.6 per ounce has occurred while the physical market's deficit has simultaneously widened. The Silver Institute and Metals Focus Survey projects a 2026 shortfall of 46.3 million ounces, the sixth consecutive annual deficit, with 762 million troy ounces drawn from above-ground stocks since 2021.
The Iran war has pushed Brent crude near $100 per barrel, with the blockade of the Strait of Hormuz, a waterway handling approximately 20% of global oil and liquefied natural gas supplies, sustaining headline inflation. Reuters reported on April 21, 2026 that Brent briefly spiked to $101.15 per barrel, with Trafigura Chief Economist Saad Rahim estimating at the Financial Times Global Commodities Summit that supply losses had reached one billion barrels. Rystad Energy Chief Oil Analyst Paola Rodriguez-Masiu reported Gulf state production declined to 14.3 million barrels per day in April, approximately 13 million below pre-war levels.
Dollar strength has compounded the energy price shock, with Federal Open Market Committee minutes noting that sentiment toward the dollar became more positive, buoyed by safe-haven demand and US net energy exporter status, raising the international cost of dollar-denominated commodities for non-US buyers. Federal Reserve policy has reinforced the real yield pressure: the committee voted 11 to 1 to hold rates at 3.5% to 3.75% at its March 2026 meeting, with the minutes confirming upside inflation risks and downside employment risks were both elevated. J.P. Morgan Global Research forecasts a hold at the April 28 to 29 Federal Open Market Committee meeting, with Chief US Economist Michael Feroli stating that the March jobs report rebound and contained core inflation "should make the late April FOMC meeting an easy call for the Committee to stay on hold," and rates on hold through 2026, with the next move likely a 25 basis point hike in the third quarter of 2027.
Silver pays no coupon, derives approximately 57% of its demand from industrial applications per the Silver Institute's 2026 data, and trades as a dollar-denominated asset. Elevated real yields raise the opportunity cost of holding silver, a firmer dollar compresses international purchasing power, and oil-driven inflation raises producer operating expenses.
Six Consecutive Annual Deficits Have Depleted the Physical Market's Inventory Buffer
The Silver Institute's World Silver Survey data shows total global silver supply declining 2% in 2026 to 1,066.4 million ounces, with mine production at 844.1 million ounces and net hedging supply falling from 44.7 million ounces in 2025 to 10.0 million ounces, while total demand falls a lesser 2% to 1,112.6 million ounces. The above-ground inventory buffer has been continuously depleted for six consecutive years, reducing the market's capacity to absorb demand shocks to its lowest point since 2021.
COMEX Coverage Deterioration Elevates Physical Delivery Risk Ahead of the May Cycle
Per the CME Group Daily Metal Stocks Report dated April 13, 2026, COMEX registered silver inventory stands at 76.88 million ounces against open interest of approximately 575.5 million ounces, a coverage ratio of 13.4% below the 15% stress threshold for six consecutive reporting periods. As the May 2026 delivery cycle approaches First Notice Day, eligible inventory has simultaneously drained across four vaults without offsetting inflows. In January 2026, 33.45 million ounces were withdrawn in a single week, representing approximately 26% of the then-deliverable pool in seven days.
Metals Focus Managing Director Philip Newman has flagged that conditions for a repeat of the October 2025 London liquidity squeeze remain present if elevated price volatility, a revival of Indian demand, and resumed exchange-traded product inflows converge. Metals Focus estimates that 28% of 884 million ounces held in London vaults at end-March 2026 were potentially available to support liquidity, up from a historic low of 17% in September 2025 that preceded the October squeeze.
China's Export Licensing Limits the Market's Capacity to Absorb Demand Shocks
China accounts for approximately 20% of global refined silver supply at 3,000 to 3,300 metric tons annually, and its replacement of an open export system with a 44-licensed-exporter framework for 2026 and 2027 has reduced the responsiveness of Chinese supply to external price signals. Shanghai Futures Exchange inventories are down approximately 15% since mid-2025. When global spot prices rise sharply, licensed frameworks cannot respond with the speed that open systems historically provided, meaning demand-driven price acceleration would be amplified relative to prior cycle episodes.
Industrial Demand Provides a Consumption Floor That Persists Through Macro Corrections
Silver's demand base has shifted materially toward industrial applications that are not price-elastic in the way discretionary consumer demand is. According to the Silver Institute's World Silver Survey 2026, total industrial fabrication, while forecast to fall 3% to 639.6 million ounces driven by Iran-war-related growth concerns, still represents the single largest demand category, absorbing approximately 57% of total annual supply. This is structural demand from sectors whose capital investment cycles are measured in decades, not quarters. It does not disappear with a macro correction.
Solar & AI Infrastructure Demand Offsets Near-Term Thrifting Pressure on Silver Consumption
Silver paste is used as an electrical conductor in solar panel manufacturing, and while thrifting, the reduction of silver content per panel as technology improves, is a near-term headwind, global solar installation capacity is expanding at approximately 15% annually, more than offsetting per-panel efficiency gains. The Silver Institute and Oxford Economics project solar, electric vehicle, and data center applications will drive industrial silver consumption higher through 2031, with AI infrastructure adding a compounding vector. J.P. Morgan's Head of Base and Precious Metals Strategy, Gregory Shearer, has acknowledged that thrifting trends "will leave scar tissue on silver balances over the coming quarters," but conceded these changes "may take years to play out."
Operational Execution & Balance Sheet Discipline Determine Which Equities Capture the Re-Rating
Americas Gold and Silver (TSX: USA; NYSE American: USAS), a primary silver and critical minerals producer in the United States and Mexico, delivered a record 787,000 ounces of consolidated silver production in Q1 2026, a 76% year-over-year increase from 446,000 ounces in Q1 2025, alongside record sales of 830,000 ounces and a cash balance of US$122.6 million at March 31, 2026. Full-year 2026 guidance targets 3.2 to 3.6 million ounces at an AISC of US$30 to US$35 per ounce sold, representing approximately 30% growth over 2025's 2.65 million ounces. At current spot prices near $79 to $80 per ounce, that AISC range implies gross operating margins of $44 to $50 per ounce.

The No. 3 Shaft Phase 2 upgrade at the Galena Complex in Idaho, the company's 100%-owned flagship asset holding Measured and Indicated silver resources of 87.9 million ounces at 500.9 g/t AgEq, targets a 160% increase in hoisting capacity from 40 short tons per hour in 2024 to approximately 105, distributing fixed costs across a larger ounce base and compressing AISC. The 2026 capital expenditure program of US$90 to US$120 million is fully funded from existing cash and a US$50 million undrawn facility.
Oliver Turner, Executive Vice President of Corporate Development at Americas Gold and Silver, quantifies the throughput gain from the Phase 2 upgrade and its direct impact on unit costs:
"We'll be in and around that 800 to 900 tons of ore per day by mid-May here. So we've completely de-bottlenecked the number three shaft, but that also of course is going to drive down your hoisting cost per ton."
Funded Development Programs & Discovery Efficiency Position Developers for Valuation Re-Rating
Development-stage silver companies are valued on enterprise-value-per-ounce (EV/oz) frameworks that compress during spot price corrections. The transition to net present value (NPV) and internal rate of return (IRR) frameworks, triggered by a maiden PEA, represents the most significant valuation step-change in a developer's lifecycle, independent of near-term spot price. GR Silver Mining (TSX-V: GRSL; OTCQX: GRSLF), a development-stage company advancing the Plomosas Silver Project in Sinaloa, Mexico, is targeting that transition in late 2026. Its NI 43-101 Mineral Resource Estimate, effective May 3, 2023, defines 134 million ounces of silver equivalent, with 85 Moz indicated at 162 g/t AgEq and 49 Moz inferred at 166 g/t, at a discovery cost of CAD$0.17 per ounce.
A 20,000-meter step-out drilling campaign at San Marcial is underway, where 80% of the geological target remains untested, with completion targeted in early H2 2026 to support an updated Mineral Resource Estimate ahead of the maiden PEA. The company holds CAD$28.2 million in cash with zero debt, providing a fully funded runway through the catalyst window.
Daniel Shea, Vice President of Corporate Development at GR Silver Mining, defines the capital efficiency underpinning the resource expansion program:
"Our discovery cost per ounce of silver is 17 cents. So for every investor that is investing in GR Silver, when we put a dollar in the ground we get about 5 ounces of silver out of that, and so that is huge."
The Investment Thesis for Silver
- The sixth consecutive annual supply deficit of 46.3 million ounces in 2026, established by the Silver Institute and Metals Focus, is a structural imbalance that macro forces can delay but not eliminate.
- COMEX registered silver inventory at a 13.4% coverage ratio below the 15% stress threshold for six consecutive periods per CME Group creates asymmetric physical squeeze risk ahead of May 2026 First Notice Day.
- China's 44-licensed-exporter framework removes the market's primary supply release valve, increasing the probability of amplified price responses once investment flows reverse, compounded by Shanghai Futures Exchange inventories down 15% since mid-2025.
- The Federal Reserve's hold-through-2026 posture from the March 2026 FOMC minutes defines the suppression window as bounded by rate cycle progression and Iran ceasefire resolution, not fundamental deterioration.
- Industrial demand from solar photovoltaics, semiconductors, and AI data centers provides a structural floor regardless of monetary conditions, with the Silver Institute and Oxford Economics projecting expansion through 2031.
- Producers at bottom-quartile AISC with fully funded programs and developers advancing high-grade resources toward maiden PEA milestones represent the two clearest re-rating pathways when macro conditions shift.
Silver's 35% correction from its January 2026 record reflects a macro-driven dislocation with identifiable causes, Iran-driven oil inflation and Federal Reserve rate paralysis, and resolution triggers: a durable Iran ceasefire confirmation, guidance at the April 28 to 29 FOMC meeting, and the COMEX May delivery cycle. The Silver Institute's sixth consecutive deficit and J.P. Morgan Global Research's $81 per ounce 2026 average point to a tightening physical market. Which companies convert that recovery into share price performance depends on execution discipline, balance sheet resilience, and proximity to re-rating catalysts.
TL;DR
Silver has corrected 35% from its January 2026 record of $121.6 per ounce as Brent crude near $100 per barrel, a stronger dollar, and a Federal Reserve dot plot reduced from two 2026 cuts to one redirect capital away from the non-yielding metal. The Silver Institute and Metals Focus project a sixth consecutive annual deficit of 46.3 million ounces, 15% wider than 2025, with 762 million ounces drawn from stocks since 2021. Execution discipline and balance sheet resilience, not spot price, determine who captures the next re-rating leg.
FAQs (AI-Generated)
The correction is driven entirely by macro capital rotation, not deteriorating fundamentals. Brent crude near $100 per barrel, driven by the Iran war and Strait of Hormuz blockade, has reinforced inflation expectations and kept the Federal Reserve on hold at 3.5% to 3.75%. Elevated real yields raise the opportunity cost of holding a non-yielding asset like silver, while a firmer US dollar compresses purchasing power for international buyers. The Silver Institute and Metals Focus confirmed a sixth consecutive annual supply deficit of 46.3 million ounces in 2026, the price correction and the physical fundamentals are pointing in opposite directions.
The COMEX coverage ratio measures the proportion of registered physical silver inventory available for immediate delivery against total open futures contract interest. Per CME Group's April 13, 2026 Daily Metal Stocks Report, COMEX registered silver inventory stands at 76.88 million ounces against approximately 575.5 million ounces of open interest, a coverage ratio of 13.4%, below the 15% stress threshold for six consecutive reporting periods. This means approximately 7.5 paper ounces exist for every deliverable physical ounce. When delivery rates rise, as they did in January 2026 when 33.45 million ounces were withdrawn in a single week, inventory can deplete rapidly, creating acute physical squeeze conditions similar to the October 2025 London liquidity event.
The Iran war suppresses silver through two mechanisms. First, it has pushed Brent crude near $100 per barrel via the Strait of Hormuz blockade, sustaining headline inflation and preventing Federal Reserve rate cuts. Second, it redirects institutional capital toward energy-linked and yield-bearing assets and away from non-yielding metals. A durable ceasefire resolution would remove both mechanisms simultaneously: oil prices would ease, inflation expectations would moderate, rate cut probability would increase, and the dollar would weaken. Each of these individually would be bullish for silver; all four converging at once would represent a significant catalyst for the repricing of a metal entering its sixth consecutive year of structural deficit.
J.P. Morgan Global Research expects the Federal Reserve to hold rates at 3.5% to 3.75% through all of 2026, with the next policy move likely a 25 basis point hike in the third quarter of 2027 if inflation remains unanchored. March 2026 FOMC minutes confirm the committee is navigating a stagflationary environment where oil-driven inflation and softening employment pull policy in opposite directions. Rate cuts would directly benefit silver by reducing real yields, the principal opportunity cost of holding the metal, and by weakening the US dollar, which reduces the international cost of dollar-denominated silver. Goldman Sachs projects silver averaging $85 to $100 per ounce in 2026 and identifies it as the primary strategic metal of the green transition, with price upside dependent in part on monetary policy normalization.
Three variables determine which silver equities outperform during macro-suppressed corrections. The first is AISC trajectory: producers reducing cost per ounce through throughput growth, rather than relying on higher spot prices, expand margins mechanically and generate free cash flow regardless of where silver trades. The second is balance sheet depth: companies with fully funded capital programs and no near-term dilution requirement preserve share price leverage to the eventual re-rating rather than surrendering it to new equity holders. The third is catalyst proximity: for development-stage companies, the transition from enterprise-value-per-ounce to net present value and internal rate of return valuation frameworks, triggered by a maiden Preliminary Economic Assessment, is a re-rating event driven by project delivery, not spot price, and therefore independent of the macro suppression cycle.
Analyst's Notes


Subscribe to Our Channel


Stay Informed


