

Silver Mining Stocks: Why The $60 Breakthrough Could Unlock Major Investment Returns in 2025-2026


Silver approaches critical $60/oz threshold amid 184 Moz structural deficit. Four mining companies positioned for major gains as solar demand surges.
- The silver market recorded a 184.3 million ounce deficit in 2023. While early 2024 forecasts projected a 17% increase, actual 2024 data showed the deficit decreased to 148.9 million ounces, marking the fifth consecutive year of structural deficits. This persistent shortfall reflects industrial demand growth that significantly outpaces new mine supply, creating fundamental support for higher prices. Unlike previous cycles driven primarily by investment demand, the current deficit stems from irreversible industrial consumption, particularly in solar photovoltaic panels, where silver paste serves essential conductive functions with limited substitution potential.
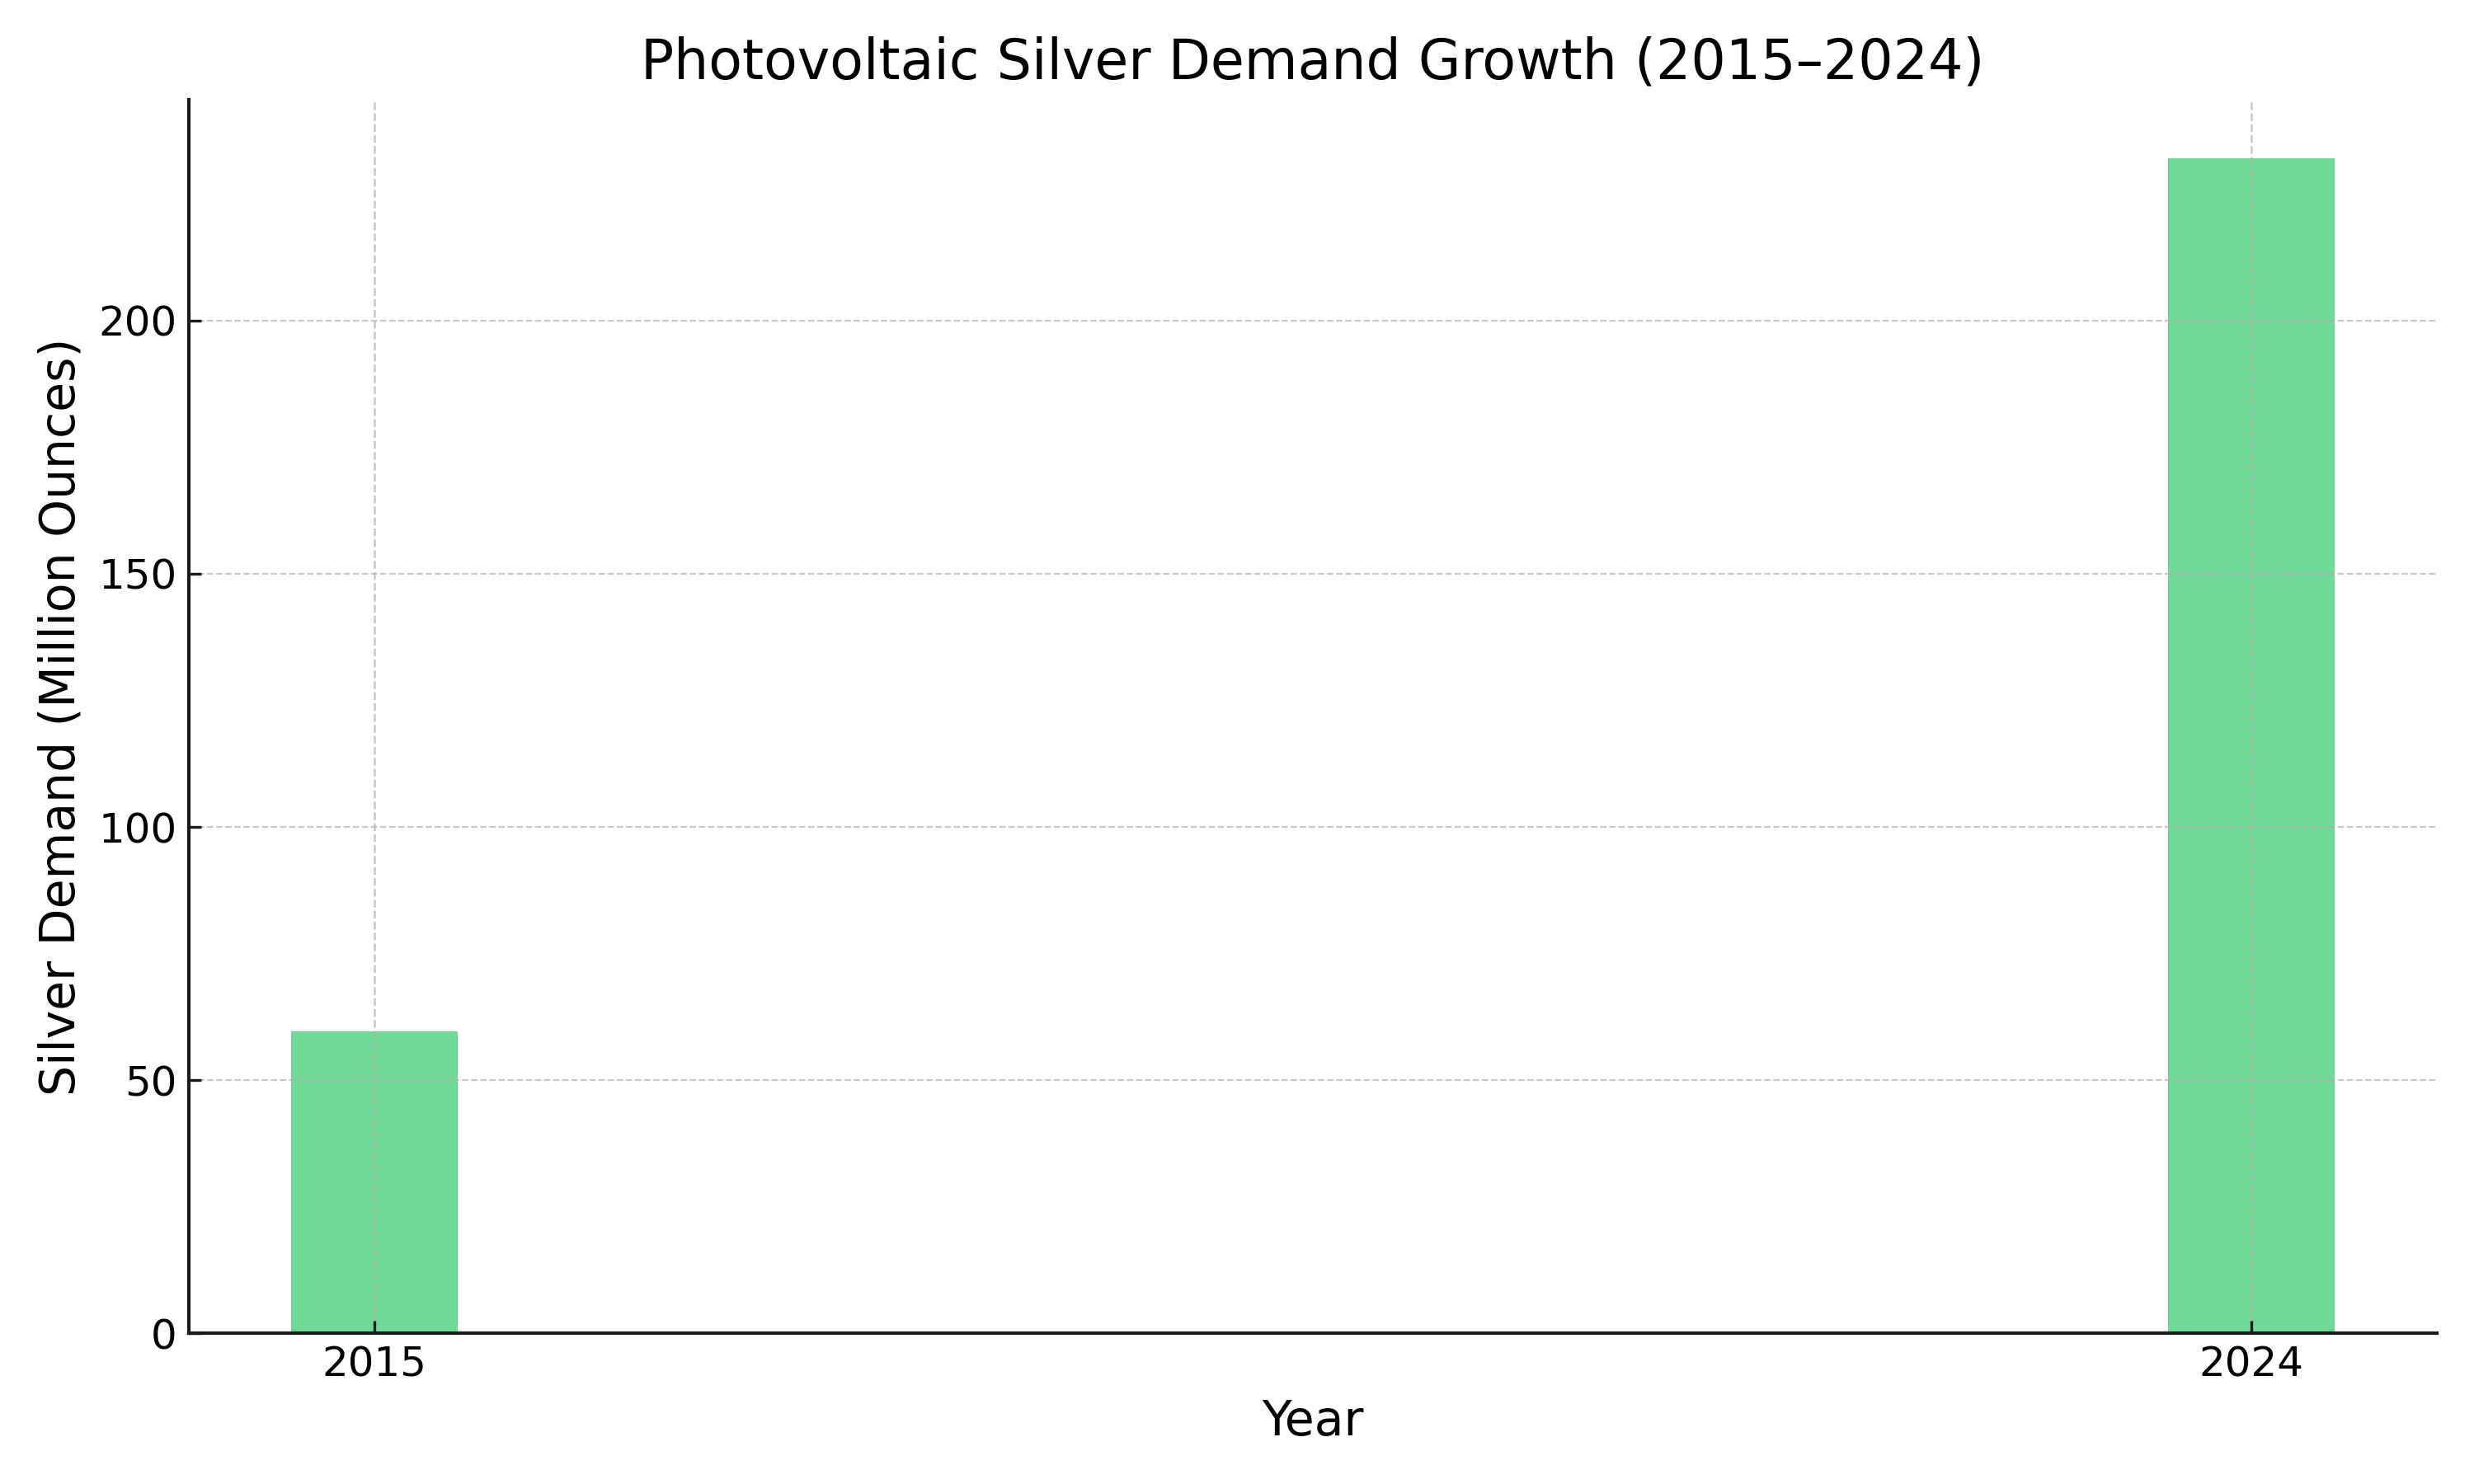
- Photovoltaic silver demand has nearly quadrupled since 2015 (from 59.6 million ounces to 232 million ounces in 2024), making solar panels the fastest-growing industrial silver application. With global commitments to renewable energy targets and net-zero emissions pathways, solar panel installations continue accelerating. Each gigawatt of solar capacity requires approximately 700,000 ounces of silver, translating renewable energy mandates directly into sustained silver consumption that mining supply struggles to match.
- Silver recently tested the $60 per ounce level, a price point that carries significant psychological weight for both producers and investors. Historical analysis suggests that breakouts above major round-number thresholds often trigger momentum-driven rallies as technical traders and systematic funds increase position sizes. While short-term volatility remains elevated, with support identified near $54-55/oz, sustained movement above $60 could catalyze a broader re-rating of silver mining equities, particularly junior and mid-tier producers with high operating leverage to spot prices.
- Silver mining companies currently trade at historically low valuations relative to net asset values, with developers averaging 0.76-0.88× P/NAV multiples. This discount persists despite robust project economics in the $50-60/oz price environment. Vizsla Silver's Panuco project exemplifies exceptional feasibility-stage economics with an after-tax IRR of 111% and a 7-month payback period at $35.50/oz silver, demonstrating the substantial leverage available to advanced-stage developers in high-grade jurisdictions.
- Investors seeking silver exposure can optimize risk-adjusted returns by diversifying across the value chain: established producers with immediate cash flow generation (Americas Gold & Silver), near-term development projects with completed feasibility studies (Vizsla Silver), high-grade exploration stories with resource growth potential (GR Silver Mining), and innovative reprocessing plays accessing above-ground resources (Cerro de Pasco Resources). This portfolio approach balances production certainty, exploration upside, and valuation optionality while maintaining concentrated exposure to silver price movements.
Why Silver Mining Stocks Deserve Investor Attention in 2025-2026
Silver markets entered 2025 with momentum that few commodities can match. Trading around $57-58 per ounce (a 239% increase since 2016, when silver averaged $17.11 per ounce), the white metal confronts a rare combination of structural supply deficits, accelerating industrial demand, and favorable technical positioning. For sophisticated investors evaluating mining equities, silver presents a compelling risk-reward proposition anchored in fundamental scarcity rather than speculative enthusiasm.
Unlike precious metal rallies driven primarily by monetary policy expectations or inflation hedging, the current silver cycle reflects genuine physical tightness. The Silver Institute reported a 184.3 million ounce market deficit in 2023. The actual 2024 deficit came in at 148.9 million ounces (lower than the 215.3 million ounce projection made in early 2024), marking the fourth consecutive year of structural deficits. Looking ahead, Metals Focus projects a 117.6 million ounce deficit for 2025. This shortfall stems from industrial applications (particularly solar photovoltaic panels) that consume silver irreversibly, removing it from potential recycling streams. As renewable energy mandates intensify globally, silver's role as an essential industrial commodity overshadows its historical function as a store of value.
.png)
Recent technical analysis identifies $60 per ounce as a critical psychological threshold, noting that silver has experienced sharp volatility approaching this level, with potential support zones at $54-55 per ounce providing downside buffers. A sustained break above $60 could "open up the floodgates" for further upside, catalyzing momentum-driven buying from technical traders and systematic investment strategies. This technical setup, combined with fundamental tightness, creates a favorable environment for silver mining equities, particularly companies advancing high-grade projects toward production.
Global Silver Demand Drivers: Solar, Electronics, & Industrial Applications
Silver's industrial applications have fundamentally transformed the metal's demand profile over the past decade. Photovoltaic solar panels now represent the fastest-growing consumption category, with demand increasing 286.7% from 60 million ounces in 2015 to 232 million ounces in 2024 according to the Silver Institute. Each gigawatt of solar capacity requires approximately 700,000 ounces of silver for conductive paste applications.
Beyond solar, electronics manufacturing (including 5G infrastructure, automotive electrification, and semiconductor production) sustains baseline industrial demand. The semiconductor industry's expansion, driven by artificial intelligence compute requirements and Internet-of-Things proliferation, adds incremental consumption that mining supply struggles to accommodate. Unlike investment demand, which fluctuates with monetary policy and market sentiment, these industrial applications create persistent, price-inelastic consumption patterns.
The structural deficit manifesting in silver markets since 2021 reflects the intersection of accelerating industrial demand and constrained primary supply. Major silver-producing regions (Mexico produced 186.0 million ounces in 2024, followed by China at 110.1 million ounces and Peru at 108.0 million ounces) face permitting challenges, declining ore grades, and operational disruptions that limit production growth. Global mine production peaked at 900.1 million ounces in 2016 and has declined for nearly a decade to 819.7 million ounces in 2024. Notably, 70-80% of silver is produced as a byproduct of copper, lead, and zinc mining, making supply highly inelastic to price increases. This supply-demand imbalance underpins bullish price forecasts and positions silver mining companies as direct beneficiaries of tightening fundamentals.
Mining Supply Constraints & Production Economics
Silver mining economics present unique challenges that differentiate the sector from other base and precious metals. Approximately 70% of global silver production comes as a byproduct of base metal mining (primarily zinc, lead, and copper operations), meaning that silver supply responds primarily to base metal prices rather than silver prices themselves. This byproduct structure creates persistent lags between price signals and production adjustments.
Primary silver mines, which account for the remaining 30% of supply, face operational challenges across key producing jurisdictions. Mexico (historically the world's largest silver producer) confronts permitting delays, community opposition, and regulatory uncertainty that constrains expansion, while Peru battles declining ore grades at mature operations and infrastructure limitations that increase capital intensity for new developments.
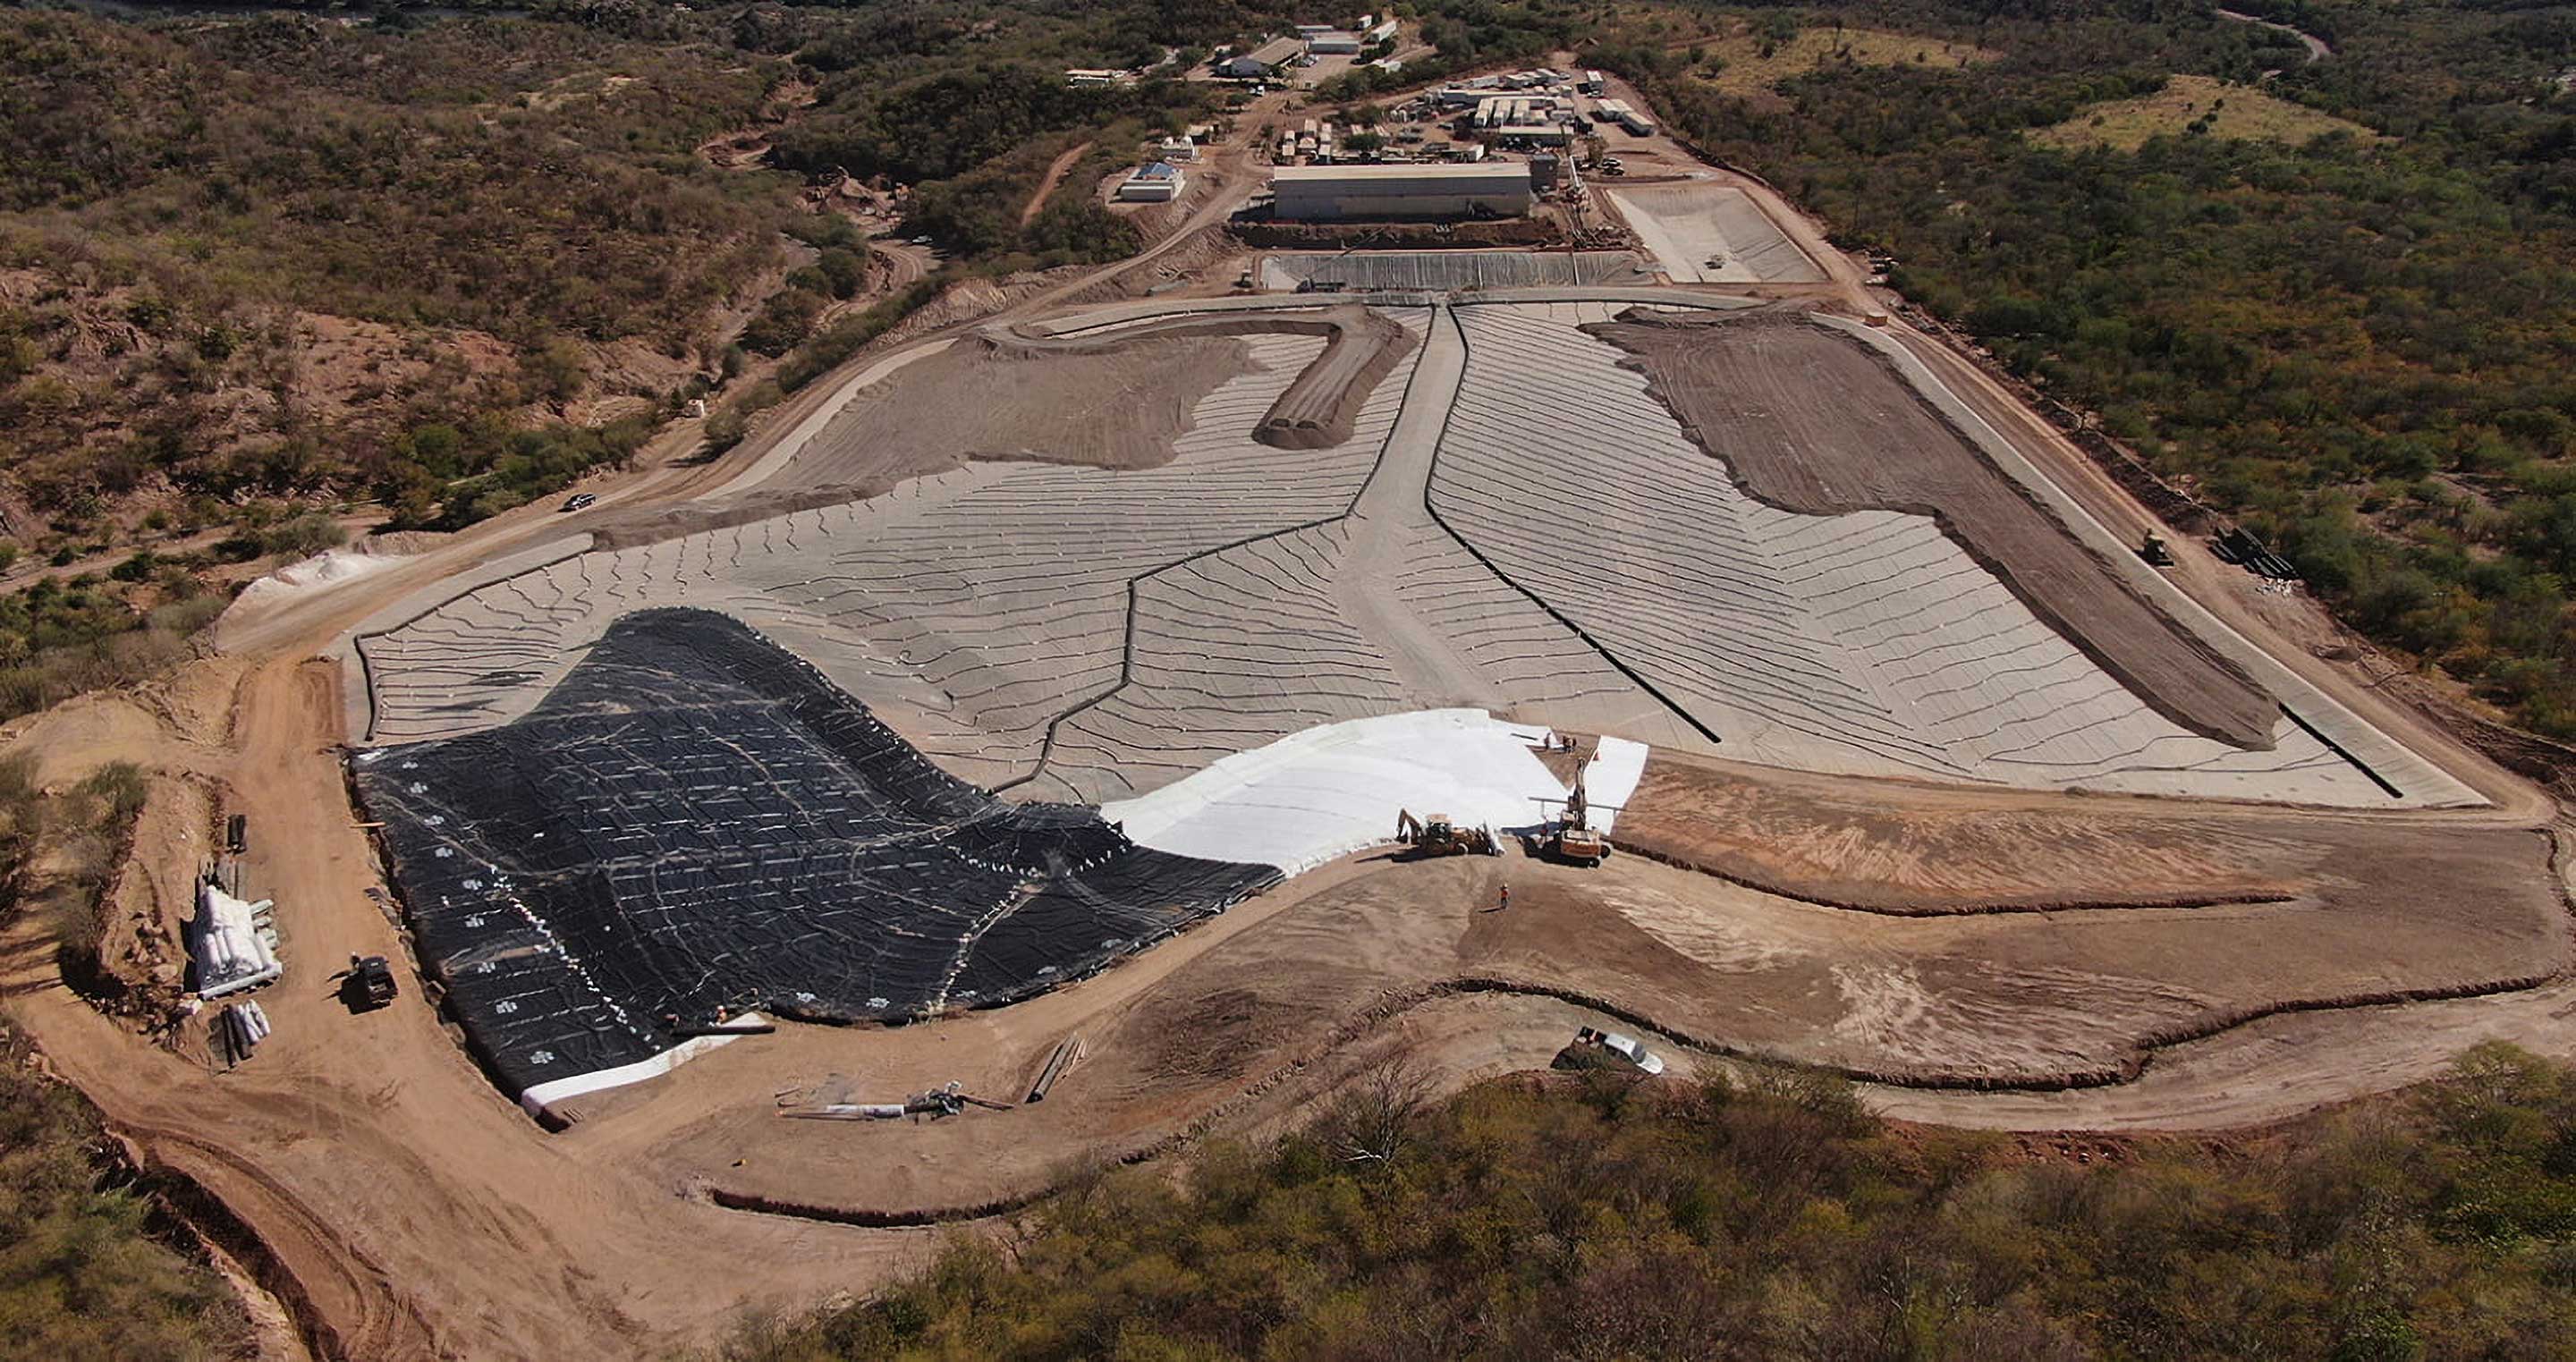
The capital intensity of traditional underground silver mining creates significant barriers to rapid supply responses. Developing a new primary silver mine from discovery through to production typically requires 10-15 years and hundreds of millions in capital investment. This extended timeline means that even with silver prices above $50 per ounce (levels that make most projects economically attractive), new supply cannot materialize quickly enough to address current deficits.
Investment Implications: Positioning for the Next Phase
Silver mining economics present unique challenges that differentiate the sector from other base and precious metals. Approximately 70-80% of global silver production comes as a byproduct of base metal mining (primarily lead/zinc, copper, and gold operations), with only 20-30% from primary silver mines, meaning that silver supply responds primarily to base metal prices rather than silver prices themselves. This byproduct structure creates persistent lags between price signals and production adjustments.
Primary silver mines, which account for the remaining 20-30% of supply, face operational challenges across key producing jurisdictions. Mexico (the world's largest silver producer for 16+ consecutive years, producing 186.0 million ounces in 2024) confronts permitting delays, community opposition, and regulatory uncertainty that constrains expansion, while Peru battles declining ore grades at mature operations and infrastructure limitations that increase capital intensity for new developments.
The capital intensity of traditional underground silver mining creates significant barriers to rapid supply responses. Developing a new primary silver mine from discovery through to production typically requires 15-18 years (with S&P Global citing a 15.7-year average) and $500-$600+ million in initial capital investment for major projects. This extended timeline means that even with silver prices well above the industry average all-in sustaining cost of approximately $27 per ounce (levels that make most projects economically attractive, with prices above $50 per ounce making even marginal deposits highly profitable), new supply cannot materialize quickly enough to address current deficits.
Company Case Studies: Vizsla Silver's Near-Term Producer with Exceptional Economics
Vizsla Silver represents the most advanced development opportunity among silver-focused juniors, having completed a feasibility study in November 2025 that demonstrates exceptional project economics. The Panuco project targets first production in H2 2027, with compelling financial metrics: a US$1.802 billion net present value at 5% discount rate, 111% internal rate of return, and a seven-month payback period. Life-of-mine average annual production totals 17.4 million ounces silver equivalent per year over 9.4 years (163.4 million ounces AgEq total), with production averaging 20.1 million ounces annually during the initial five years. All-in sustaining costs of $10.61 per ounce position Panuco among the lowest-cost primary silver operations globally.
CEO Michael Konnert mentioned their high-grade silver project:
“The Feasibility Study confirms Panuco as a highly profitable, high-grade silver project with a post-tax NPV of US$1.8 billion, a 111% IRR, and a seven-month payback, supported by a strong cash position and US$240 million in net proceeds from the capped-call convertible bond issue.”
Vizsla has secured US$500 million in committed funding: US$200 million in cash from a June 2025 equity financing (US$100 million bought-deal plus US$15 million over-allotment) and US$300 million from convertible senior notes closed November 24, 2025 (5.00% notes due 2031). The company holds an additional US$220 million senior secured project finance mandate with Macquarie Bank as lead arranger, expected to close in Q1 2026 following completion of permitting and construction decision, providing total financing capacity approaching US$720 million sufficient to fund the project's US$238.7 million pre-production capital requirements with substantial flexibility for district-scale exploration.
Beyond the feasibility-defined resource, Vizsla controls an expansive land package with significant exploration upside. 30% of identified vein targets have been drilled, with approximately 67% of the property mapped comprehensively, leaving substantial greenfield potential. Recent high-grade discoveries at Animas (653 g/t silver, 4.26 g/t gold intersections in March 2025) demonstrate district-wide mineralization potential beyond the current resource base. The company's current market capitalization of approximately US$1.72-1.78 billion (as of early December 2025) implies a 0.96-0.99× price-to-NAV multiple using feasibility study economics, appearing conservative considering full committed funding of US$500 million, advanced permitting status (environmental permits expected H1 2026), and near-term construction decision catalysts targeted for mid-2026.
GR Silver Mining: Fully Funded Resource Growth Story
GR Silver Mining operates in Mexico's prolific Sinaloa silver belt, controlling assets with 134 million ounces silver equivalent in current NI 43-101 resources (85 million oz AgEq indicated, 49 million oz AgEq inferred). The company's investment thesis centers on aggressive resource expansion through step-out drilling, with 80% of the primary San Marcial geophysical anomaly remaining untested.
Following a C$13 million bought-deal financing closed in December 2025, the company's cash position increased to approximately C$28.8 million, enabling a planned 15,000-meter step-out drilling program at San Marcial in H1 2026 and advancing bulk sample test mining at the permitted Plomosas underground mine.
According to CEO Mario Fonseca stated their resource-growth:
“As a company, we are fully funded with C$28.8 million to execute our resource-growth drilling program, supported by a robust geological model that has consistently delivered new silver discoveries.”
The geological model supporting GR Silver's expansion strategy has delivered consistent discovery success. Multiple drilling campaigns in 2025 intersected wide, high-grade silver zones beyond current resource boundaries, including 75 meters grading 260 g/t silver (293 g/t AgEq with base metal credits). Historical drilling campaigns have returned significant results including 83.5 meters at 215 g/t silver and 101.6 meters at 308 g/t silver. These results validate the company's conceptual model of an upper portion of a large epithermal system with multiple sub-parallel silver zones.
Americas Gold & Silver: Established Production & Strategic Consolidation
Americas Gold & Silver represents a transformed company following recent strategic acquisitions and operational improvements. The November 2025 announced acquisition (closed December 4) of the Crescent Mine complements the existing Galena Complex, creating a consolidated Idaho silver district with potential for approximately 6.5 million ounces annual production from the combined system (Galena target: over 5 million oz/year + Crescent: 1.4-1.6 million oz/year). The Galena Complex ranks among the highest-grade active silver mines globally, with recent intercepts including 3.4 meters grading 983 g/t silver in the new 034 vein and an exceptional 0.21 meters at 24,913 g/t silver with 16.9% copper in the 149 vein.
Chairman and CEO Paul Andre Huet leads a turnaround-focused management team with demonstrated success at Klondex and Karora Resources. Since assuming leadership, the team secured approximately US$270 million in equity and debt financing (C$50M October 2024, US$100M term loan June 2025, US$132.25M concurrent financing December 2025), completed major infrastructure upgrades including No. 3 Shaft skipping capacity doubling to 80 tonnes per hour, and introduced long-hole stoping methods that improve both grades and tonnage.
Paul Andre Huet, Chairman & CEO stated their production growth:
"We have transformed the Galena Complex into a fully consolidated, well-capitalized operation that is now positioned to unlock significant silver and antimony production growth."
Silver concentration defines the company's investment profile, generating over 85% of revenue from silver in Q2-Q3 2025 (second-highest among global peers), providing direct leverage to silver price movements with minimal exposure to base metal price volatility.
Strategic positioning extends beyond silver production to include antimony, a critical mineral facing supply constraints. Galena operates as the largest active antimony mine in the United States, producing 447,466 pounds in the first three quarters of 2025 with breakthrough processing improvements achieving over 99% recovery rates (99.8% in September 2025 testing). The company's current valuation of 0.76× net asset value per share trades at a 14% discount to peer averages (0.88x) despite recent operational improvements and district consolidation, offering investors prioritizing current production immediate exposure to silver prices with exploration upside from continued district drilling.
Cerro de Pasco Resources: Innovative Tailings Reprocessing Model
Cerro de Pasco Resources employs a fundamentally different business model focused on reprocessing historic tailings and stockpiles rather than traditional mining. This approach targets the Quiulacocha tailings facility and Excelsior stockpile in Peru, containing an estimated 423 million ounces silver equivalent based on historic estimates. Recent drilling programs confirmed substantial metal grades across the 75-million-tonne Quiulacocha deposit, with results from 40 drillholes averaging 1.66 oz/t silver, 1.47% zinc, 0.89% lead, 0.09% copper, plus gallium averaging 53.2 g/t and indium at 19.9 g/t, critical metals for semiconductors and 5G technology.
The economic advantage of tailings reprocessing versus traditional mining proves compelling. Extraction costs range from $1-2 per tonne compared to $2-15 per tonne for open pit operations and $30-200 per tonne for underground mining, with dilution remaining minimal at 0-5% versus 10-30% for open pits and 20-50% for underground operations. Environmental remediation provides additional value beyond metal extraction, as the Quiulacocha facility generates acid drainage impacting local water quality, and this circular economy approach aligns with regulatory priorities and community interests.
CEO Guy Goulet stated their current works:
"Our work at Quiulacocha confirms that we are unlocking one of the world's largest above-ground metal resources. With historic tailings already mined and averaging 5.5 ounces per tonne silver equivalent, we can extract metals at a fraction of traditional mining costs while simultaneously delivering environmental remediation for the community."
Internal conceptual studies project base-case life-of-mine profit of US$2.9 billion assuming $49/t net smelter return after recoveries and treatment charges, with upside scenarios reaching US$6.3 billion at higher metal prices. The company's market capitalization of approximately $270 million (as of September 2025) reflects early-stage valuation appropriate for pre-development assets, with major shareholder Eric Sprott holding 16.3% equity position (21.8% fully diluted). For investors seeking exposure to innovative extraction technologies and large resource bases at exploratory valuations, Cerro de Pasco offers unique positioning in the silver mining space.
The Investment Thesis For Silver Mining Equities
- Allocate 40-50% of silver mining exposure to companies with completed feasibility studies, secured financing, and near-term production timelines like Vizsla Silver (2027 first production, fully funded development, exceptional project economics).
- Allocate 20-30% to fully funded exploration companies advancing district-scale targets like GR Silver Mining (only 20% of geophysical anomalies tested, aggressive 15,000-meter drilling programs planned).
- Maintain 20-30% allocation to established producers generating current cash flows like Americas Gold & Silver (immediate silver price leverage through 85%+ revenue concentration, exploration upside from district consolidation).
- Allocate 5-10% to companies employing novel approaches like Cerro de Pasco Resources (tailings reprocessing with large resource base, minimal capital intensity, environmental remediation benefits).
- Implement disciplined position sizing accounting for volatility around the $60/oz resistance level, using defined support levels ($54-55/oz) for stop-loss placement while maintaining 20-30% cash reserves for opportunistic additions during corrections.
- Position ahead of key catalysts like Vizsla's Q2 2026 construction decision and GR Silver's H2 2026 resource update, where development-stage companies historically experience significant NAV multiple expansion during developer-to-producer transitions.
Silver markets stand at a critical inflection point where structural supply deficits intersect with accelerating industrial demand and favorable technical positioning. The 184.3 million ounce deficit recorded in 2023 (which decreased to 148.9 million ounces in 2024, though still marking the fifth consecutive year of structural deficits) reflects fundamental tightness that mining supply cannot quickly address. Solar photovoltaic demand has nearly quadrupled from 59.6 million ounces in 2015 to 232 million ounces in 2024 and continues accelerating as renewable energy commitments intensify globally.
For investors seeking exposure to this structural bull market, silver mining equities offer leveraged returns through operational gearing to spot prices. Current valuations remain attractive, with development-stage companies trading at substantial discounts to net asset values despite robust feasibility economics. The sector presents multiple entry points across risk profiles: near-term producers with secured financing (Vizsla Silver with 2027 first production and US$1.802 billion NPV), resource growth opportunities (GR Silver with only 20% of targets tested), immediate production exposure (Americas Gold & Silver with 85%+ silver revenue), and speculative optionality (Cerro de Pasco with 423 million ounce silver equivalent tailings resource).
Technical analysis identifies $60 per ounce as a critical resistance threshold where sustained breakouts could catalyze momentum-driven rallies, while support near $54-55/oz provides downside buffers for disciplined accumulation. Portfolio construction should emphasize diversification across development stages, geographic jurisdictions, and operational risk profiles. As the sector progresses through key catalysts (construction decisions, resource updates, first production milestones), selective positioning in quality operators could generate substantial returns for investors willing to accept development-stage risks inherent in junior mining equities.
TL;DR
Silver markets face structural deficits for the fifth consecutive year (148.9 Moz in 2024, down from 184.3 Moz in 2023) driven by solar panel demand that nearly quadrupled since 2015 (59.6M oz to 232M oz, up 289%). Prices recently tested the critical $60/oz psychological threshold, up approximately 235% since 2016 (from $17.14 average to current $57-58 range). Four companies (Vizsla Silver with 162 Moz AgEq production target and US$1.802B NPV, GR Silver with 134 Moz resources and full funding, Americas Gold & Silver as top-tier U.S. producer, and Cerro de Pasco Resources with 423 Moz tailings opportunity) offer leveraged exposure to silver's structural bull market through development-stage assets, high-grade discoveries, and low-cost extraction strategies.
FAQs (AI-Generated)
The 184 million ounce annual deficit stems primarily from solar photovoltaic demand (which quadrupled since 2015, requiring 100,000 ounces per gigawatt) combined with electronics and semiconductor manufacturing growth that outpaces constrained mine supply.
Mining equities provide 2-3× operational leverage to silver prices above cash costs, plus exploration upside and acquisition premium potential, with developer-to-producer transitions historically generating 127% average NAV multiple expansion.
The $60 threshold represents a critical psychological level where sustained breakouts could trigger momentum-driven rallies from technical traders and systematic funds, while failure could prompt corrections toward $54-55/oz support zones.
Evaluation criteria vary by stage: exploration companies require assessment of geological potential and drilling success rates, development companies need feasibility study economics and financing analysis, while producers demand scrutiny of production costs (AISC) and operational reliability.
Primary risks include silver price volatility, development-stage execution challenges (permitting delays, cost overruns), jurisdictional risks in Mexico and Peru, currency fluctuations, and potential base metal price weakness affecting byproduct silver supply economics.
Analyst's Notes


Subscribe to Our Channel


%20(1).jpg)

Stay Informed


