




Silver's Sixth Straight Supply Deficit Widens: Structural Shortfall or Fed-Driven Pause?



Silver's 46.3M-ounce supply deficit supports higher long-term prices, but 83% September rate-hike odds and the Fed's next inflation data cap near-term gains.
- Spot silver rose 2.14% to $59.22/oz on July 27, recovering toward the $60 resistance level that capped its July 23 rally.
- The Silver Institute projects a sixth straight annual deficit of 46.3 million ounces for 2026, up from 40.3 million ounces in 2025, keeping the market in supply deficit.
- J.P. Morgan targets a 2026 average silver price of $81/oz, while Bank of America's bull case reaches $309/oz if supply shortages deepen further.
- Fed funds futures price an 83% probability of a September rate hike, up from 68% a week earlier, raising expected real yields and limiting upside for non-yielding silver.
- A close below $55 opens a retest of $50 and the November 2025 low of $48.64.
- The July 31 PCE report is the next key catalyst because it could shift Fed rate expectations and determine whether silver breaks above resistance or extends its decline.
US-Iran Strike Pause Lowers Oil Prices & Silver Rebounds Toward $60: Can the Recovery Hold?
Spot silver rose 2.14%, or $1.24, to $59.22/oz on July 27, recovering from an eight-month low as lower oil prices reduced inflation concerns after the US suspended its two-week strike campaign against Iran. Iran said it had ended retaliatory strikes and opened Hormuz talks with Oman, reducing the war-risk premium in oil and weakening support for inflation-sensitive precious metals.
Silver had fallen more than 3% to $57.62/oz on July 23 as the 10-year Treasury yield climbed to 4.703%, its highest close since early 2025, before rebounding 1% to nearly $58 on July 24.
Byproduct Mine Economics & Lower Output Limit Silver Supply: Why Higher Prices May Not Lift Production
About 70% of global silver output is a byproduct of copper, zinc, and lead mining, so higher silver prices do not quickly increase supply because production depends on the economics of the host metal. Fresnillo reported second-quarter attributable silver output of 10.9 million ounces, down 1.7% quarter over quarter and 12.6% year over year, because of lower ore grades and the phase-out of its Silverstream agreement. India tightened silver licensing rules in 2026, reducing metal available in the open market and pushing local premiums to multi-month highs.
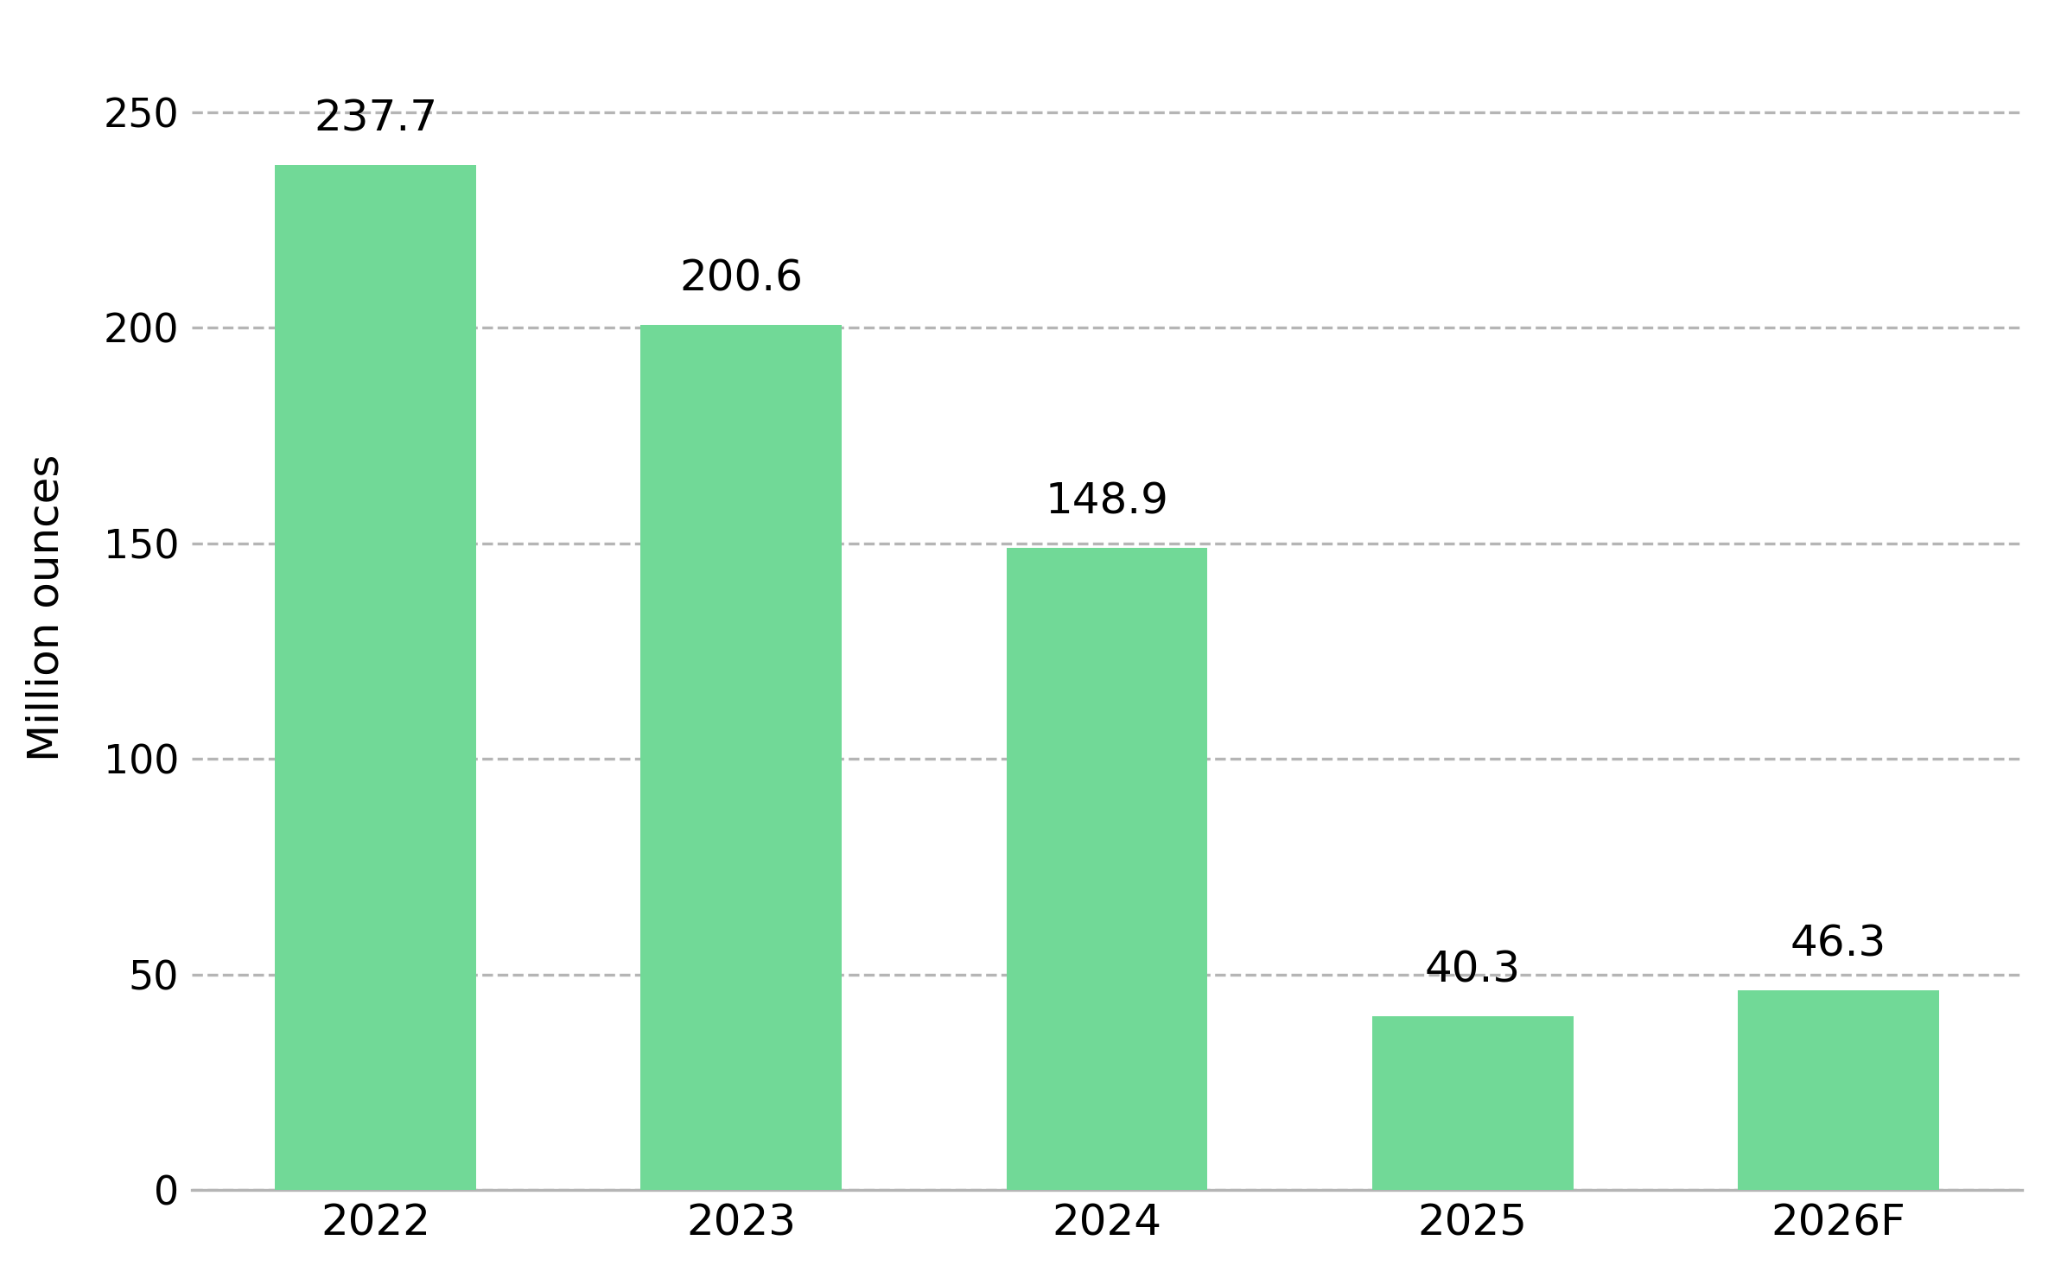
The Silver Institute's World Silver Survey projects annual silver deficits of 50 million to 80 million ounces through 2030, while cumulative inventory drawdowns since 2021 have reached an estimated 762 million ounces, leaving less above-ground supply to absorb future demand.
Slow Mine Supply & Ongoing Demand Support Higher Silver Targets: What Confirms the $81 Base Case?
Silver supply responds slowly because most production comes from mines driven by copper, zinc, and lead economics rather than silver prices. Nitesh Shah of WisdomTree says silver's roughly 50% decline from its January 2026 high of $121.78 has reduced speculative buying without closing the supply deficit. He expects demand from electrification, AI infrastructure, and data centers to keep the market in deficit and targets $70/oz by the second quarter of 2027.
Base case: the Fed keeps rates unchanged on July 29, the 2026 silver deficit remains at 46.3 million ounces through year end, and silver moves toward J.P. Morgan's $81/oz 2026 average target.
Bull case: supply shortages deepen beyond the current deficit, lifting silver toward Bank of America's $309/oz bull-case target by the end of 2026.
Solar Thrifting & Rising Physical Demand Keep Silver in Deficit: Why Supply Still Lags
Solar manufacturers are reducing silver use because silver paste accounts for 10% to 20% of solar cell costs. LONGi began mass-producing copper-based contacts in Q2 2026, cutting silver use per cell by a record 19% this year. Even so, industrial demand is projected to reach a record 720 million ounces in 2026 because copper is not expected to broadly replace silver in solar cells until around 2030. Higher silver prices alone are unlikely to increase mine supply.
Fresnillo kept full-year production guidance at 42.0 million to 46.5 million ounces despite lower second-quarter output, showing that byproduct mine economics, not silver prices, limit near-term supply growth. The July 29 Fed decision and July 31 PCE report could shift rate expectations and drive near-term price volatility after silver traded between an eight-month low and a weekly high of $60.94 within one week. Meanwhile, bar and coin demand is projected to rise 18% in 2026 as buyers continue accumulating silver despite the supply deficit.
83% September Rate-Hike Odds Limit Silver Above $60 & A $55 Close Triggers a Retest of $50
Silver is likely to remain in its roughly $55 to $60 range while Fed funds futures price an 83% probability of a September rate hike, up from 68% a week earlier, because higher expected real yields reduce demand for non-yielding assets. That rate outlook is likely to keep silver within its current trading range.
A close below $55 opens a retest of $50, followed by the November 2025 low of $48.64. A sustained recovery requires silver to reclaim $60.94, $63.38, and $64.00 before testing its 50-day moving average at $65.79. The next key catalysts are the Fed's July 29 decision, Q2 GDP on July 30, and the July 31 PCE price index. A stronger-than-expected inflation reading would support current rate hike expectations and keep silver below $60, while a softer reading could weaken rate hike expectations and allow the supply deficit to become the dominant price driver again.
Analyst's Notes





Subscribe to Our Channel







Stay Informed






