




46.3-Million-Ounce Silver Deficit Support Higher Valuations for Primary Producers


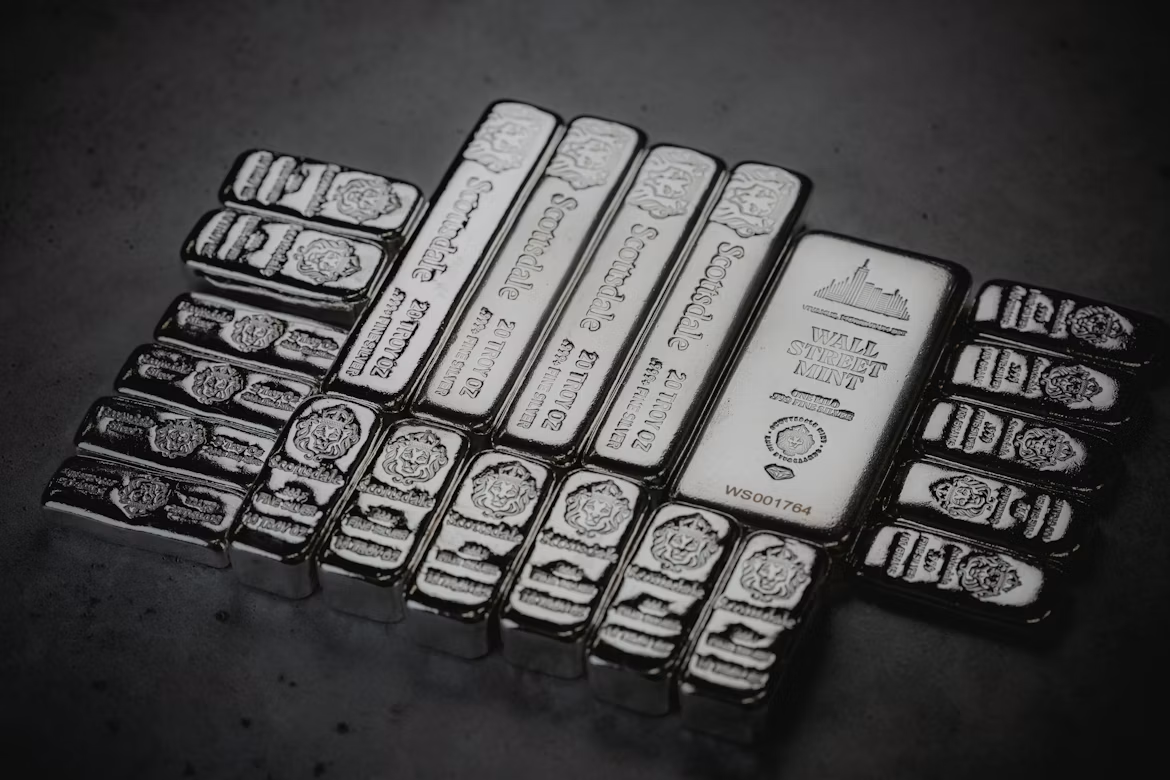
Silver's 46.3-million-ounce deficit persists despite weaker demand, supporting primary producers as supply constraints and policy shifts lift valuations.
- Silver traded near $60 per ounce on July 10, 2026, about 50% below its January 29 high of $121.64, as J.P. Morgan lowered its second-half 2026 silver price forecast to a range of $60 to $65 per ounce on July 8, 2026.
- Metals Focus projected solar photovoltaic silver demand to fall 19% in 2026 to about 151 million ounces in the World Silver Survey 2026, published on April 15, 2026, a reduction driven by lower silver loading per solar cell that prompted J.P. Morgan to lower its second-half 2026 silver price forecast.
- The 2026 silver market deficit widens to 46.3 million ounces from 40.3 million ounces in 2025 because roughly 70% of global silver supply comes as a byproduct of copper, lead, and zinc mining, limiting producers' ability to increase silver output in response to higher silver prices.
- The 2026 silver market deficit widens to 46.3 million ounces from 40.3 million ounces in 2025 because roughly 70% of global silver supply comes as a byproduct of copper, lead, and zinc mining, limiting producers' ability to increase silver output in response to higher silver prices.
- Downside is real, with a J.P. Morgan tail scenario at $50 per ounce, and single-jurisdiction security and permitting risk can delay the milestones that would close each equity discount.
Falling Solar Demand & Persistent Silver Deficits Support Long-Term Price Fundamentals
Silver's July repricing reflected weaker demand expectations rather than stronger mine supply. On July 8, 2026, J.P. Morgan lowered its second-half silver price forecast to $60-$65 per ounce from an earlier full-year average near $81, citing lower silver loading per solar cell and increasing adoption of copper-based and silver-free designs. The bank also outlined a $50-per-ounce tail scenario if speculative positioning unwinds before physical demand strengthens.
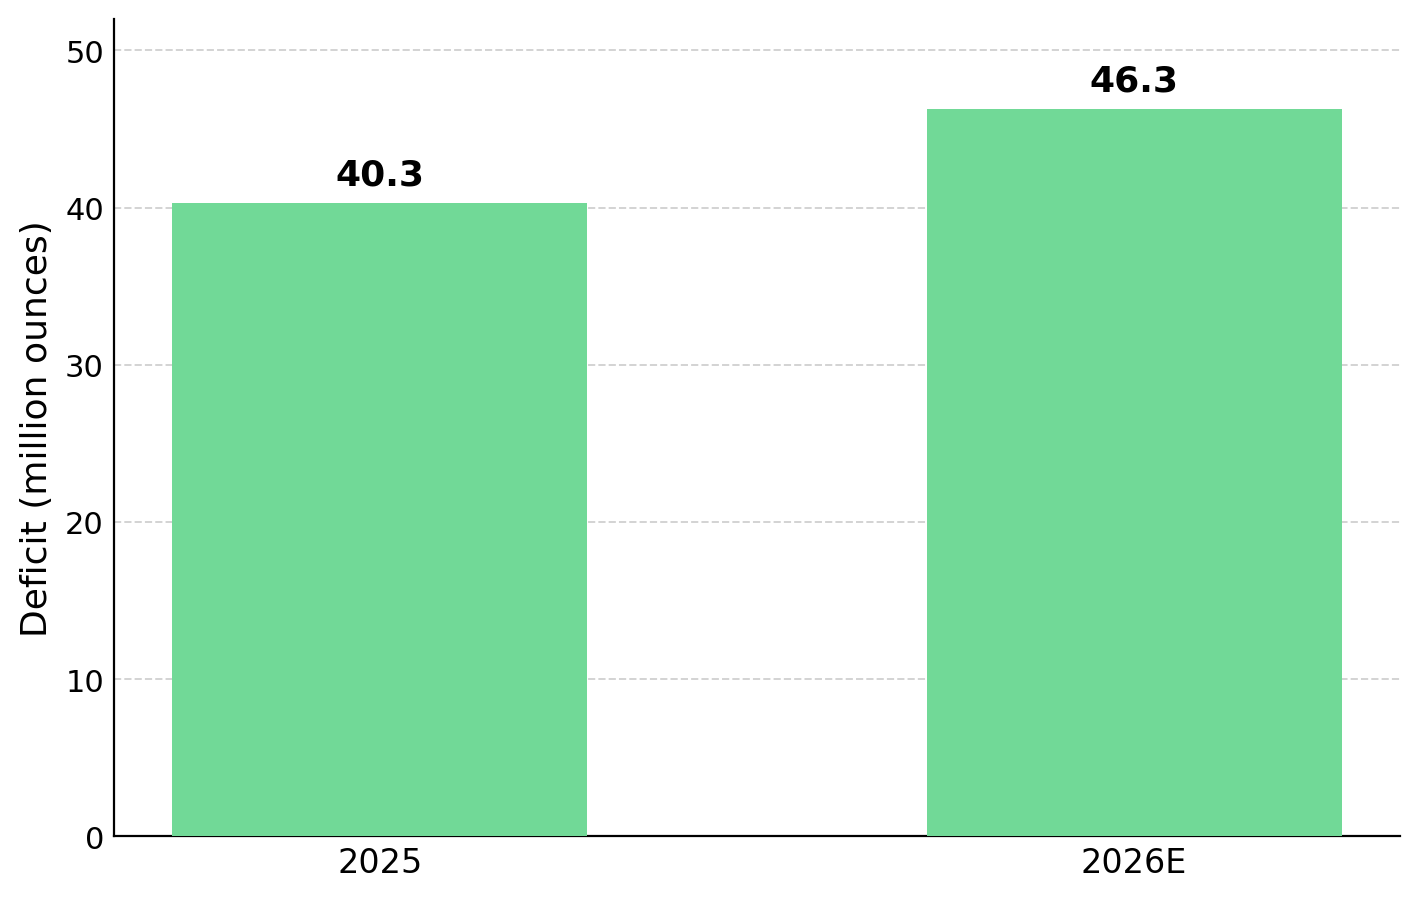
Metals Focus projects solar photovoltaic silver demand to fall 19% to about 151 million ounces in 2026 after a 6% decline in 2025, driven by thrifting as manufacturers reduce silver paste per cell. Total industrial fabrication is projected to fall to a four-year low of about 650 million ounces, yet the silver market is still expected to record a 46.3-million-ounce deficit because most supply comes as a byproduct of copper, lead, and zinc mining.
Byproduct Dependence & Constrained Mine Supply Increase the Premium for Primary Silver Producers
Lower silver demand did not eliminate the market deficit because supply depends on how silver is produced rather than how it is consumed. Global mine supply did not increase when silver prices tripled and is projected to decline slightly in 2026 even as the market deficit widens. That distinction favors primary silver producers, whose output responds directly to silver prices, over diversified miners that recover silver as a byproduct of copper, lead, and zinc production.
Byproduct Mining & Copper Constraints Prevent Higher Prices from Expanding Silver Supply
Global mine supply rose only 3% to 846.6 million ounces in 2025 even after silver reached $121.64, according to the World Silver Survey 2026. Mine output is projected to decline slightly to about 844.1 million ounces in 2026. Roughly 70% of global silver supply is recovered as a byproduct of copper, lead, and zinc mining, so production levels follow base-metal economics rather than silver prices. Primary silver mines, where silver is the main source of revenue rather than a byproduct, are the only operations that can meaningfully increase production in response to higher silver prices.
Silver supply does not respond quickly to higher prices because most production comes as a byproduct rather than from primary silver mines, making the constraint a function of mine economics rather than a forecasting assumption. Oliver Turner, Executive Vice President of Corporate Development at Americas Gold and Silver, explains why copper supply constraints limit silver production:
"70% of silver is a byproduct from other mines, a significant portion of that being copper mines, which are now constrained because of sulfuric acid supply due to the Strait of Hormuz. You can't just turn on more silver supply when the world needs it, which means the primary silver producers such as ourselves are producing an increasingly critical, now on the US critical minerals list."
How Producer-Nation Concentration & Jurisdiction Risk Favor Lower-Risk Silver Assets
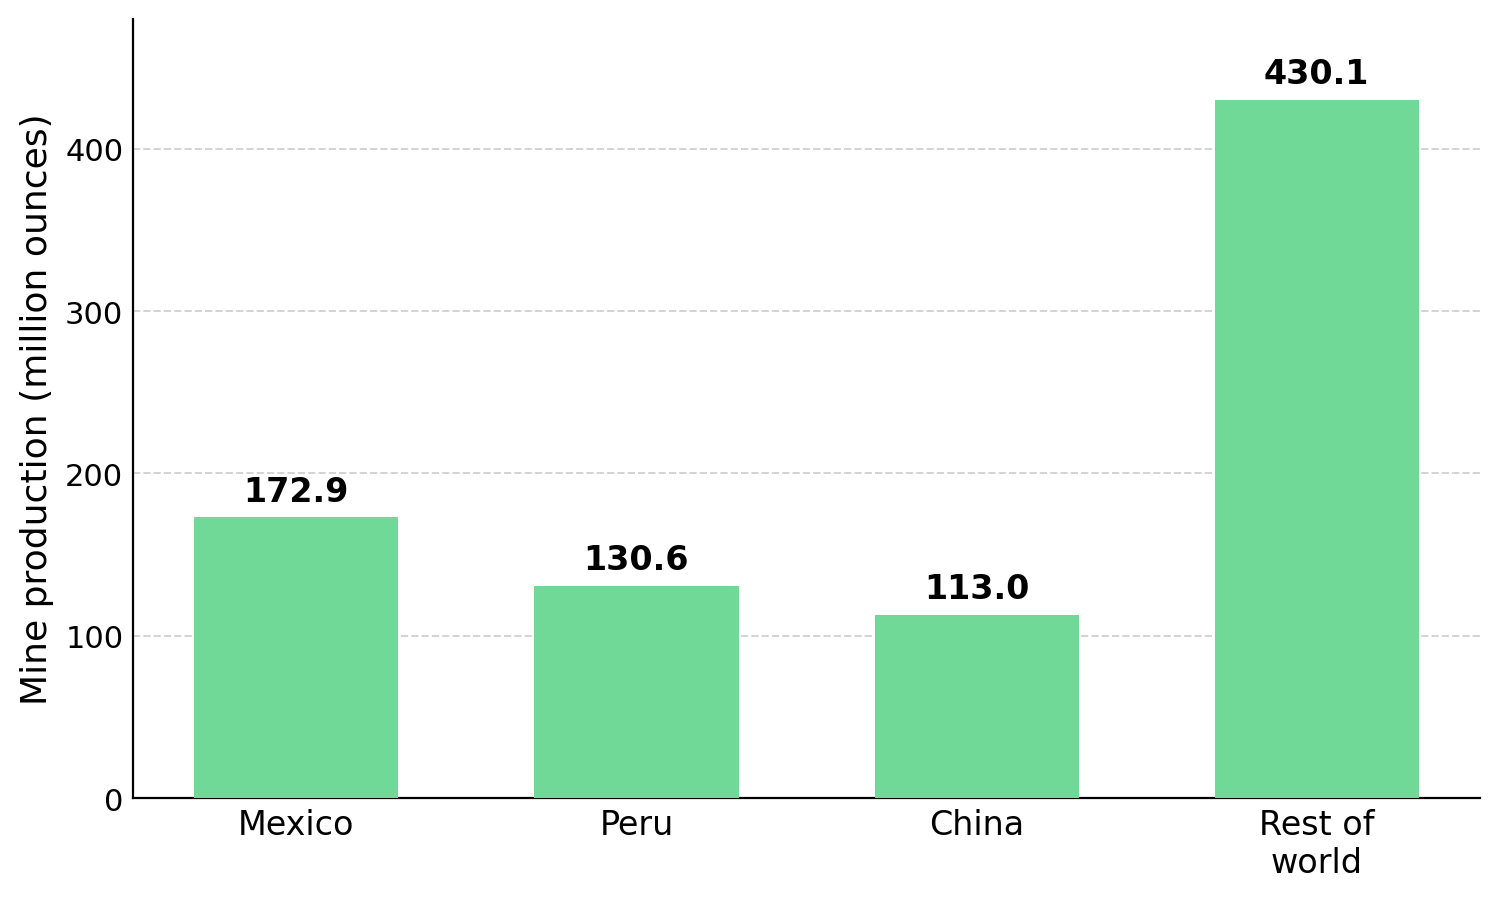
Half of global silver mine supply comes from Mexico, Peru, and China, concentrating supply risk in three jurisdictions. Mexico's output fell 5% to 172.9 million ounces in 2025, while Peru produced 130.6 million ounces and China 113 million ounces, according to the World Silver Survey 2026. Disruptions in any of these countries are difficult to replace because supply is highly concentrated.
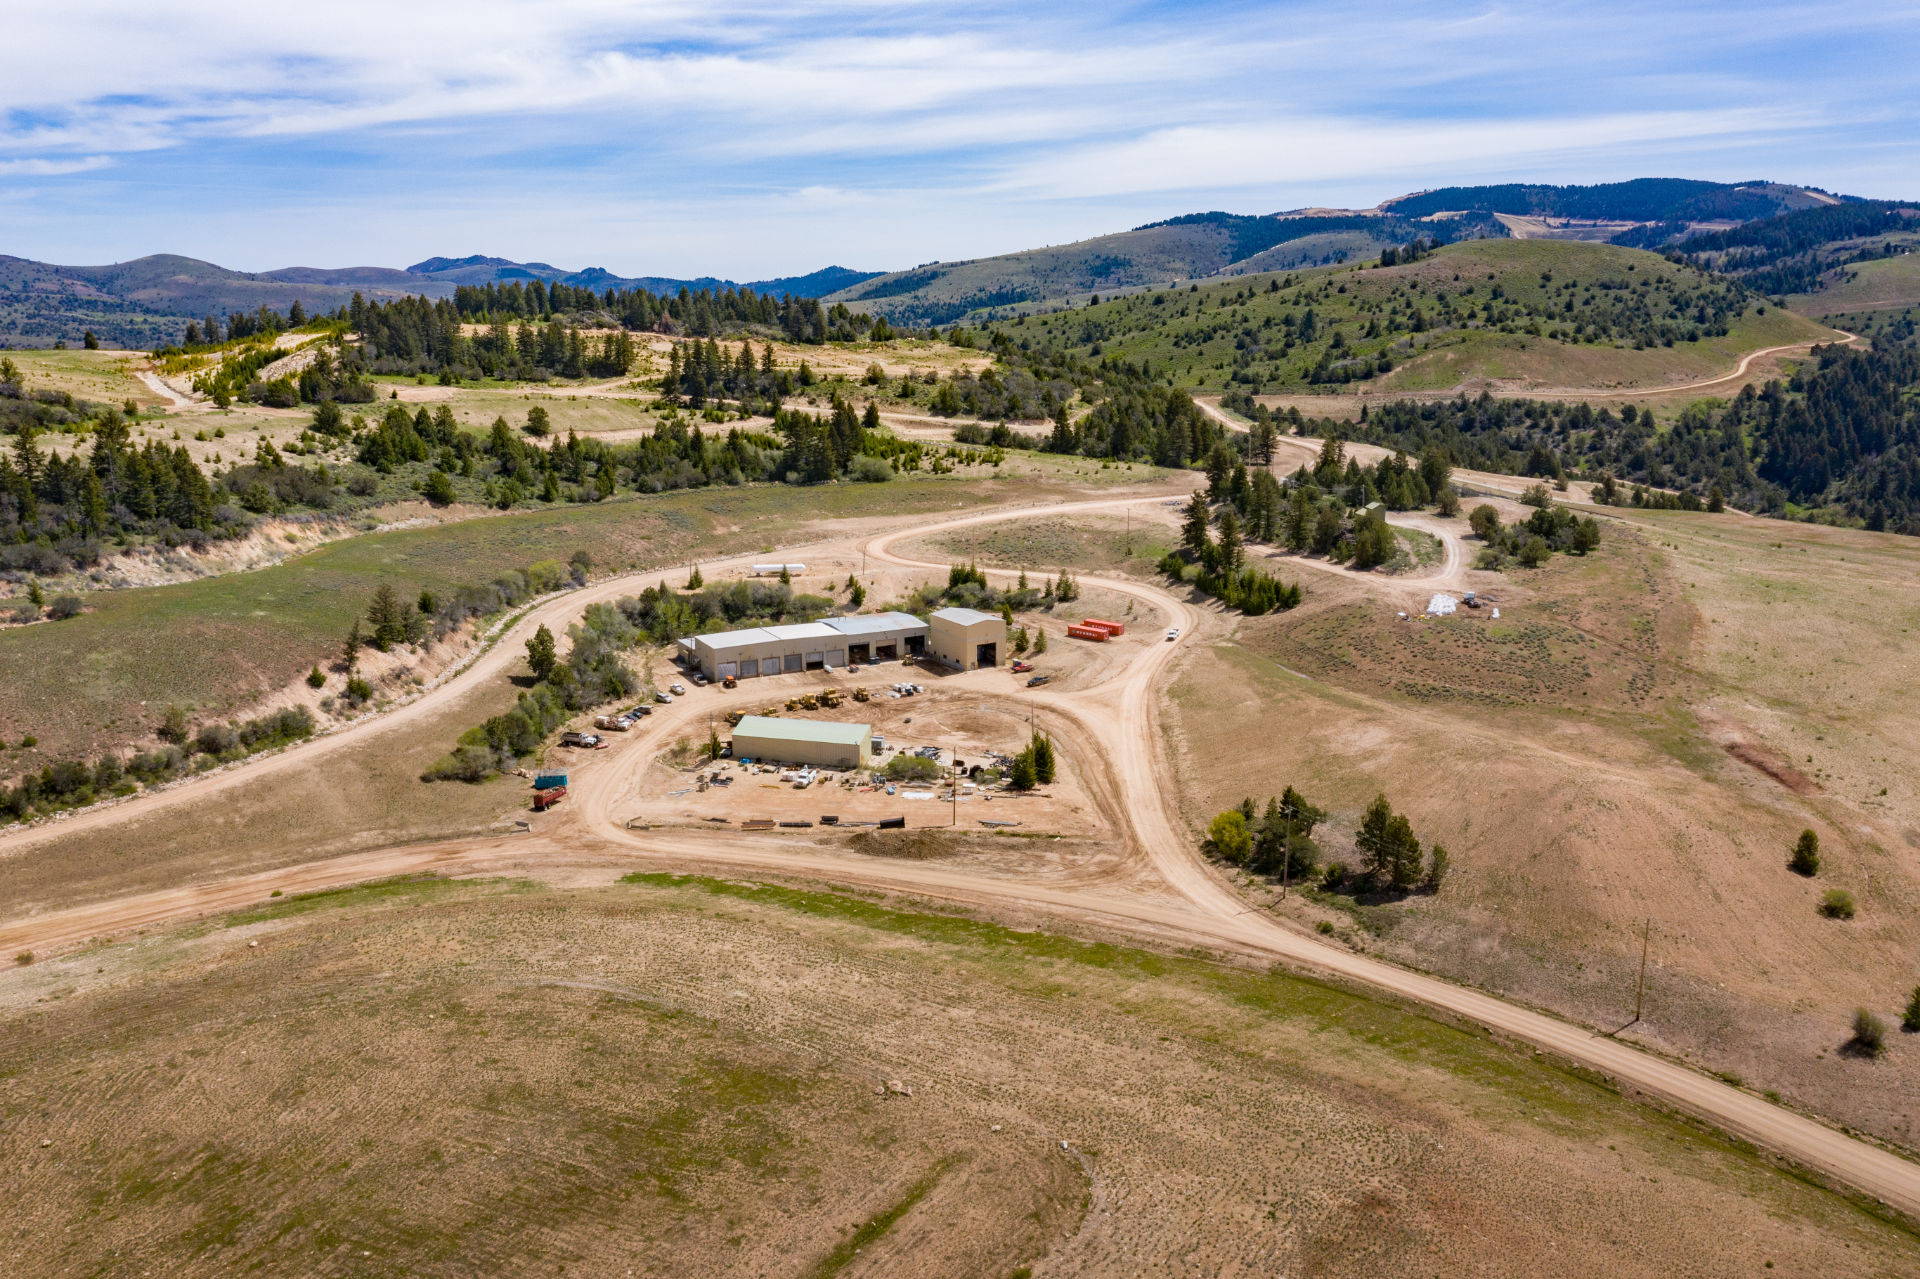
This concentration makes jurisdiction a valuation driver. Americas Gold and Silver's Galena Complex in Idaho sits outside these risks, while Vizsla Silver's Panuco project and GR Silver Mining's San Marcial and Plomosas concessions remain exposed to the jurisdictional and security risks affecting Mexican silver production.
GR Silver Mining reduced its operational security risk by relocating its logistical base to neighboring Durango, outside Sinaloa. Eric Zaunscherb, Executive Chair and Interim President and Chief Executive Officer of GR Silver Mining, explains how the relocation reduced operational risk:
"In terms of security, that's the top priority for us, the safety and security of our employees and contractors. The pivot to working out of Durango has been extremely important in reducing our risk profile."
Mineral Policies & Export Controls Favor Domestic Silver Producers
Government policy has made jurisdiction a larger valuation factor by treating silver as a strategic material. China introduced a silver export licensing regime on January 1, 2026, limiting exports to approved entities through 2027 and tightening physical supply outside China.
The US also strengthened support for domestic production by adding silver to its critical minerals list in November 2025 and launching a Section 232 review of processed critical minerals. The review, due July 13, 2026, could lead to tariffs or minimum import prices, supporting domestic producers.
Americas Gold and Silver also operates the largest active antimony mine in the US, producing about 561,000 pounds in 2025. As a US producer of two designated critical minerals, it is positioned to benefit from policies unavailable to producers operating solely in Mexico.
Price Correction & Compressed Equity Valuations Create Opportunities Across the Silver Value Chain
Silver's first-half decline from $121.64 compressed valuation multiples across producers, developers, and explorers, creating discounts that can be measured through cash flow, completed studies, and in-ground resources. Share prices reflected weaker short-term demand expectations even as the physical silver deficit widened, leaving producing assets, development projects, and exploration resources trading at different valuation discounts. The following companies illustrate how those valuation discounts differ across producers, developers, and explorers.
Discounted Valuations & Higher Throughput Improve Margins & Support Re-Rating
Americas Gold and Silver trades at about 0.60 times net asset value, compared with a peer average of about 1.06 times, according to Crux Investor coverage published on July 3, 2026. The company maintained 2026 production guidance of 3.2 to 3.6 million ounces despite a ventilation fire and a regional wildfire, while the Galena Complex contains more than 200 million ounces of silver grading about 500 grams per tonne.
Closing the valuation discount depends on increasing throughput. The operation is ramping from about 410 tonnes per day toward 650 tonnes per day by the end of 2026, spreading fixed costs across more ounces, lowering all-in sustaining costs, and increasing operating margins at any given silver price.
Completed Feasibility Studies & Exploration Upside Support Future Project Value
Vizsla Silver, an exploration and development company, published a Feasibility Study on Panuco in November 2025 showing an after-tax net present value of $1.8 billion at a 5% discount rate and an internal rate of return of 111%, based on price assumptions of $35.50 per ounce silver and $3,100 per ounce gold, with average annual output of 17.4 million ounces of silver equivalent over 9.4 years. Net present value expresses future cash flows in today's dollars, and internal rate of return is the annualized return that sets that value to zero. No production decision has been taken, and any construction decision depends on completed engineering, financing and permits.
The Feasibility Study excludes much of Panuco's exploration potential because large parts of the district have not yet been drilled. Jesus Beldor, Vice President of Exploration at Vizsla Silver, explains why additional drilling could expand the project's resource base beyond the current Feasibility Study:
"Within Panuco, which is 7,200 hectares approximately, we have over 150 vein targets that we have either mapped or discovered. We have been able to discover over 140 different vein prospects, of which we have drilled only approximately 30."
Absent Economic Studies & Development Milestones Create the Largest Valuation Discounts
GR Silver Mining holds a 134-million-ounce silver-equivalent resource reported under a 2023 National Instrument 43-101 technical report. On May 19, 2026, the company reported an intercept of 45.1 meters grading 1,623 grams per tonne silver, including 8.25 meters at 8,579 grams per tonne, highlighting the potential to expand higher-grade mineralization. The company trades at about $1.65 per in-situ silver-equivalent ounce, compared with a peer average of about $3.43, reflecting the absence of a formal economic study.
The company is targeting an updated mineral resource estimate in the second half of 2026 and a maiden preliminary economic assessment in the first half of 2027, milestones that would provide modeled cash flows and a basis to reassess the current valuation discount.
Trade Policy Catalysts & Persistent Silver Deficits Support the Long-Term Investment Case
Across producers, developers, and explorers, the key question is whether short-term price weakness or long-term supply constraints will have the greater influence on valuation. The recent decline reflects changing Fed rate expectations and speculative positioning, while the projected 46.3-million-ounce deficit persists because byproduct production, concentrated mine supply, and export controls limit supply growth despite weaker solar demand.
Two catalysts could determine whether silver equities rerate: the Section 232 review due July 13, 2026, which could support domestic producers through trade measures, and longer-term demand growth from electric vehicles, data centers, and grid infrastructure. Electric vehicles use about 25 to 50 grams of silver compared with 15 to 28 grams for internal combustion vehicles, supporting demand even as solar manufacturers reduce silver loading.
The Investment Thesis for Silver
- A projected 46.3-million-ounce silver deficit that widens even as industrial demand falls favors primary silver producers, whose output responds directly to silver prices, over diversified base-metal miners that recover most of the world's silver as a byproduct.
- China's export licensing regime and the US Section 232 review could increase the value of domestic production, favoring producers with assets and critical-mineral byproducts in allied jurisdictions.
- The first-half correction reduced mining equity valuations more than the long-term supply outlook, leaving producers trading near 0.60 times net asset value and explorers near half the peer average enterprise value per in-situ ounce.
- Developers with completed feasibility studies provide defined project economics before a construction decision, although financing and permitting remain key execution risks.
- Explorers trading below peers on enterprise value per in-situ ounce offer the largest valuation discounts but also the highest execution risk. Resource updates and initial economic studies provide the modeled cash flows needed to reassess those valuations.
- Higher-grade deposits can support lower unit operating costs and help protect margins if silver approaches J.P. Morgan's $50-per-ounce tail scenario.
- Balance sheet strength, including funded drill programs and undrawn credit facilities, improves the likelihood that developers and explorers can reach key milestones without raising additional equity.
A falling silver price and a widening physical deficit reflect different market drivers. Silver prices reflect Fed rate expectations and speculative positioning, both of which can change rapidly after new economic data. The projected 46.3-million-ounce deficit reflects a supply base that did not expand when silver prices tripled and is unlikely to expand quickly because most silver production depends on copper, lead, and zinc mining rather than silver prices. This supply constraint favors companies whose project economics are driven primarily by silver prices across the production, development, and exploration stages. Key catalysts include the July 13 Section 232 outcome and the resource updates and economic studies scheduled through the first half of 2027. These milestones will determine whether current valuation discounts begin to narrow or the investment case weakens.
TL;DR
Silver prices weakened as solar demand slowed and Fed expectations shifted, but the physical market remains constrained because about 70% of global silver production comes as a byproduct of copper, lead, and zinc mining, limiting supply growth. The resulting 46.3-million-ounce market deficit favors primary silver producers that can respond directly to higher prices. China’s export controls, US critical mineral policies, and the Section 232 review could further support domestic producers, while discounted valuations across producers, developers, and explorers create potential rerating opportunities as operational, resource, and permitting milestones are achieved.
FAQs (AI-Generated)
Analyst's Notes





Subscribe to Our Channel







Stay Informed






