How Fed's Hawkish Pivot & Gold's 14% Quarterly Drop Reward Self-Funded Producers


Fed rate uncertainty drove gold's record 14% quarterly decline, making financing strength and self-funded growth key producer advantages.
- The Fed's shift from expected rate cuts toward hikes helped drive gold's steepest quarterly decline on record of approximately 14%, even as physical demand and central bank buying remained strong.
- Wall Street's year-end gold forecasts differ by as much as $1,400 per ounce, reflecting uncertainty over the Fed's rate path rather than gold's underlying demand.
- Rising diesel, explosives, and royalty costs are increasing all-in sustaining costs, putting pressure on producer margins as gold price uncertainty persists.
- Debt-free, self-funded growth reduces reliance on external financing and strengthens resilience during periods of interest rate uncertainty.
- Non-dilutive financing and fully funded growth projects reduce reliance on equity markets when gold prices and the Fed's rate path remain uncertain.
Fed's Hawkish Pivot & Gold's Pricing Reset
Gold's relationship with US monetary policy shifted on June 17, when the Fed held its benchmark rate at 3.50% to 3.75% for a fourth consecutive meeting under new Chair Kevin Warsh. While the rate decision matched market expectations, the accompanying Summary of Economic Projections signaled a more hawkish policy outlook. Nine of nineteen Fed officials projected at least one rate hike before year end, six projected two, and Warsh declined to submit a dot of his own, indicating that future Fed guidance could move away from the rate-cut expectations markets had priced through most of 2025.
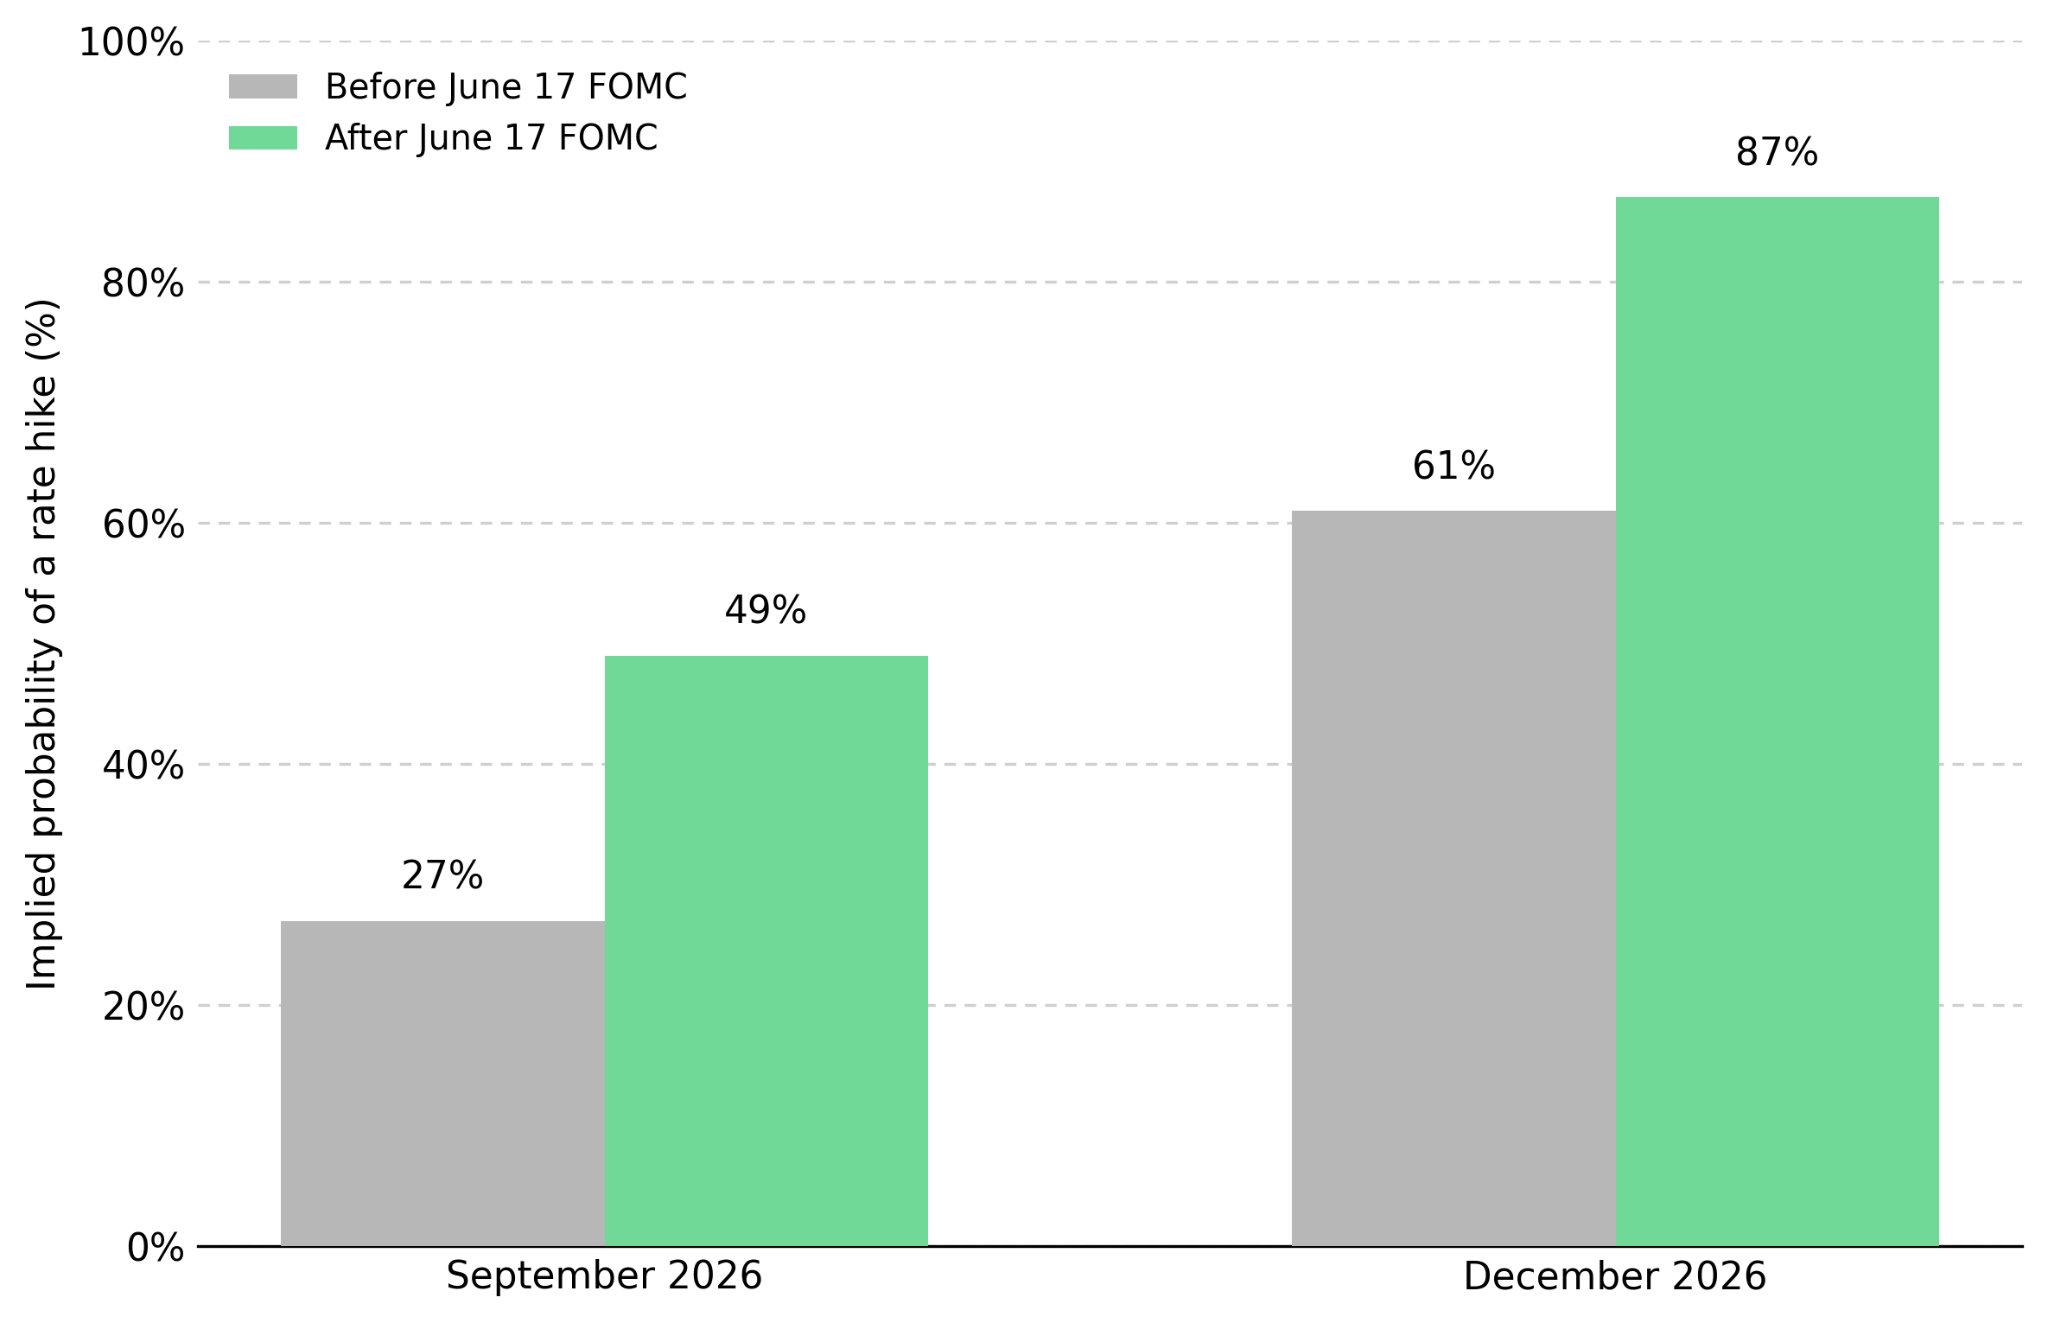
Markets repriced the Fed's policy outlook immediately after the meeting. CME FedWatch raised the implied probability of a December rate hike from 61% to 87% within 48 hours, while September hike odds increased from 27% to 49%. Two-year Treasury yields rose 16 basis points to 4.21%, their highest level in more than a year, while the US dollar index recorded its strongest single-day gain in 12 months. Gold fell more than 2% on the day of the meeting as markets adjusted to the Fed's revised rate outlook.
As a non-yielding asset, gold's opportunity cost rises with real interest rates. Goldman Sachs estimates that removing 50 basis points of expected Fed easing reduces gold price support by roughly $120 per ounce. The Fed's hawkish stance is also supported by elevated inflation data. May's Personal Consumption Expenditures (PCE) price index rose 4.1% year over year, the highest reading since April 2023, while core PCE climbed to 3.4%. With the 10-year real yield, measured through Treasury Inflation-Protected Securities (TIPS), near 2.19%, holding bullion has become more expensive than six months ago if the Fed maintains current rates or raises them.
Wall Street's Gold Forecast & Interest Rate Uncertainty
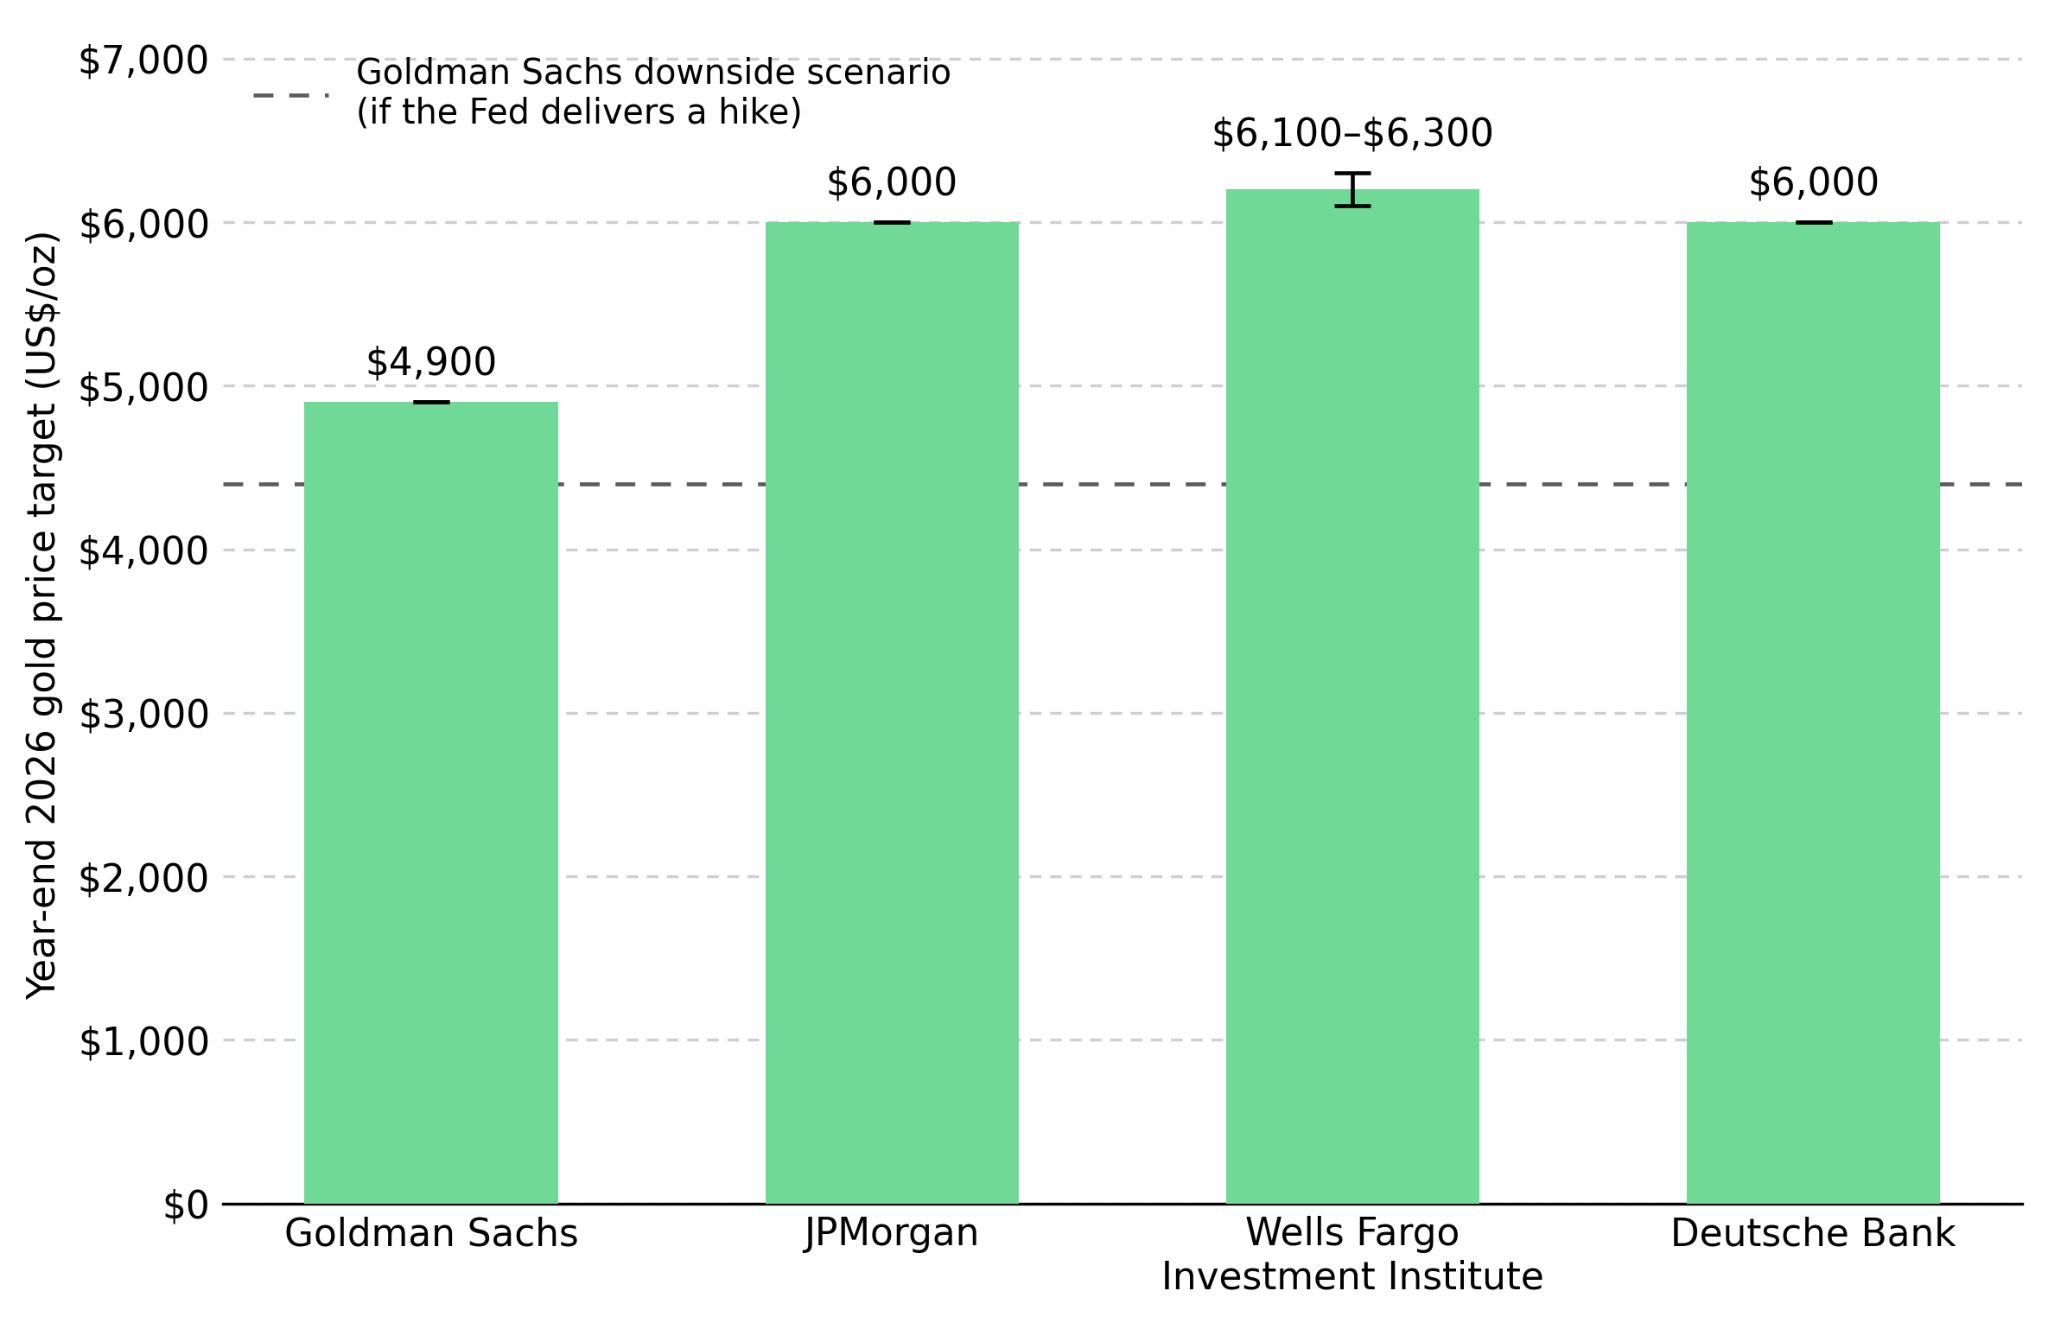
The wide gap between Tier 1 gold forecasts shows that markets remain divided over the Fed's rate path. Goldman Sachs cut its year-end gold price target from $5,400 to $4,900 on June 19, two days after the FOMC meeting, and identified $4,400 per ounce as its downside scenario if the Fed raises rates. J.P. Morgan maintained its $6,000 year-end target, while Wells Fargo Investment Institute kept its $6,100 to $6,300 range and Deutsche Bank remained at $6,000. The resulting spread between the most cautious and most optimistic forecasts now stands near $1,400 per ounce, despite institutions assessing much of the same macroeconomic data.
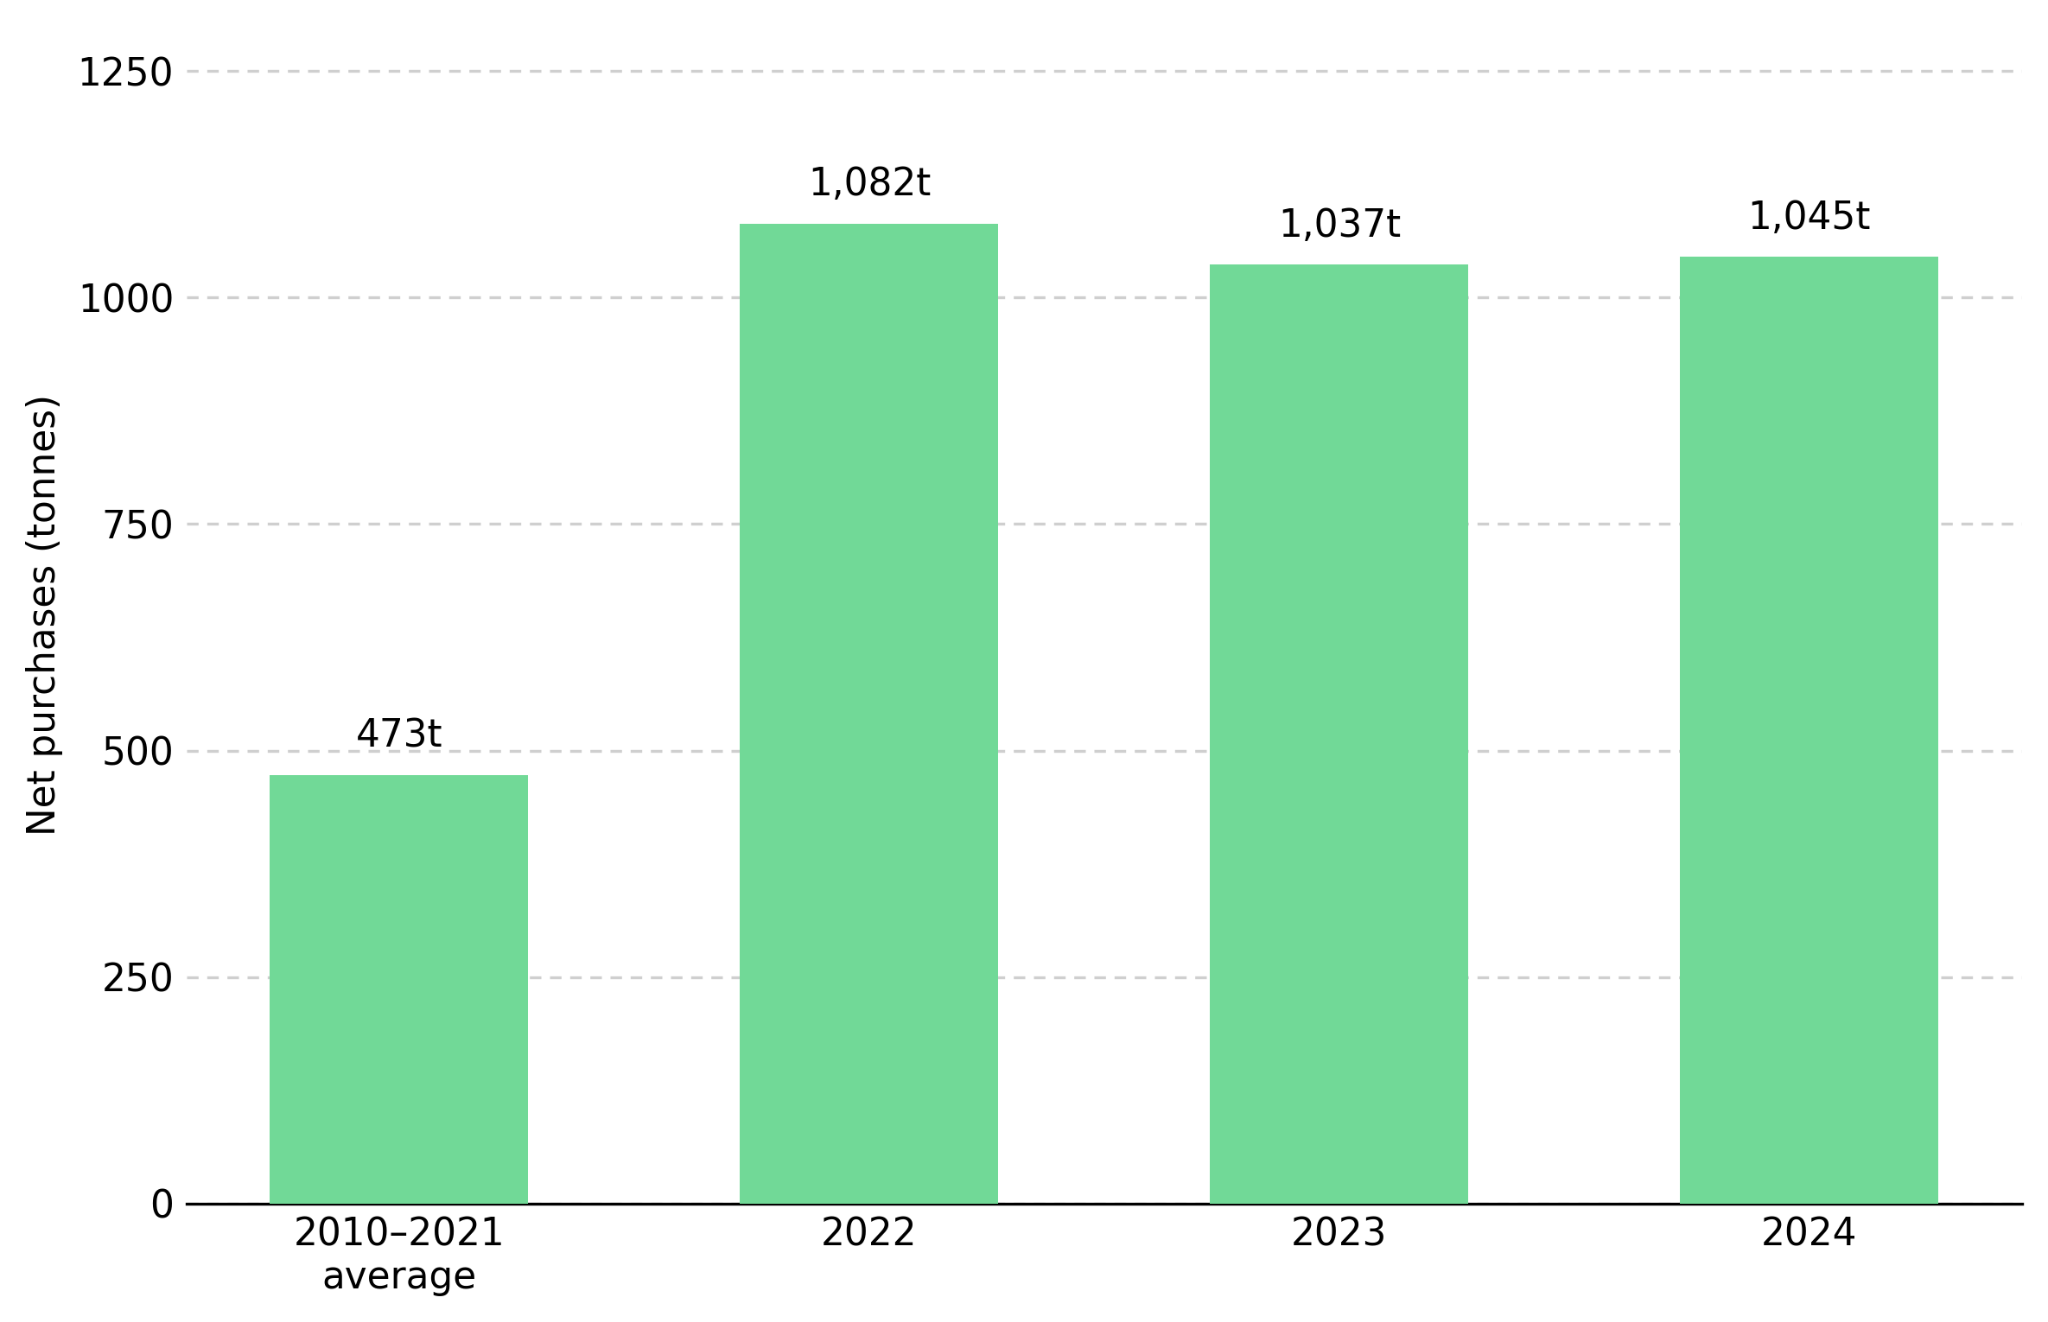
The forecasts differ because institutions assign different weights to interest rates and physical demand. Goldman Sachs places greater weight on real yields and exchange-traded fund (ETF) flows, which explains why its price target changed sharply after a single FOMC meeting. JPMorgan places greater weight on quarterly central bank purchases and investment demand, which the bank estimates explain roughly 70% of quarter-over-quarter gold price movements. By that measure, little has changed: central banks bought 244 tonnes of gold in the first quarter of 2026, well above the five-year average.
A $1,400 per ounce gap between Tier 1 forecasts shows that the main uncertainty is the Fed's rate path, not gold demand. When gold price forecasts vary widely, companies with strong balance sheets, disciplined cost control, and internally funded growth are better positioned than those relying on a higher gold price to meet their targets.
Rising Mining Costs & Producer Margin Resilience
Higher interest rate expectations are also affecting mining company economics, not just financial markets. Higher energy costs continue to increase diesel, explosives, and labor expenses across the mining sector, while higher interest rate expectations create uncertainty around future gold prices. Producers therefore face rising operating costs and less certain revenue at the same time. Together, these pressures directly affect asset net present value (NPV) and free cash flow, making capital discipline, cost control, and financing strategy more important when evaluating producers.
Higher Gold Prices Offset Rising Mining Costs
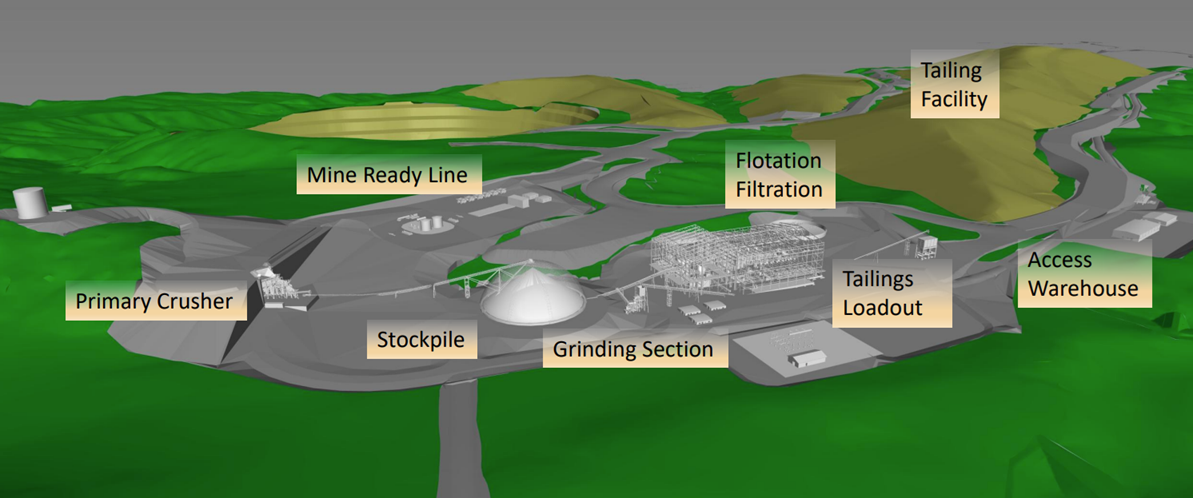
Integra Resources’ Florida Canyon Feasibility Study reported a 74% increase in proven and probable mineral reserves to 1.19 million ounces from 685,000 ounces and extended the mine life to 2033. The study also highlights the project's sensitivity to gold prices, estimating an after-tax NPV of $601 million using a declining base-case price deck, from $4,344 per ounce in 2026 to $3,600 per ounce between 2030 and 2035, compared with roughly $723 million under a flat $4,200 per ounce assumption. The more than $120 million difference reflects changes in gold price assumptions alone.
George Salamis, President and Chief Executive Officer of Integra Resources, explains how prevailing gold prices continue to support producer margins:
"We were expecting 2025 and 2026 to look like 70,000 to 75,000 ounces per year at a relatively high cost, but selling into prevailing gold prices, which is still very good, provides lots of margin."
Stronger Cash Flow Funds Growth Without New Debt
Serabi Gold achieved a debt-free balance sheet by early 2026 after generating approximately $30 million in cash during 2025 and funding all capital and exploration spending from operating cash flow. Higher grades at the Palito Complex increased plant feed to 6.04 grams per tonne (g/t) in 2025 from 4.86 g/t in 2024, lowering unit costs and helping offset rising input costs without relying on higher gold prices. A fourth ball mill being installed at Palito will increase throughput from 650 to 900 tonnes per day using equipment from a dormant plant, reducing additional capital spending.
Financing Resilience Supports Growth Through Rate Uncertainty
With uncertainty over the Fed's rate path and a $1,400 per ounce gap between bank forecasts, balance sheet strength has become as important as resource quality in determining which producers can fund growth without issuing dilutive equity during periods of weaker gold prices.
Non-Dilutive Financing Strengthens Development Funding
i-80 Gold's Q1 2026 results show a company still scaling toward steady-state production rather than generating sustainable free cash flow. The company produced 10,825 ounces and reported a net loss of $78.6 million as it continued a capital-intensive buildout. The quarter's most important development was its recapitalization. A $787.5 million financing package comprising a $250 million net smelter return (NSR) royalty with Franco-Nevada US Corporation, a gold prepayment facility of up to $250 million with National Bank of Canada and Macquarie Bank, and $287.5 million in convertible senior notes increased total capital raised since early 2025 to more than $1 billion. The financing also retired $165.0 million of debt, resolved the company's prior going-concern disclosure, and left the company with $513.5 million in cash at quarter-end.
Richard Young, President and Chief Executive Officer of i-80 Gold, explains how higher gold prices improve financing flexibility:
"We still need another $100 million to $200 million to complete the recap. But at $3,600 gold, we're fully funded. We say publicly phase one and two, but we're actually fully funded for all three phases."
Near-Term Production Outweighs Long-Dated Project Potential
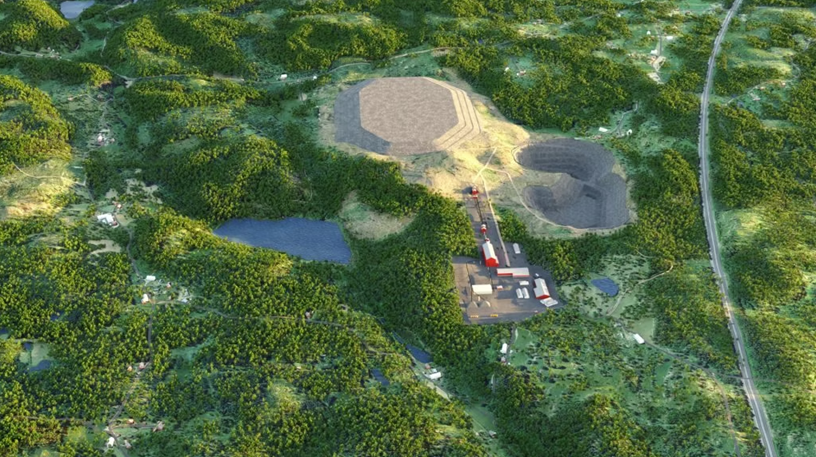
West Red Lake Gold Mines recently reached commercial production on its Madsen Mine and sits within a 47-square-kilometer land package in Ontario's Red Lake district, which has produced more than 20 million ounces of gold historically. Instead of relying on near-term gold price strength, the company is funding a 4,000-meter surface drill program at the past-producing Starratt-Olsen target while continuing underground development at the Fork deposit, which is scheduled for inclusion in the Madsen production profile in 2027.
Shane Williams, President and Chief Executive Officer of West Red Lake Gold Mines, discusses why today's gold market favors producing mining companies:
"Gold cycles run for four or five years. Near-term cash flow is much better today than a project that won't produce for another five years because it could miss this gold cycle. I'd much rather have a mine in production today generating cash flow over the next four years than a great project that's still five years away."
US Jobs Report & Gold's Next Market Catalyst
The Fed's interest rate path remains the primary driver of gold prices through the rest of 2026, even as energy market volatility continues to increase mining costs. This differs from recent years, when geopolitical risk was a more consistent driver of short-term gold price movements. Although the Strait of Hormuz ceasefire remains fragile, markets are once again focusing primarily on how the Fed responds to inflation and economic data when pricing gold.
The next key catalyst is the July 2 release of the Bureau of Labor Statistics' June Employment Situation Report, brought forward a day because of the Independence Day holiday. Consensus forecasts call for approximately 172,000 new jobs. The report could significantly influence expectations for the Fed's next policy move and, in turn, gold prices. Stronger-than-expected employment growth would likely increase expectations of a September rate hike above the current level of about 60% and move gold closer to Goldman Sachs' $4,400 downside scenario. Weaker-than-expected employment growth, particularly if accompanied by downward revisions, could reduce expectations of further rate hikes and support a move back toward the $4,200 to $4,300 range.
With uncertainty over the Fed's rate path still driving gold price expectations, producer valuations over the next two quarters will depend on both company-specific execution and interest rate expectations. Capital discipline, financing strength, and cost control therefore become more reliable screening criteria than attempting to predict where gold prices finish the year.
The Investment Thesis for Gold
- Fed-driven changes in ETF demand can pressure gold equities even as central bank buying continues to support producer cash flow.
- Debt-free balance sheets and internally funded growth reduce reliance on dilutive equity financing when higher interest rates and weaker equity markets make external capital more expensive.
- NPV estimates and reserve assumptions remain sensitive to gold price forecasts, making conservative price decks more reliable for evaluating project economics.
- Non-dilutive financing, including royalty agreements, gold prepayment facilities, and convertible notes, allows producers and developers to fund growth without issuing equity during periods of interest rate uncertainty and weaker share prices.
- Fully funded drilling programs expand future production opportunities without relying on stronger near-term gold prices or external financing.
- Transparent AISC guidance, even when costs are revised upward, provides a more reliable basis for evaluating future margins than short-term changes in gold prices.
- Financing strength, cost control, and internally funded growth are becoming more important drivers of producer performance than short-term changes in gold prices.
The Fed's rate path has driven gold sector valuations more than any other single factor since the June FOMC meeting. The July 2 employment report is the next key catalyst, and Wall Street's $1,400 per ounce gap in year-end forecasts reflects genuine disagreement among Tier 1 forecasters about where gold lands by year-end. Producers with predictable cash generation, strong balance sheets, and disciplined cost control are better positioned to manage that rate uncertainty than those relying on higher gold prices to hit their targets. Those characteristics provide a more defensible basis for evaluating gold equities right now than a specific year-end price forecast.
TL;DR
The Fed's shift toward a more hawkish policy outlook has become the primary driver of gold prices, outweighing geopolitical events and creating a record 14% quarterly decline despite continued central bank buying. Wall Street's $1,400 per ounce gap in gold price forecasts reflects uncertainty over future interest rates rather than weakening physical demand. As higher operating costs and uncertain gold prices pressure producer margins, companies with strong balance sheets, disciplined cost control, non-dilutive financing, and internally funded growth are better positioned to navigate the second half of 2026 than those relying on higher gold prices alone.
FAQs (AI-Generated)
Analyst's Notes


Subscribe to Our Channel


Stay Informed