




Export Disruptions Drain 69 Million Barrels, Raising Crude Price Risk Despite Higher Supply


Export disruptions drained 69 million barrels despite higher oil supply, raising crude price risk, diesel costs, and the importance of secure delivery.
- Global oil supply rose by 2.4 million barrels per day to 101.5 million barrels per day in July 2026, while observed global oil inventories fell by 69 million barrels as export disruptions reduced oil in transit rather than production.
- The Strait of Hormuz averaged roughly 13 vessel transits per day over the five days through August 11, 2026, near its lowest level since May 12, while the Caspian Pipeline Consortium (CPC) halted Black Sea loadings for the third time in a month.
- On August 11, 2026, the US Energy Information Administration (EIA) forecast Brent averaging $87 per barrel in 2026 and $69 in 2027, based on most regional crude production returning near pre-conflict levels in early 2027.
- The EIA reported that US distillate inventories stood 12% below the five-year average on August 7, 2026, while retail diesel averaged $5.257 per gallon on August 10, up 40% year over year and raising costs for mines that use diesel for hauling and power generation.
- Onshore explorers with domestic pipeline and refining access avoid tanker and chokepoint exposure, a distinction that reserve-based valuation screens focused on barrel volumes can overlook.
Gulf & Caspian Interruptions Reduce Oil in Transit, Increasing Crude Price Sensitivity
According to the International Energy Agency (IEA), global observed oil inventories fell by 69 million barrels in July, while onshore stocks accounted for only 6 million barrels of the decline. The IEA attributed most of the draw to lower volumes of oil on water following renewed export disruptions in the Gulf and Caspian Sea. The inventory decline therefore reflects constrained delivery rather than stronger consumption, placing export-route availability at the center of near-term crude pricing.
Kpler data placed Strait of Hormuz traffic at approximately 13 vessel transits per day over the five days through August 11, 2026, close to the lowest level recorded since May 12 across all vessel types. On August 12, Iran’s Persian Gulf Strait Authority said the Strait remained blocked until Iran’s conditions were accepted, while the US government maintained that up to 9 million barrels per day continued to cross the waterway. The conflicting claims leave actual export capacity uncertain, widening the range of near-term supply and crude-price outcomes.
CPC, which moves roughly 1.8 million barrels per day and carries more than 80% of Kazakhstan’s oil exports, halted loadings for the third time in one month in early August 2026 after drone strikes hit two tankers at Novorossiysk. Five inbound tankers diverted to Turkey and Spain or began awaiting new instructions, while Kazakhstan’s Ministry of Energy sought to reroute volumes through Azerbaijan, Georgia, and Turkey. Disruptions across two unconnected export routes show that seaborne supply risk extends beyond a single conflict, making diversified market access relevant to oil asset valuation.
Rising Output Fails to Reach Buyers, Doubling the Oil Deficit & Favoring Secure Delivery Routes
According to the IEA, global oil supply rose by 2.4 million barrels per day to 101.5 million barrels per day in July 2026, while its third quarter 2026 oil balance was revised to a supply deficit of 1.8 million barrels per day from roughly 800,000 barrels per day. Rising production alongside a larger projected deficit indicates that export and transit constraints, rather than insufficient oil production, are limiting the barrels reaching buyers.
Gulf Loadings Fall 40%, Leaving 8.3 Million Barrels per Day Offline as Supply Deficit Doubles
Gulf loadings fell 40% from 20 million barrels per day at the start of July 2026 to around 12 million barrels per day later in the month. Total global supply remained 6.3 million barrels per day below year-earlier levels, with 8.3 million barrels per day of Gulf output remaining offline. When export loadings stop, terminal and oil-field storage capacity fills, forcing operators to halt production because the oil cannot reach buyers. Because the wells already exist, restoring export access can return barrels to the market faster than developing new production.
On August 12, 2026, the IEA revised its global oil demand forecast to a decline of 1.6 million barrels per day, 510,000 barrels per day larger than its July estimate. The Organization of the Petroleum Exporting Countries (OPEC) also cut its 2026 demand growth forecast to 580,000 barrels per day, its fourth consecutive reduction. Despite the weaker demand forecasts, the IEA’s projected third-quarter supply deficit more than doubled to 1.8 million barrels per day, indicating that export and transit constraints outweighed the effect of lower consumption.
Transit & Supply Assumptions Create $60 Brent Range, Requiring Multiple Price Cases in Project Valuations
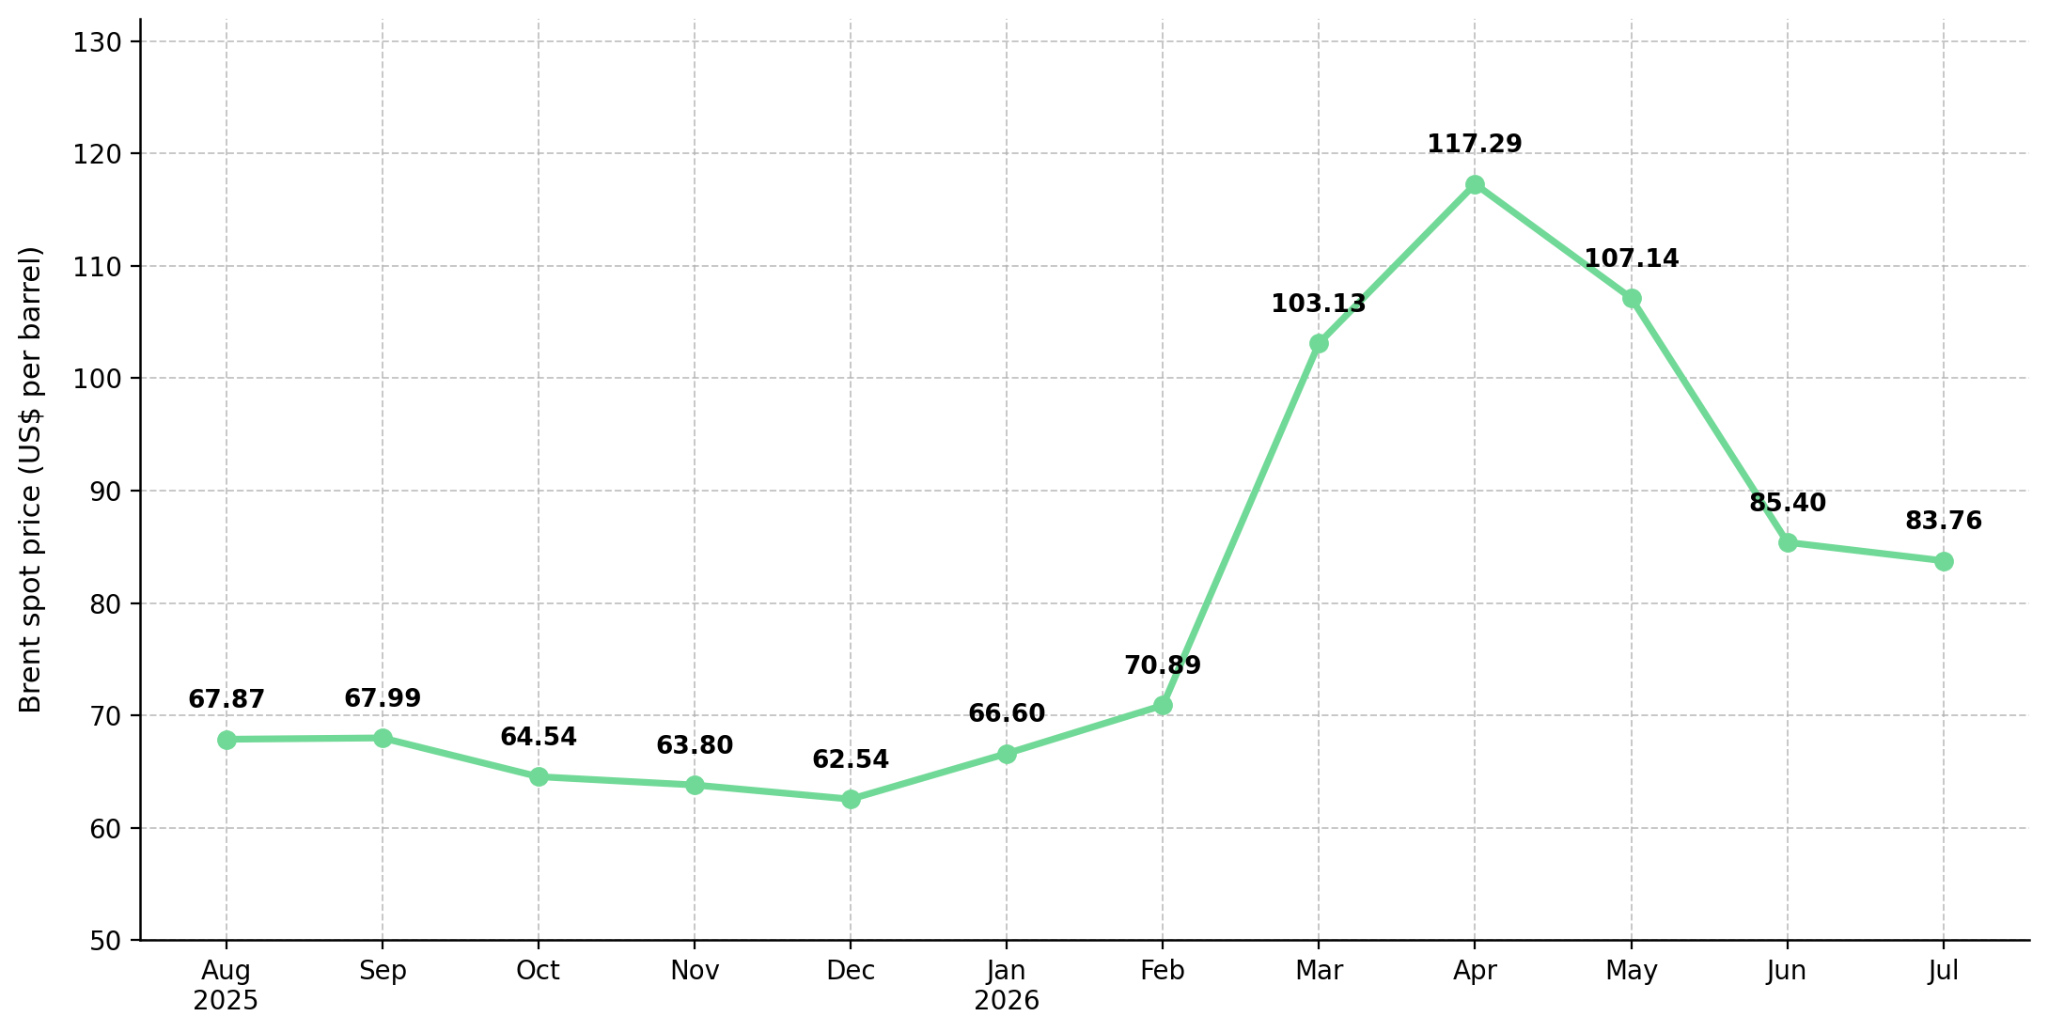
On August 11, 2026, the EIA forecast Brent averaging around $85 per barrel in the third quarter of 2026 and $87 per barrel for the full year before falling to $69 per barrel in 2027. The forecast assumes most regional crude production returns to near pre-conflict averages in early 2027, while disruptions of approximately 0.6 million barrels per day continue through year-end. The $18 per barrel decline from 2026 to 2027 therefore reflects the assumption that more regional supply reaches buyers, making export access central to the 2027 price forecast.
On July 23, 2026, Goldman Sachs stated that Brent could exceed $120 per barrel in the fourth quarter of 2026 and average $100 per barrel in 2027 if Hormuz disruptions continue. Its base case, which assumed the Strait remained open, placed Brent at $80 per barrel in the fourth quarter and $75 per barrel in 2027, while supply above expectations could push the price toward the low $60s by the end of 2027. The scenarios span roughly $60 per barrel, showing that route and supply assumptions can change oil-price inputs enough to alter project valuations.
Maritime Route Risk Raises the Importance of Onshore Delivery for a 27.6 Million-Barrel Resource
Reliable delivery routes determine whether oil reaches buyers, so route access affects project economics. Onshore projects connected to domestic pipelines and refineries avoid tanker transport, higher conflict-related insurance costs, and export-loading delays, but exploration-stage acreage still carries discovery and development risk. Valuations should therefore assess delivery access alongside resource size and development stage because not every barrel has equal access to buyers.
Dune Oil tendered a 40-kilometer seismic program that could identify four to six additional drilling locations by September 2026, expanding the project’s drilling inventory beyond the North Prospect’s 27.6 million-barrel contingent resource. The independent evaluation assigns the resource an 81% chance of commerciality and a risk-adjusted net present value discounted at 10% (NPV10) of $594.2 million. The company can earn up to a 29% interest by funding a staged $15 million work program, including approximately $4.35 million due September 15, linking its project ownership to the completion of these funding commitments.
Scott Lower, President of Dune Oil, quantifies light oil volumes and their commercial potential:
“Based on the wells on the North Lead that were drilled, we commissioned an independent third-party qualified resource evaluator to prepare a report. It was 27 million barrels of oil net to Dune with an 80% chance of commerciality, which gives us around 23, 24 million barrels net after risk on a 2C basis.”
Export & Refinery Disruptions Cut Processing Forecasts by 370,000 Barrels Daily, Raising Mine-Site Diesel Costs
Restricted crude exports reduce refinery feedstock, tightening diesel and other fuel supplies and raising costs for mines that rely on fuel for hauling and power generation. The IEA reported on August 12 that global refinery processing reached 80.9 million barrels per day in July, nearly 5 million barrels per day below the year-earlier level. Middle East product export disruptions and attacks on Russian refineries reduced the third quarter 2026 processing forecast by a further 370,000 barrels per day. Atlantic Basin refining margins for light and middle distillates reached record highs in July, indicating tighter availability of diesel-range fuels.
Distillate Inventories Stand 12% Below Average as Diesel Rises 40%, Raising Gold & Copper Costs
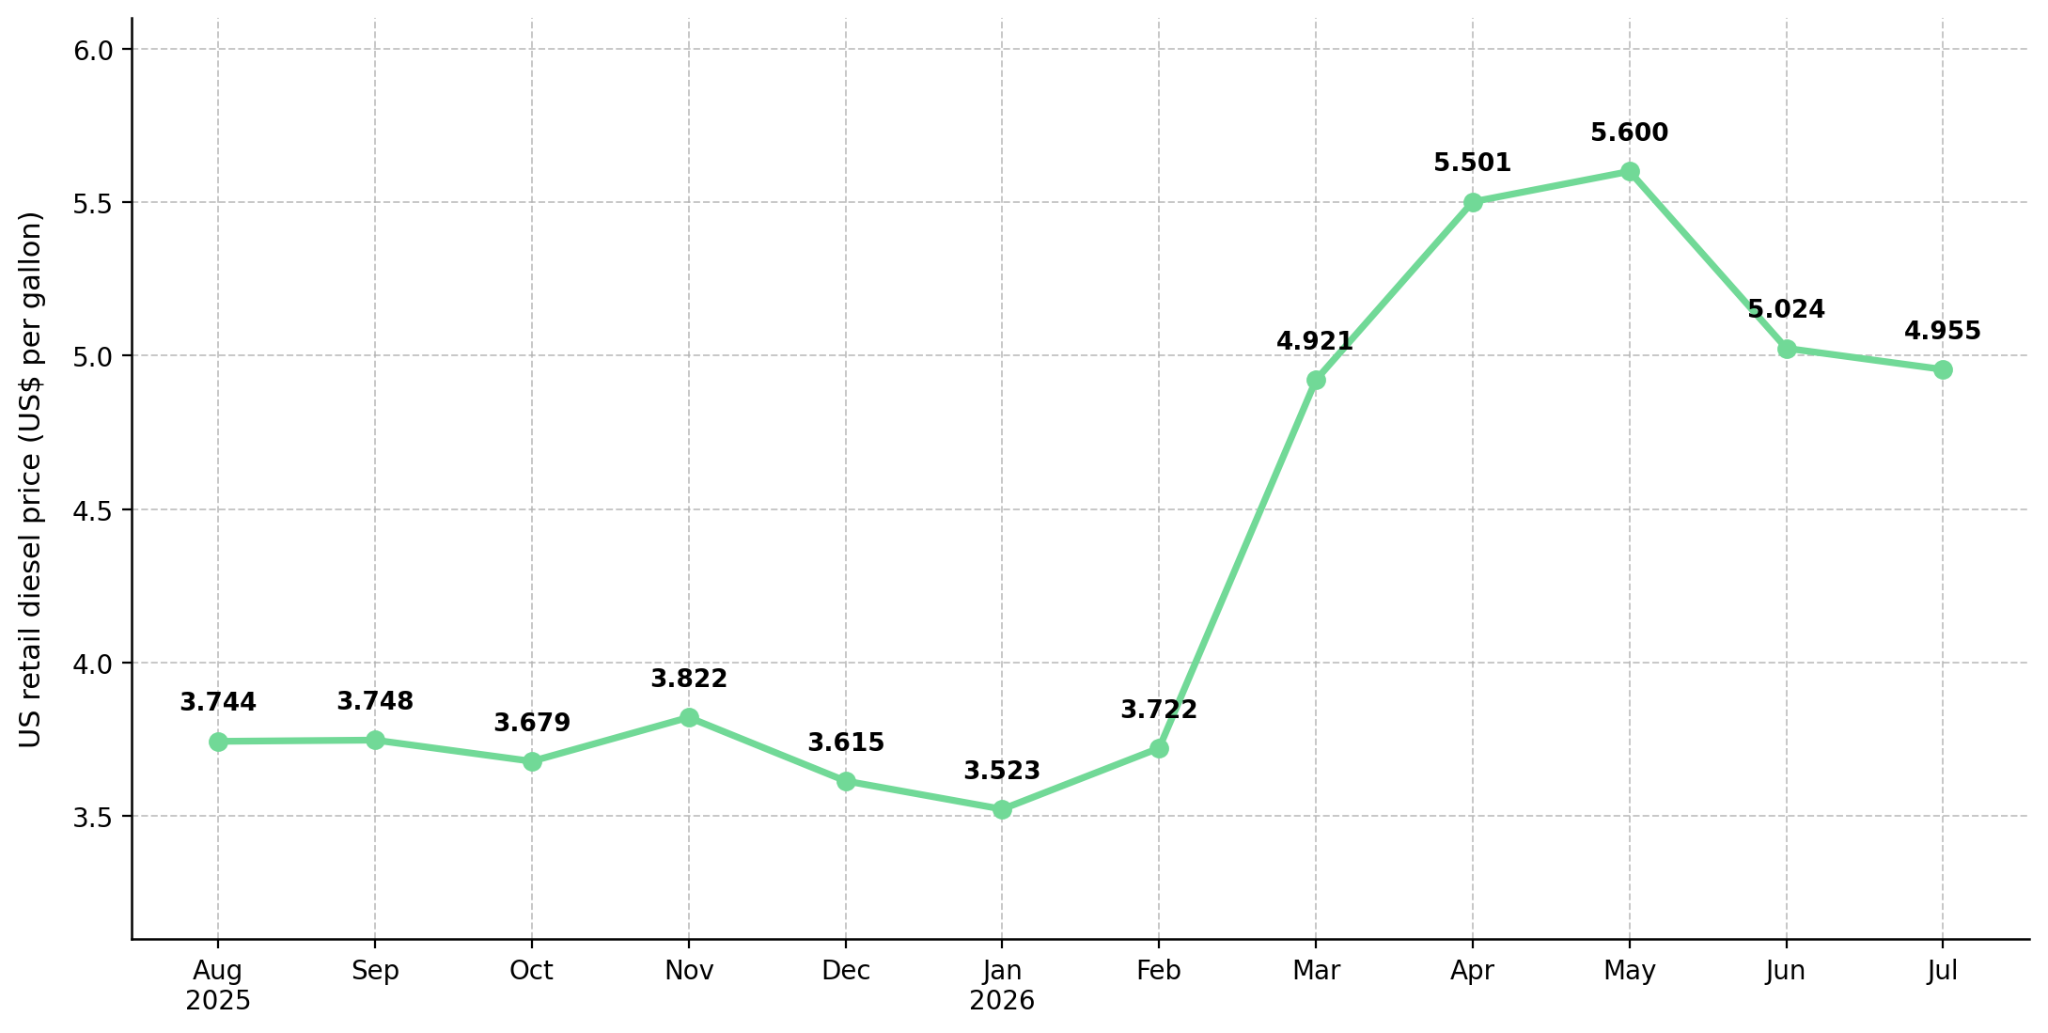
Middle distillates include the diesel used to haul ore and power remote mine sites, making low inventories directly relevant to operating costs. The EIA reported on August 12, 2026 that distillate fuel inventories stood at 107.1 million barrels for the week ending August 7, approximately 12% below the five-year average, while propane and propylene inventories were 31% above their five-year average. The US average retail diesel price reached $5.257 per gallon on August 10, up $1.503, or 40%, from one year earlier. On August 11, the EIA raised its 2026 wholesale diesel forecast by 8.5% to $3.37 per gallon.
Barrick Mining’s second quarter 2026 results, released August 10, show that each $10 per barrel change in oil prices alters diesel costs by $12 per ounce for gold and $0.04 per pound for copper. S&P Global Market Intelligence estimated in April 2026 that gold margins after all-in sustaining costs (AISC) would exceed $3,200 per ounce and that production costs for more than 99% of copper output would remain below the 2026 consensus price, indicating that most operations would remain profitable as fuel costs rise.
Oil Stocks Fall Below 7.9 Billion Barrels as Strategic Reserves Drop 26%, Raising Price Sensitivity
The IEA reported on August 12, 2026 that global observed oil stocks fell below 7.9 billion barrels for the first time since April 2025, after declining by 410 million barrels since the conflict began at an average rate of 2.7 million barrels per day. The IEA said lower inventories increased the urgency of reopening the Strait because less stored oil remains available to offset further export disruptions, causing additional supply losses to affect crude prices more quickly.
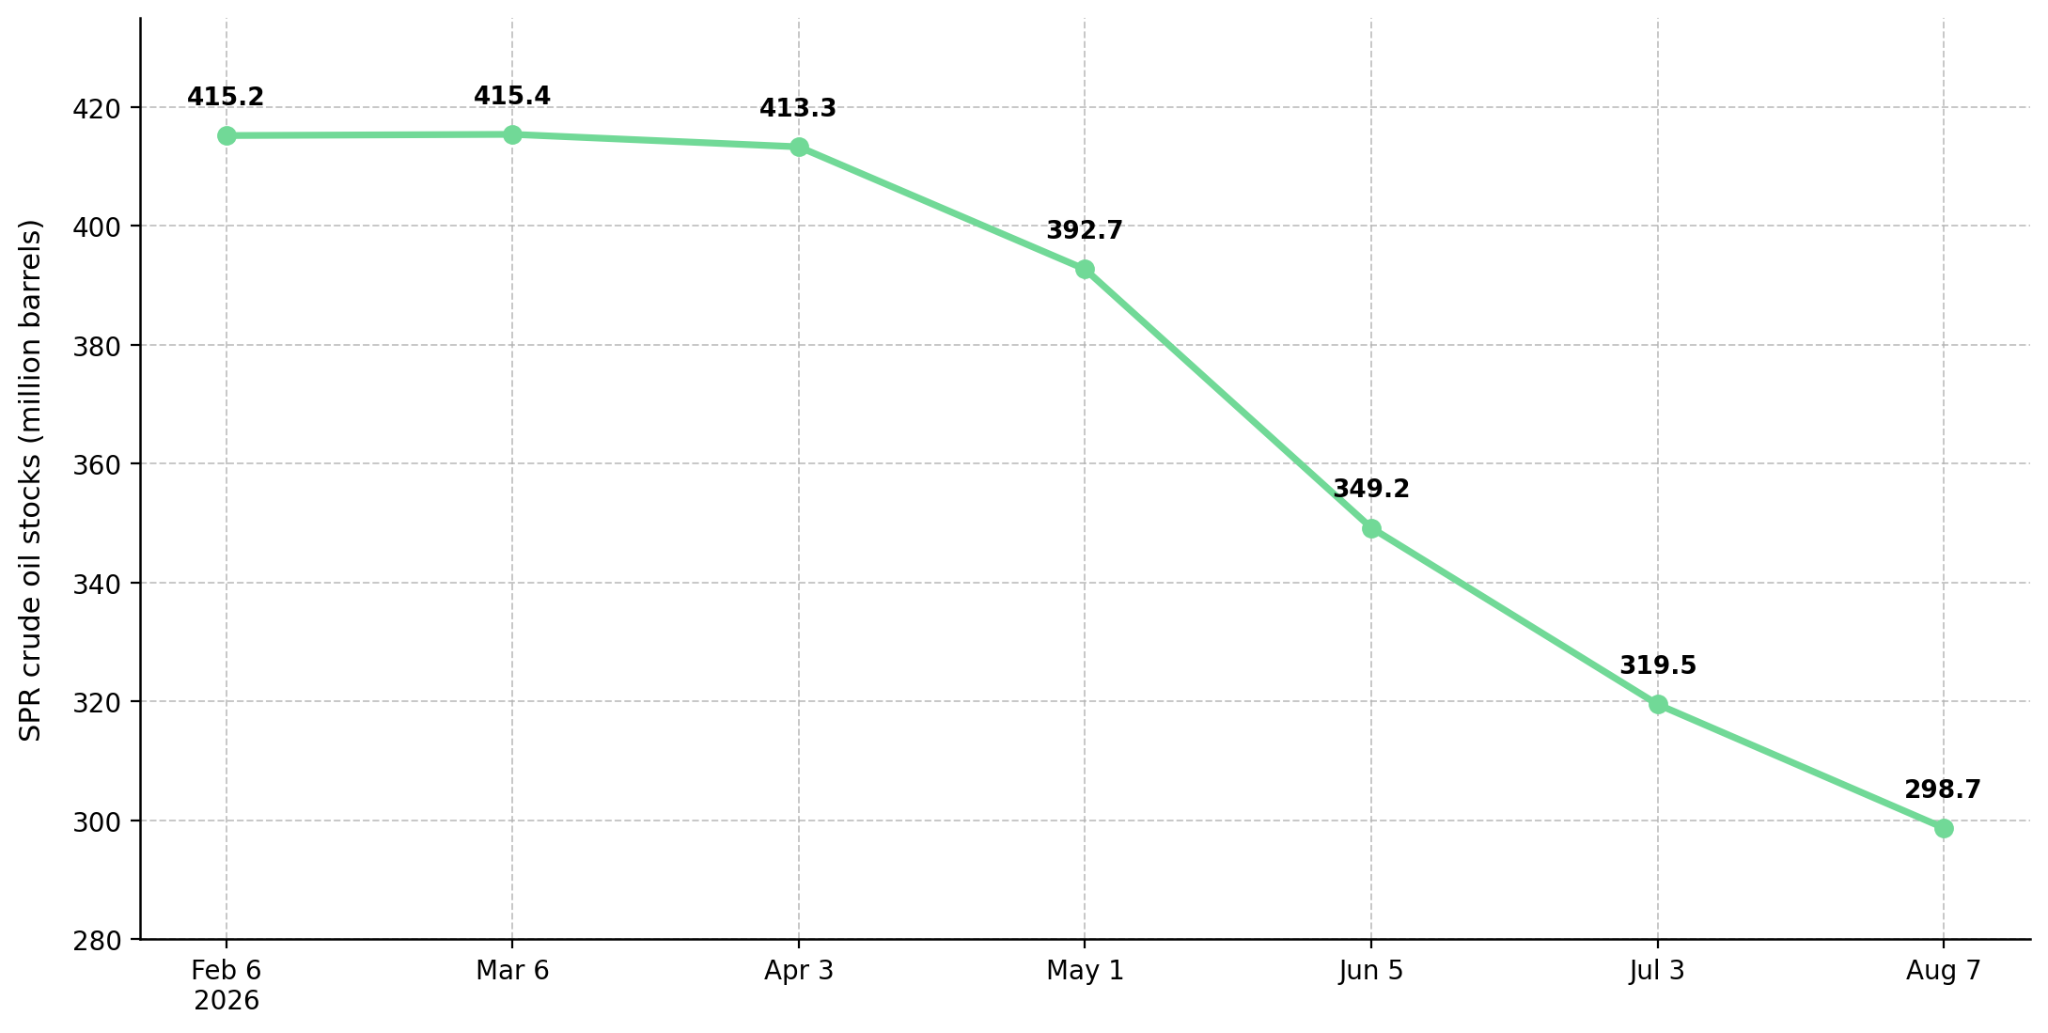
US Strategic Petroleum Reserve (SPR) holdings stood at 298.7 million barrels for the week ending August 7, 2026, down 104.5 million barrels, or approximately 26%, from one year earlier. The IEA reported that emergency stock releases slowed during July, reducing the amount of reserve supply entering the market. On August 11, the EIA reduced its 2026 US commercial crude inventory forecast by 37 million barrels to 396 million barrels and projected stocks below the five-year low through the end of 2026. Lower government and commercial inventories leave less supply available to offset disruptions, shortening the time between an export loss and its effect on crude prices.
Three Fed policymakers dissented in favor of a rate increase at the July 2026 meeting, indicating that a rate increase remained under consideration. A rate increase would raise the discount rates applied to long-dated exploration and development assets, reducing present values, while higher fuel prices increase capital and operating cost estimates. Together, these cost channels can lower project valuations and increase funding requirements.
The Investment Thesis for Oil & Gas
- Global oil supply rose by 2.4 million barrels per day in July 2026 while observed inventories fell by 69 million barrels, indicating that export disruptions rather than insufficient production are limiting delivered supply and increasing crude-price sensitivity to transit conditions.
- Two geographically separate export routes were disrupted in the same month, showing that seaborne crude supply faces multiple route risks and making diversified market access relevant to oil-asset valuation.
- The EIA’s Brent forecast falls $18 per barrel from $87 in 2026 to $69 in 2027 based on most regional production returning near pre-conflict levels, making restored supply access a key assumption for oil-asset valuations using this forecast.
- Exploration companies with onshore acreage and domestic pipeline or refinery access remain exposed to oil-price movements without relying on contested shipping routes, while discovery and development outcomes remain central to valuation.
- US distillate inventories stood approximately 12% below the five-year average while retail diesel prices were 40% higher year over year, increasing the fuel component of all-in sustaining costs at mines that rely on diesel for hauling and power generation.
- Gold margins after all-in sustaining costs are projected above $3,200 per ounce, while production costs for more than 99% of copper output remain below the 2026 consensus price, leaving diesel-price sensitivity highest at open-pit mines that move large volumes of waste rock and remote sites that use diesel for power generation.
Global oil supply rose by 2.4 million barrels per day in July and demand forecasts declined, yet the IEA’s projected third-quarter supply deficit more than doubled to 1.8 million barrels per day, indicating that export and transit constraints, not insufficient production, are limiting supply reaching buyers. Oil-project valuations must assess pipeline and refinery access alongside resource size, while mining cost models must use delivered diesel prices rather than crude benchmarks. With global observed stocks below 7.9 billion barrels and US SPR holdings down 26% year over year, another export disruption could affect crude prices faster than when inventories were higher. Weekly distillate inventories and vessel transits will show whether more supply is reaching buyers and whether route-related price risk is declining.
TL;DR
Global oil supply rose by 2.4 million barrels per day in July, yet inventories fell by 69 million barrels and the projected third-quarter deficit more than doubled to 1.8 million barrels per day as Gulf and Caspian export routes were disrupted. Lower vessel traffic, reduced loadings, and 8.3 million barrels per day of offline Gulf output show that delivery, not production capacity, is limiting supply reaching buyers. With global stocks below 7.9 billion barrels and US strategic reserves down 26%, further disruptions could affect crude prices faster. Route access now matters in oil-project valuation, while constrained refining and diesel prices 40% higher year over year increase mining costs.
FAQs (AI-Generated)
Analyst's Notes





Subscribe to Our Channel








Stay Informed


