P2 Gold's Gabbs PEA Clarifies Cost Discipline & Execution Risk: Why Operating Assumptions Matter More Than Headline NPV


P2 Gold's Gabbs PEA shows $942.9M NPV and 33.8% IRR. Nevada infrastructure, improved metallurgy, and 2028 production target drive institutional investment appeal.
- P2 Gold's November 2025 preliminary economic assessment for Gabbs outlines after-tax net present value of $942.9 million at five percent discount rate and internal rate of return of 33.8 percent, but investor focus has shifted toward execution realism and margin durability under conservative price assumptions.
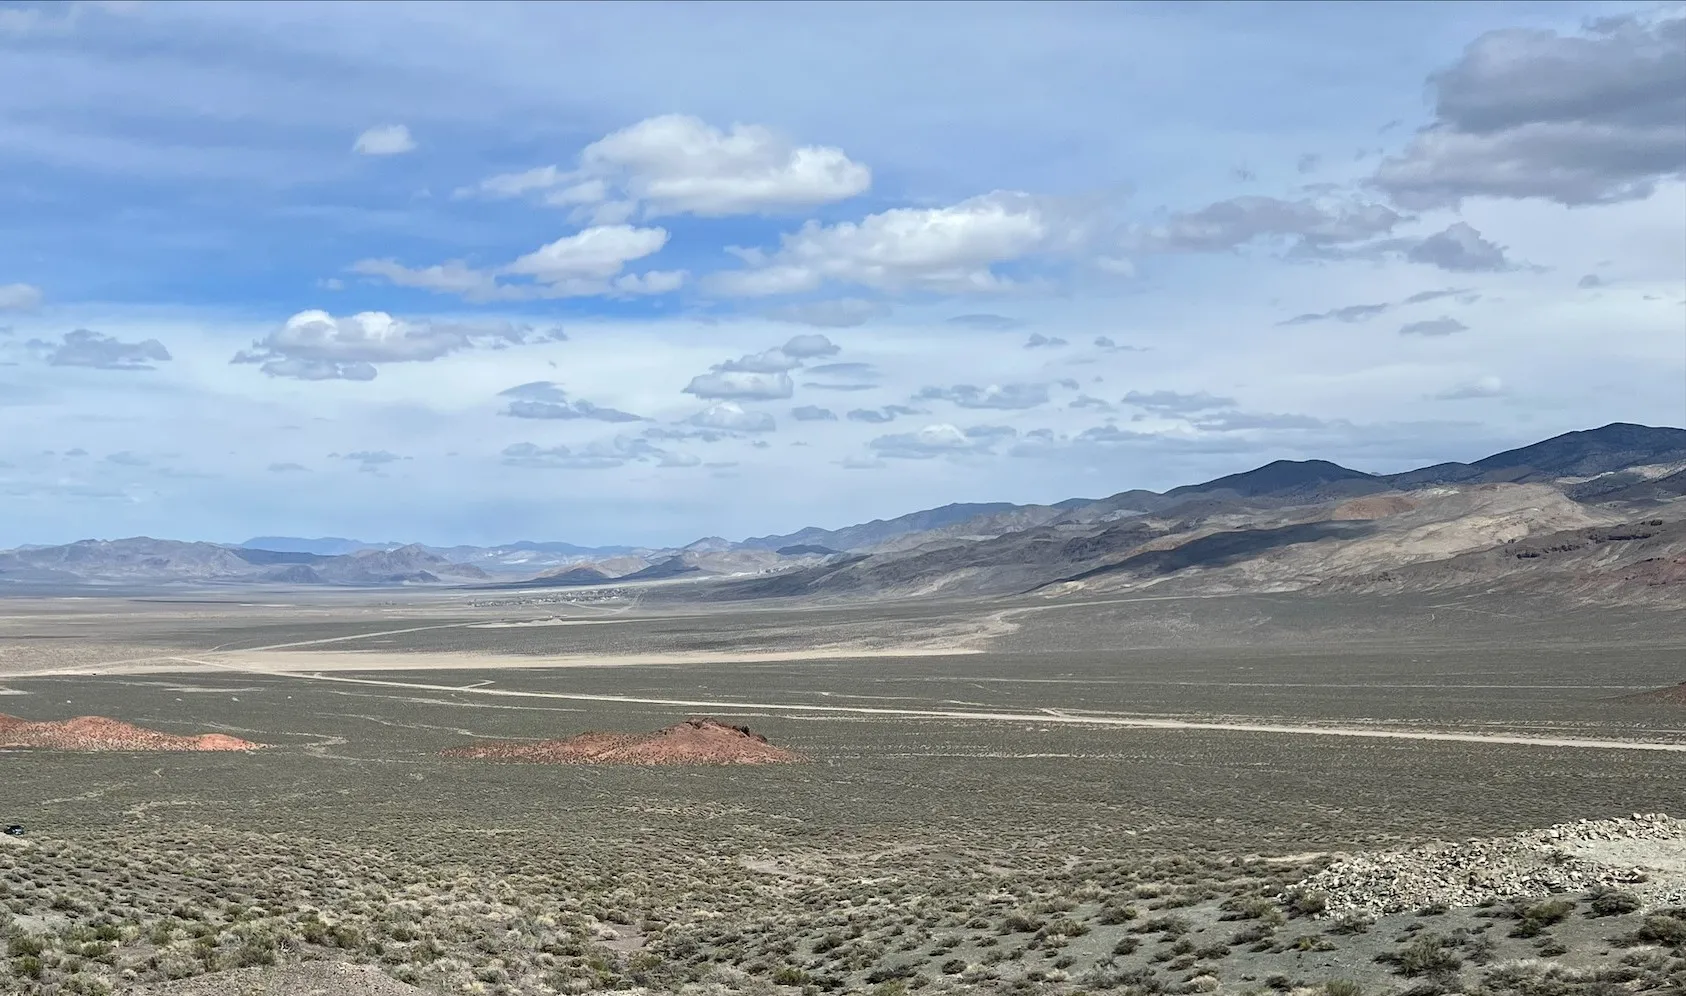
- The project's Nevada location, existing infrastructure including Highway 361 access and high-voltage powerline crossing the property, plus dual-processing flowsheet materially influence operating cost profiles and development risk.
- Near-term milestones including fourth quarter 2025 water permit approvals and January 2026 feasibility study commencement represent clear valuation inflection points rather than speculative exploration upside.
- Metallurgical advancements demonstrate gold recoveries improving from 78 percent to 85 percent and copper recoveries increasing from 54 percent to 67 percent, with Phase Three testing achieving 98 percent gold and 85 percent copper recovery within 58 days.
- Gabbs illustrates how economic optionality must now be matched by development reality to attract institutional capital, with management targeting first production in 2028 supported by clear permitting pathways and proven execution capability.
Why PEA Assumptions Are Under Greater Scrutiny in Today's Mining Cycle
The macroeconomic environment for mining project development has fundamentally shifted. Higher real interest rates, selective risk capital deployment, and tighter equity markets for development-stage companies have altered how preliminary economic assessments function in the investment decision framework. PEAs are increasingly viewed as screening tools rather than valuation anchors, with investors now stress-testing assumptions on operating costs, throughput rates, recovery performance, and development timelines before committing capital.
From Headline Economics to Execution Credibility
Markets no longer price projects solely on resource scale or peak-cycle economics. Instead, institutional capital flows toward assets demonstrating clear permitting pathways, proven metallurgical routes, and realistic capital intensity estimates. This shift reflects accumulated experience with cost overruns, permitting delays, and scope modifications that historically emerged during feasibility advancement and detailed engineering phases.
Development projects in Tier-1 jurisdictions with existing infrastructure command relative premiums as investors recognize how physical access, regulatory frameworks, and operational precedent reduce both timeline risk and capital uncertainty. The Nevada mining environment provides established permitting structures, particularly for heap leach operations, which materially compress development schedules compared to jurisdictions requiring greenfield infrastructure development.
The Market's Shift Toward "Buildability"
Investor preference has consolidated around projects offering execution clarity rather than exploration upside alone. This preference manifests in valuation multiples applied to development-stage assets, with projects demonstrating infrastructure access, processing simplicity, and jurisdictional stability receiving higher enterprise value-to-resource ratios than comparable projects lacking these characteristics.
P2 Gold's management acknowledges this reality in their strategic positioning. Chief Executive Officer Joe Ovsenek frames investor conversations around execution timelines:
"The people we've spoken to aren't looking for how many ounces you have… How are you getting into production, how quickly can you get into production."
This reflects a fundamental recalibration in how development-stage gold-copper projects are evaluated. The question is no longer whether an asset can theoretically generate returns, but whether management possesses the technical capability, permitting pathway, and capital structure to deliver production on a credible timeline.
Interpreting the Gabbs PEA: What the Numbers Say, and What They Don't
The November 21, 2025 NI 43-101 technical report for Gabbs establishes the economic framework that positions the project within mid-tier development opportunities. These metrics require context around commodity price assumptions, operating cost drivers, and capital intensity to assess execution risk accurately.
Headline Metrics in Context
The PEA outlines after-tax net present value of $942.9 million at five percent discount rate and $298.0 million at fifteen percent discount, with internal rate of return of 33.8 percent and 14.2-year mine life. These outputs derive from base case commodity price assumptions of $2,350 per ounce gold and $4.50 per pound copper, representing long-term consensus views rather than spot market conditions.
Investors examining these metrics typically apply downside scenarios to test margin resilience, recognizing that development projects must withstand commodity volatility across multi-year construction and ramp-up periods.
Production Scale and Cost Structure
Average annual production of 109,000 ounces gold and 15 million pounds copper positions Gabbs as a mid-scale operation. The $382.7 million preproduction capital requirement aligns with institutional debt capacity and equity market appetite for development-stage mining companies, avoiding the multi-billion-dollar commitments that mega-projects require.
Operating costs of $1.56 per tonne mined, combined with heap leach processing costs of $12.72 per tonne and mill processing costs of $14.59 per tonne, indicate structural advantages from geology, infrastructure access, and metallurgical simplicity. These unit costs provide margin buffers that absorb inevitable cost inflation during detailed engineering and construction phases.
The resource base totaling 3.45 million gold-equivalent ounces (1.16 million indicated, 2.29 million inferred from the April 2024 estimate) provides sufficient scale to support the projected mine life. The indicated resource contains 0.72 million ounces gold, 2.17 million ounces silver, and 297.0 million pounds copper, while inferred resources add 1.28 million ounces gold, 3.04 million ounces silver, and 567.1 million pounds copper.
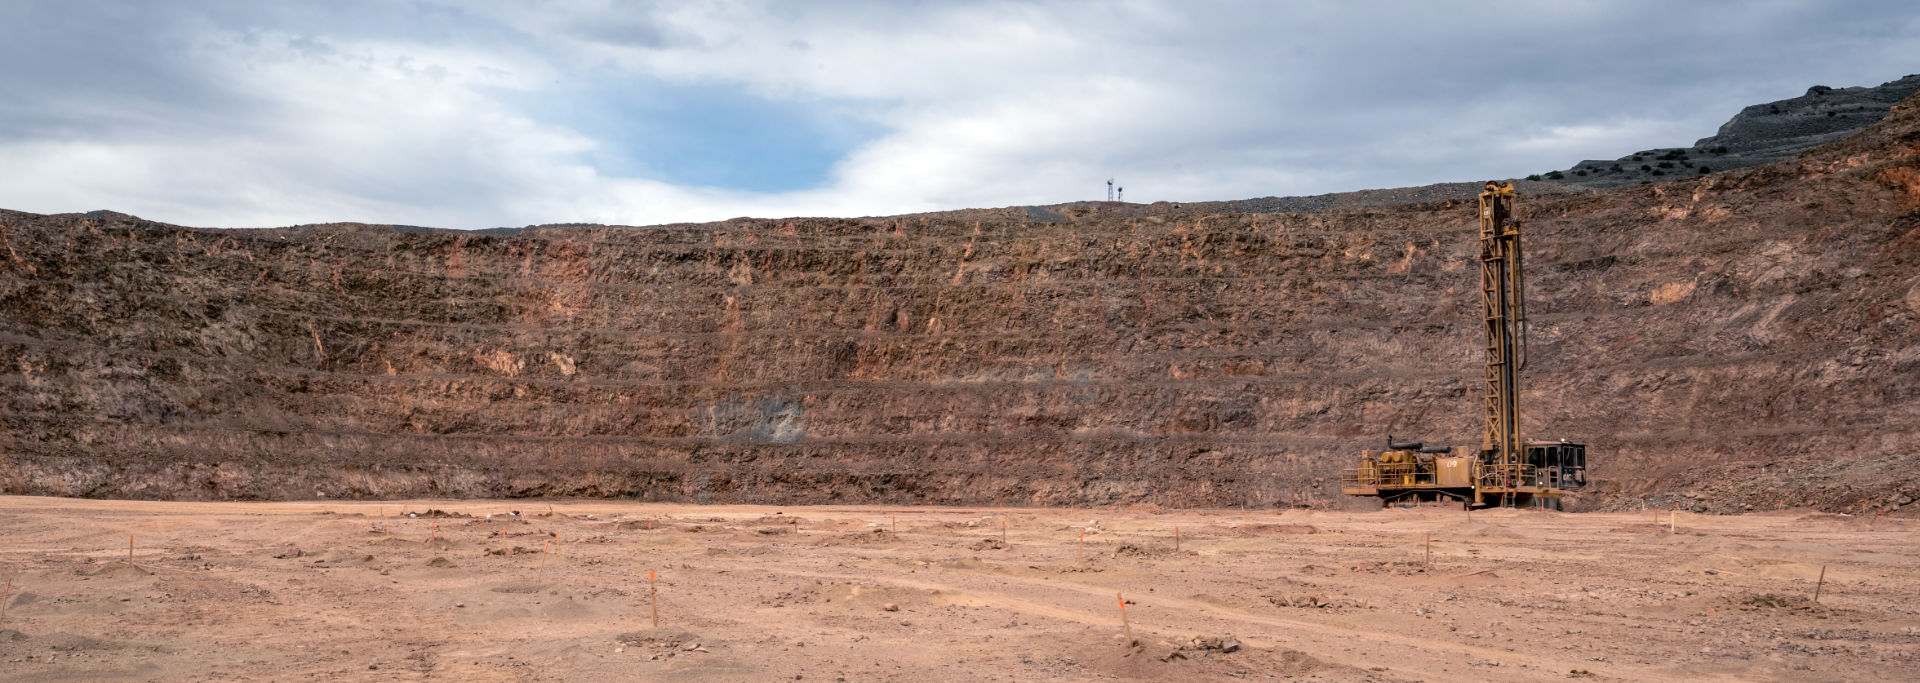
Cost Drivers Beneath the Surface: Infrastructure, Flowsheet & Metallurgy
Infrastructure access and metallurgical characteristics represent the primary determinants of whether a project transitions from economic concept to operating mine. These physical realities constrain operating costs, capital requirements, and development timelines more definitively than resource scale or commodity price assumptions alone.
Infrastructure as a Structural Cost Advantage
Gabbs benefits from paved Highway 361 access and a high-voltage powerline crossing the project, materially reducing both capital expenditure and operating costs compared to remote projects requiring greenfield infrastructure development. Grid power connection availability avoids diesel generation costs and associated fuel logistics, creating operating cost advantages that compound across mine life.
Water availability on-site, currently undergoing re-permitting with expected approval in fourth quarter 2025, addresses a critical resource requirement without requiring long-distance water supply infrastructure. The project consists of 543 lode mining claims on Bureau of Land Management federal land plus one patented claim, providing secure land tenure.
Nevada's established mining infrastructure network provides additional advantages through available service providers, equipment suppliers, and skilled labor pools. These ecosystem benefits reduce mobilization costs, shorten equipment delivery timelines, and compress construction schedules.
Dual Processing Strategy and Metallurgical Advancements
The differentiation between oxide and sulphide material requires distinct processing approaches that influence both capital intensity and operating costs. Metallurgical testing conducted in phases from 2021 through 2025 demonstrates material improvement in recovery rates.
Phase Three Metallurgy results show gold recoveries advancing from 78 percent to 85 percent, while copper recoveries in oxides increased from 54 percent to 67 percent. These improvements translate directly into revenue enhancement without corresponding increases in operating costs. Ovsenek quantifies the advancement:
"Gold recoveries have gone from 78% to 85%. Copper recoveries, this is in the oxides, have gone from 54% to 67%."
The implementation of sulphurization, acidification, recycling, and thickening technology specifically addresses copper recovery from oxide material, representing a technical breakthrough for oxide copper recovery in heap leach operations:
"The real game-changer for Gabbs is the introduction of a SART plant, which is a development for the recovery of gold and copper oxides."
Phase Three Metallurgy demonstrates that 98 percent of gold and 85 percent of copper can be recovered within 58 days, potentially enabling footprint reduction and capital expenditure optimization. Faster leach kinetics reduce the size of leach pads required for target production rates, lowering both initial capital and ongoing maintenance costs.
Development Constraints: Where Risk Still Resides
Despite favorable infrastructure and metallurgical characteristics, Gabbs faces execution risks typical of development-stage projects advancing from preliminary assessment toward construction decision. These risks center on permitting timelines, engineering refinement, and capital formation.
Permitting Timelines as Valuation Gates
Water permit approvals expected in fourth quarter 2025 represent the most immediate regulatory milestone determining development schedule credibility. Nevada's permitting framework for mining operations provides established procedures and timeline expectations, but regulatory approvals remain binary risk factors that can accelerate or delay project advancement.
Following water permit receipt, P2 Gold plans to file the mining plan of operations in early 2026, initiating the formal regulatory review process for mine development. Ovsenek outlines the regulatory sequence:
"We'll drill our water well and ideally we're filing our mining plan of operation within the next four or five months."
The company's planned schedule targets permitting completion through 2026-2027, supporting the 2028 production target that represents official company guidance.
Transitioning from PEA to Feasibility
P2 Gold plans to commence feasibility study work in January 2026, advancing directly without completing a prefeasibility assessment. This strategic decision reflects management's confidence in existing technical work and project simplicity. Ovsenek explains the approach:
"Would like to start feasibility in January. There's enough historical work and it's such a simple process."
Skipping prefeasibility accelerates development timelines but requires that existing data quality and engineering understanding support bankable documentation. If permitting and construction proceed without material delays, management targets first production in 2028.
Capital Intensity and Financing Considerations
P2 Gold announced equity financing in September 2025 targeting $6 million Canadian, which attracted significant investor interest beyond the initial target. Ovsenek notes the capital raising dynamics:
"We announced the financing September 4th. We were going out for $6 million Canadian dollars. We haven't decided how much more. We have a lot of interest."
This capital provides runway for feasibility advancement and expansion plus infill drilling programs. Oversubscribed financings signal market confidence in project execution and management credibility.
Economic Optionality vs. Development Reality: Why the Distinction Matters
Resource expansion potential functions as long-dated optionality rather than near-term valuation drivers in current market conditions. Investors prioritize projects demonstrating clear paths to production over assets offering exploration potential without corresponding execution clarity.
The project's location within Nevada's Walker Lane mineral trend provides both geological prospectivity and jurisdictional advantages. The trend hosts multiple operating mines and advanced development projects, creating ecosystem benefits from established infrastructure, regulatory precedent, and service provider networks.
Management's track record influences strategic investor confidence. Ovsenek, along with Chief Exploration Officer Ken McNaughton and Executive Vice President Michelle Romero, previously advanced Pretium Resources' Brucejack project from discovery through production in under eight years:
"We've worked together for a long time from Silver Standard. Our claim to fame is Pretium Resources, where we took the Brucejack, now it's the Brucejack mine, but we took it from discovery through to production in under eight years."
The Investment Thesis for P2 Gold
- Execution clarity increasingly drives valuation in development-stage mining projects, with investors prioritizing realistic cost structures and credible timelines over peak-cycle net present value outcomes that assume optimal conditions.
- Tier-1 jurisdictions with existing infrastructure materially reduce both timeline risk and capital uncertainty, creating structural advantages that compound across development phases from permitting through construction completion.
- Dual-commodity exposure supports margin resilience across price cycles when metallurgical performance and processing routes demonstrate technical credibility rather than theoretical potential.
- Permitting milestones function as valuation re-rating events rather than administrative formalities, with water permits and mining plan approvals representing binary catalysts that determine development schedule credibility.
- Management track records in advancing projects through construction phases materially influence institutional investor confidence, as execution capability reduces the probability of cost overruns and schedule delays.
- Infrastructure positioning within established mining districts provides ecosystem benefits including service provider availability, equipment supply chains, and skilled labor access that compress development timelines.
- Metallurgical simplicity and processing precedent reduce technical risk during feasibility advancement and detailed engineering, limiting scope for material cost increases or flowsheet modifications.
Why Gabbs' Operating Assumptions Are the Real Signal for Investors
Headline economics attract initial attention to development-stage projects, but operating assumptions, infrastructure reality, and execution credibility determine which projects earn institutional capital. The November 2025 Gabbs PEA demonstrates favorable economics, but the project's investment merit emerges from Nevada location, existing infrastructure access, proven metallurgical performance, and management's demonstrated construction execution capability.
P2 Gold's strategic positioning reflects market realities where buildability matters more than resource scale alone. The company's decision to advance directly to feasibility study in January 2026, target fourth quarter 2025 water permit approvals, and emphasize execution over exploration signals alignment with investor priorities. Valuation upside will result from de-risking milestones including permit approvals, feasibility completion, and construction financing rather than speculative resource expansion.
Development-stage gold-copper projects must now demonstrate discipline, realism, and sequencing clarity to differentiate themselves in competitive capital markets. Gabbs illustrates how projects combining favorable geology with execution infrastructure earn investor confidence through 2028 production targeting supported by clear permitting pathways and proven management capability.
TL;DR
P2 Gold's November 2025 preliminary economic assessment for its Gabbs gold-copper project in Nevada outlines after-tax NPV of $942.9 million at 5% discount rate with 33.8% IRR over a 14.2-year mine life. The project benefits from existing infrastructure including highway access and grid power, while metallurgical advances have lifted gold recoveries to 85% and copper recoveries to 67%. Preproduction capital sits at $382.7 million. Management targets Q4 2025 water permit approvals, January 2026 feasibility study commencement, and first production in 2028. The investment thesis centers on execution credibility and Nevada's Tier-1 jurisdiction rather than headline economics alone.
FAQs (AI-Generated)
The November 2025 PEA outlines after-tax NPV of $942.9 million at 5% discount rate, 33.8% IRR, and 14.2-year mine life based on $2,350/oz gold and $4.50/lb copper price assumptions. Average annual production targets 109,000 ounces gold and 15 million pounds copper with $382.7 million preproduction capital.
Gabbs benefits from paved Highway 361 access, a high-voltage powerline crossing the property enabling grid power connection, and on-site water availability currently undergoing re-permitting. These reduce capital requirements and operating costs compared to remote greenfield projects.
Phase Three testing improved gold recoveries from 78% to 85% and copper recoveries from 54% to 67%. The introduction of SART technology enables 98% gold and 85% copper recovery within 58 days, potentially reducing leach pad footprint and capital expenditure.
Management targets Q4 2025 water permit approvals, mining plan of operations filing in early 2026, feasibility study commencement in January 2026, and first production in 2028. The company is advancing directly to feasibility without a prefeasibility study.
CEO Joe Ovsenek and the executive team previously advanced Pretium Resources' Brucejack from discovery through production in under eight years. This execution experience influences institutional investor confidence in P2 Gold's ability to deliver Gabbs on schedule and budget.
Analyst's Notes


Subscribe to Our Channel


Stay Informed