

Silver Remains 37% Below Its Peak as Higher Interest Rates Offset a Sixth Consecutive Supply Deficit


Silver remains 37% below its peak as higher interest rates outweigh a sixth consecutive supply deficit and reshape opportunities across silver equities.
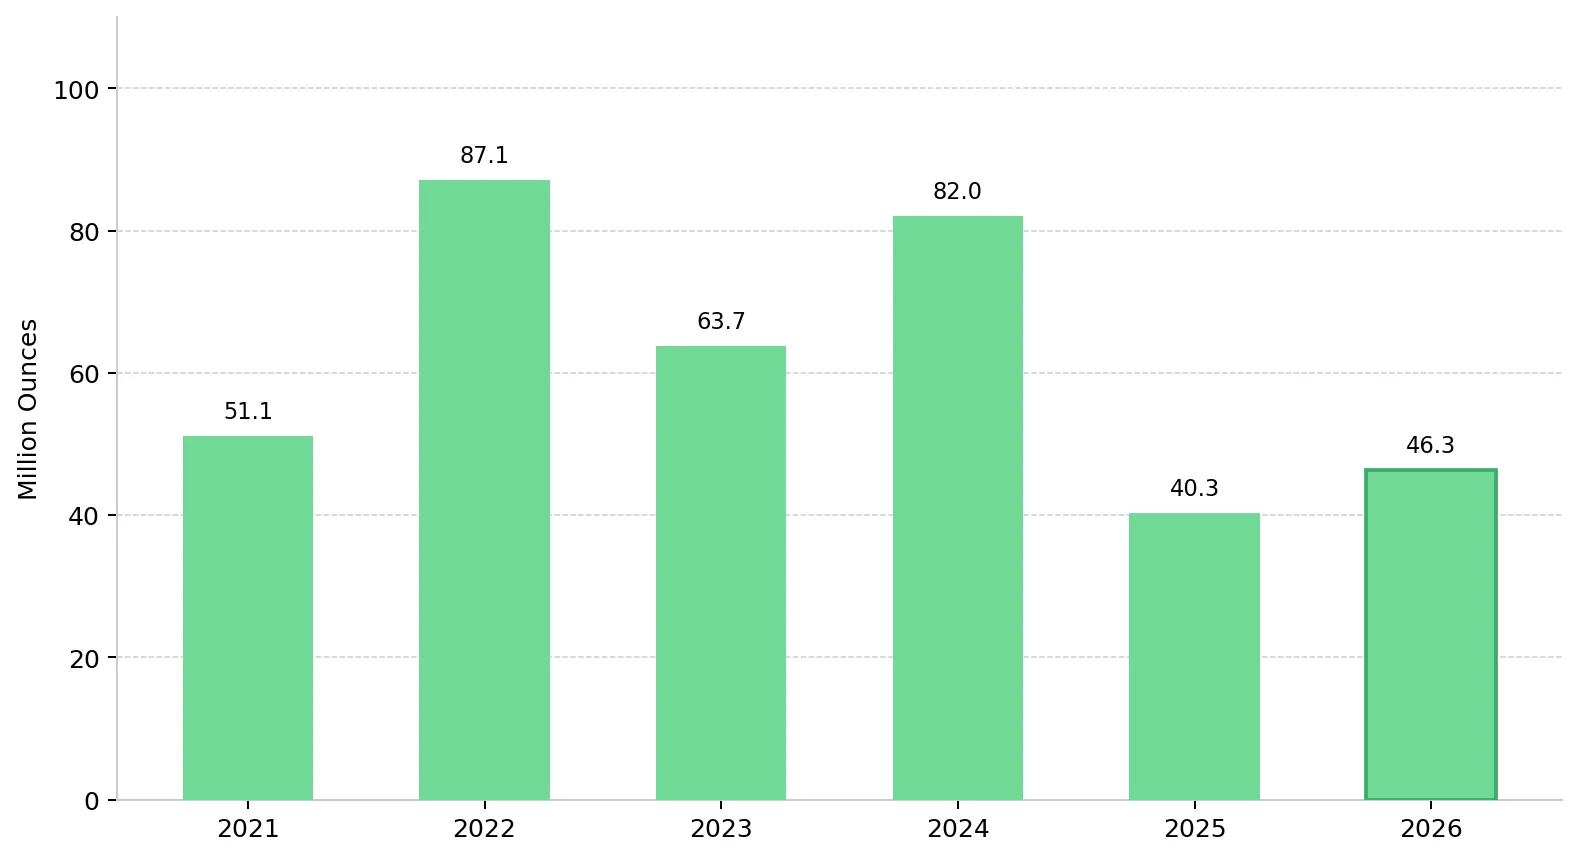
- Silver's supply deficit is widening for the sixth consecutive year in 2026, reaching 46.3 million ounces, even as solar photovoltaic thrifting reduces industrial fabrication to a four-year low, indicating that financial demand is offsetting weaker industrial consumption and supporting silver prices.
- Core Personal Consumption Expenditures inflation remains at 3.3%, and the June 16-17 Federal Open Market Committee meeting is widely expected to leave rates unchanged, keeping real yields elevated and limiting near-term upside for silver despite the market's 46.3-million-ounce supply deficit.
- Financial buyers, including ETF investors and physical bullion purchasers, are absorbing supply released by weaker industrial demand, helping sustain the 46.3-million-ounce market deficit and supporting silver prices. In a high-interest-rate environment, this favors producers with low all-in sustaining costs and near-term production growth because they generate cash flow at current silver prices.
- Silver equities offer different risk-reward profiles by development stage: producers benefit from current spot-price margins, advanced developers are most sensitive to lower discount rates and higher project valuations, and explorers provide exposure to resource growth at lower enterprise value per ounce multiples.
- The May US Nonfarm Payrolls report, released June 5, is a key near-term catalyst for silver; weaker-than-expected job growth would increase the likelihood of rate cuts, lower real yields, and support higher valuations across silver equities.
Silver Prices Fall Despite a 46.3-Million-Ounce Supply Deficit
Silver remains in a 46.3-million-ounce supply deficit, yet spot prices have fallen approximately 37% from their January 2026 high of $121.64 per ounce to $74-77 per ounce. Elevated Treasury yields, with the 10-year near 4.6% and the 30-year above 5.1%, have increased the opportunity cost of holding non-yielding silver and contributed to the price decline despite the supply deficit.
The International Monetary Fund's April 2026 World Economic Outlook lowered its 2026 global growth forecast to 3.1% and raised its inflation forecast to 4.4%, creating opposing forces for silver because slower growth can reduce industrial demand while higher inflation can increase investment demand. As a result, investment performance is likely to differ across producers, developers, and explorers, making company stage an important factor in security selection.
Financial Buyers Replace Solar Demand as Silver's Key Market Driver
The Silver Institute's World Silver Survey 2026 projects industrial fabrication of approximately 650 million ounces in 2026, the lowest level in four years. The survey projects photovoltaic demand to decline 7% to 19% year-on-year as manufacturers reduce silver usage per cell and substitute alternative materials to lower input costs. Solar photovoltaic manufacturing consumed approximately 232 million ounces of silver in 2024, representing about 19% of total demand. Reductions in silver content per solar cell are now offsetting demand growth from new installations, limiting the sector's contribution to overall silver consumption.
Financial buyers, including coin and bar purchasers, ETF investors, and institutional allocators, are absorbing supply released by weaker industrial demand, helping maintain the projected 46.3-million-ounce deficit. Global silver ETF inflows reached 95 million ounces by mid-2025, exceeding total inflows for all of 2024, according to the Silver Institute. The shift from industrial buyers to financial buyers helps explain why silver remains in deficit despite weaker fabrication demand and supports the investment case for silver producers.
Byproduct Production Limits Silver Supply Growth
Approximately 70% of global silver production is generated as a byproduct of lead, zinc, copper, and gold mining, meaning silver supply depends primarily on the economics of those metals rather than silver prices. Despite silver reaching $121.64 per ounce in January 2026, global mined supply increased only about 3% in 2025.
Some solid-state battery designs under commercialization could require up to 1 kilogram of silver per unit, creating a potential new source of demand if adoption scales. Any increase in battery-related silver demand would enter a market where new primary mine supply typically requires years to permit, finance, and build.
Different Silver Company Stages Offer Different Risk-Reward Profiles
Producers, developers, and explorers respond differently to silver prices, interest rates, and project-risk factors; producers benefit most from current margins, developers are more sensitive to discount rates, and explorers depend primarily on resource growth and permitting catalysts.
High Silver Prices Drive Producer Margins & Cash Flow
For production-stage silver companies, the current environment is defined by one dominant dynamic: operating margins are extraordinarily wide relative to historical norms. With spot silver at $74 to $77 per ounce and leading North American producers running all-in sustaining costs in the $26 to $35 per ounce range, the margin stack is compelling regardless of what happens to Fed policy expectations.
Americas Gold & Silver's Cosalá Complex produced 1.2 million ounces of silver in 2025 at an all-in sustaining cost of $26.52 per ounce, implying an operating margin of approximately $50 per ounce at current silver prices. The company's 2026 guidance of 3.2 to 3.6 million ounces implies approximately 30% production growth over 2025.
Oliver Turner, Executive Vice President of Corporate Development at Americas Gold & Silver, explains why growing demand is colliding with limited supply growth in the silver market:
"Silver has been in deficit for six consecutive years, with annual shortfalls of approximately 150 to 200 million ounces. Demand continues to grow, but about 70% of global silver supply is produced as a byproduct of other mining operations, limiting the industry's ability to respond quickly."
Development Projects Offer Greater Upside to Lower Rates
Developers with secured financing are more sensitive to interest rates than producers because project valuations depend heavily on discount-rate assumptions. Lower interest rates can increase net present value estimates and support equity valuations.
Vizsla Silver's November 2025 Feasibility Study for the Panuco project outlined an after-tax net present value of US$1.8 billion at a 5% discount rate, an internal rate of return of 111%, and a 7-month payback period using base-case assumptions of US$35.50 per ounce silver and US$3,100 per ounce gold. Current silver prices remain above the feasibility study's US$35.50 per ounce base case, while higher interest rates continue to weigh on valuations across the development-stage mining sector.A construction decision is targeted for H2 2026 and first production for H2 2027, providing a relatively near-term development timeline.
Jesus Velador, Vice President of Exploration at Vizsla Silver, describes how the company is balancing mine development with district-scale exploration:
"We have identified more than 150 vein targets within the Panuco district, but only approximately 30 have been drilled to date. This year we plan to drill more than 20,000 metres focused on new discoveries, and we recently added two more rigs to accelerate the programme. Our objective is to continue exploring while advancing development at Copala and Napoleon."
Resource Growth & Permitting Progress Drive Explorer Valuations
For exploration-stage silver companies, valuation depends primarily on resource growth, upcoming drilling and resource-update catalysts, and sufficient funding to reach the next development milestone without equity dilution.
GR Silver Mining provides an example of how exploration companies can add value through resource growth and project advancement. At approximately C$0.40 per share and a market capitalization of C$204 million, the company is valued at US$1.65 per silver-equivalent ounce versus a peer average of US$3.43 per ounce. The 2023 NI 43-101 Mineral Resource Estimate outlined 134 million silver-equivalent ounces at a historical discovery cost of US$0.12 per ounce. The company's development strategy focuses on using progress at Plomosas to support future advancement at San Marcial.
Eric Zaunscherb, Interim President and Chief Executive Officer of GR Silver Mining, explains how progress at Plomosas could support future development at San Marcial:
"The plant itself isn't expected to generate significant cash flow. Its value is that it can accelerate permitting and development at San Marcial by several years, which has a much larger impact on project economics."
Elevated Real Yields Limit Silver's Near-Term Upside
Core PCE inflation remained at 3.3% year-on-year, reducing the likelihood of near-term Fed rate cuts. Elevated real yields increase the opportunity cost of holding non-yielding silver. The April 28-29 Federal Open Market Committee minutes confirmed a unanimous decision to keep the federal funds rate at 3.5% to 3.75%, and markets broadly expect no change at the June 16-17 meeting.
The impact of high interest rates on silver depends on economic conditions, as weaker labor markets or tighter credit conditions could increase the likelihood of future rate cuts. By contrast, the projected 46.3-million-ounce silver deficit is unlikely to close quickly because mine supply remains constrained by byproduct production and long project-development timelines. For investors with a 12- to 24-month horizon, declining interest rates could support silver prices, while supply constraints continue to support the deficit at current price levels.
Nonfarm Payrolls Could Reset Silver Rate-Cut Expectations
The May US Nonfarm Payrolls report, released June 5, is a key near-term catalyst for silver because it could change expectations for Fed policy. A payroll gain below 80,000 would increase the likelihood of second-half 2026 rate cuts, lower real yields, and support higher silver and silver-equity valuations. A payroll gain above 130,000 would support expectations for unchanged interest rates and maintain pressure on silver valuations. The US economy added 115,000 jobs in April 2026, following an upwardly revised 185,000 in March. The decline from March to April suggests slower hiring growth, making the June report an important indicator for interest-rate expectations and silver prices.
The Investment Thesis for Silver
- Silver is projected to record a sixth consecutive supply deficit in 2026, widening to 46.3 million ounces. Because approximately 70% of silver supply is produced as a byproduct of other metals mining, higher silver prices alone are unlikely to generate a rapid increase in mine supply.
- Financial buyers, including ETF investors and physical bullion purchasers, are offsetting weaker solar demand as manufacturers reduce silver usage through thrifting. Investment demand depends on portfolio allocation and inflation expectations rather than industrial consumption, helping sustain the silver deficit despite lower fabrication demand.
- Elevated interest rates continue to pressure silver prices, but the projected 46.3-million-ounce supply deficit is unlikely to close quickly because mine supply remains constrained. For investors with a 12- to 24-month horizon, lower interest rates could support silver prices while supply conditions remain tight.
- Producers with low all-in sustaining costs and production growth are generating strong operating margins at current silver prices, allowing them to increase cash flow without relying on a change in interest rates.
- Advanced developers with completed feasibility studies, secured financing, and near-term construction decisions are highly sensitive to discount-rate assumptions. Lower interest rates can increase project net present value estimates and support equity valuations.
- Exploration-stage companies with sufficient funding can trade at lower enterprise value per ounce multiples than peers. Resource updates, drilling results, and permitting milestones can support valuations through company-specific progress rather than changes in interest rates.
- Silver's inclusion on the US critical minerals list introduces a policy consideration for investors, as future government stockpiling or procurement programs could add an additional source of demand.
Silver enters the second half of 2026 with a projected 46.3-million-ounce supply deficit, limited mine-supply growth, and continued support from financial buyers despite weaker industrial demand. While elevated interest rates remain a near-term constraint on silver prices, producers, developers, and explorers are exposed to different drivers and opportunities across the production curve. Producers are generating strong margins at current prices, developers remain sensitive to discount-rate assumptions, and explorers can create value through resource growth and project advancement. For investors, the key question is not whether these segments will respond differently to changing market conditions, but which part of the silver value chain offers the most attractive risk-reward profile for their investment horizon.
TL;DR
Silver remains under pressure from elevated interest rates even as the market enters a sixth consecutive supply deficit projected at 46.3 million ounces in 2026. Financial buyers, including ETF investors and bullion purchasers, are offsetting weaker solar demand and helping sustain the deficit. Because roughly 70% of silver supply comes as a byproduct of other metals mining, supply growth remains limited despite higher prices. For investors, producers offer strong margins and cash flow today, developers provide leverage to lower interest rates through higher project valuations, and explorers offer resource growth potential supported by drilling and permitting catalysts.
FAQs (AI-Generated)
Analyst's Notes


Subscribe to Our Channel


Stay Informed


