




Fed Expectations Continue to Outweigh Silver's Structural Deficit, Making July's FOMC Meeting the Next Catalyst


Silver's widening deficit supports long-term fundamentals, but Fed rate expectations remain the dominant driver ahead of the July FOMC meeting.
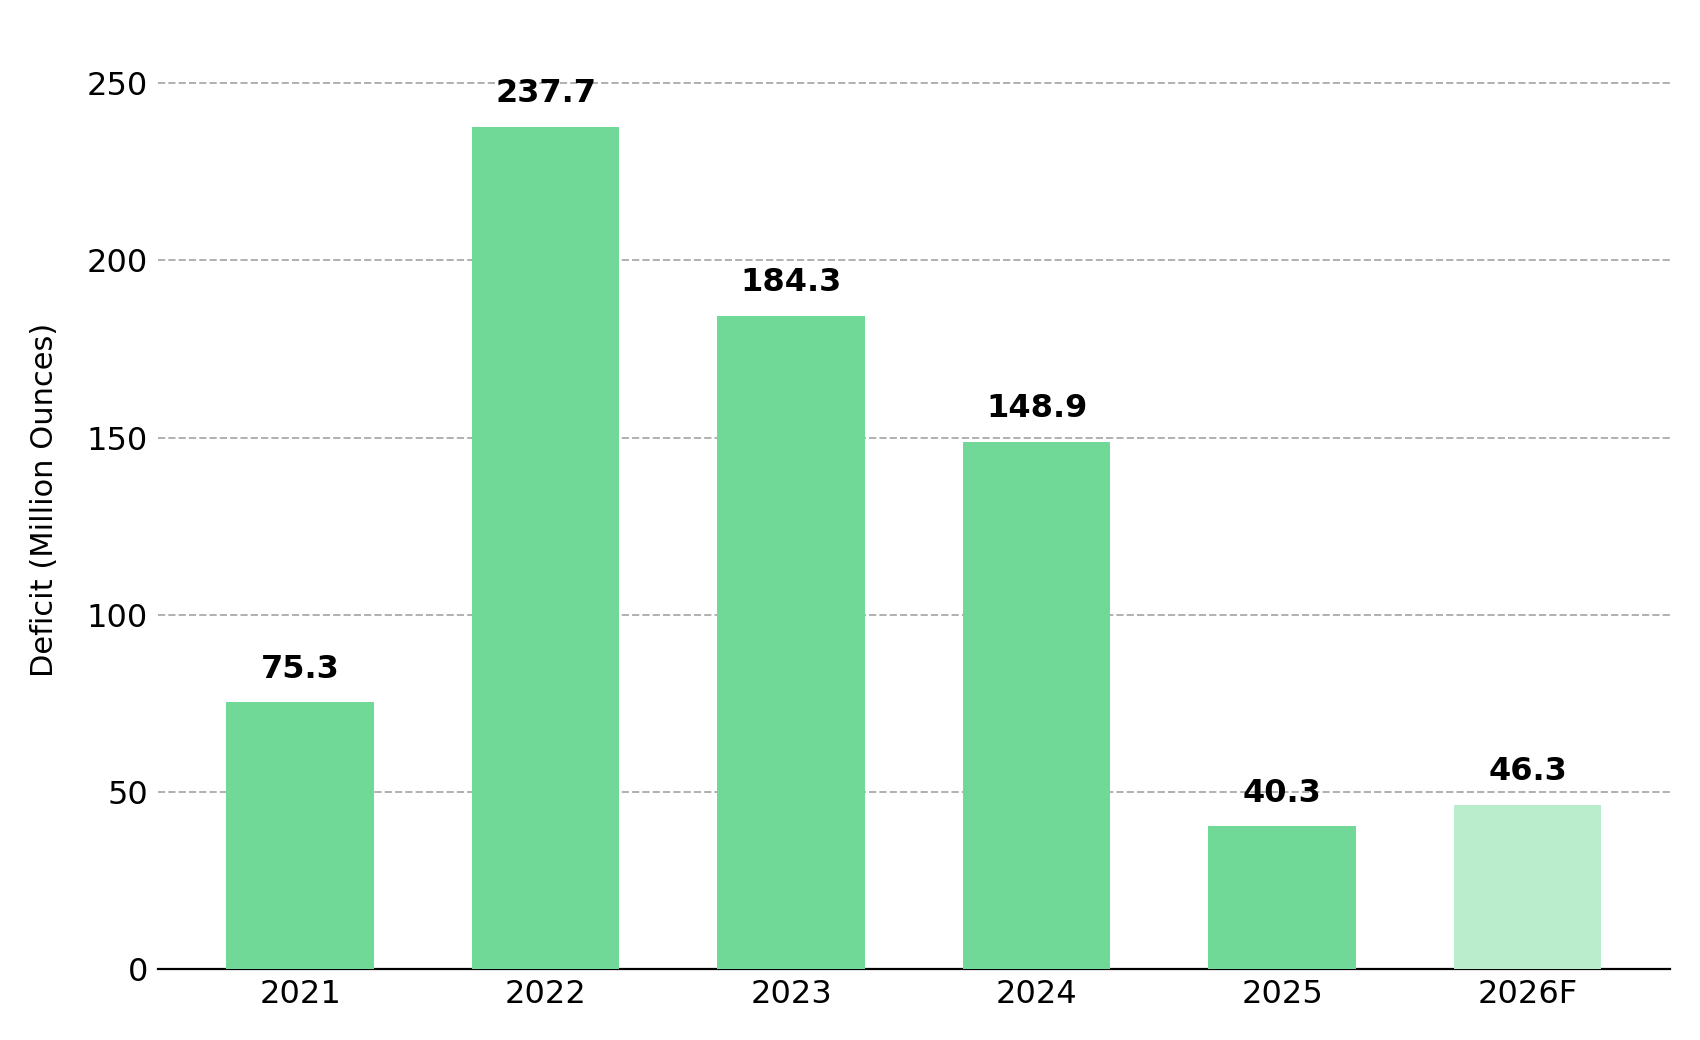
- Spot silver trades near $56 to $57 per ounce in mid-July 2026, down 52% from its January 29 all-time high of $121.78 per ounce, even as the Silver Institute's World Silver Survey 2026 reports a sixth consecutive annual deficit of 46.3 million ounces, up 15% year over year.
- The gold-silver ratio widened from 55:1 in May to about 69:1 in mid-July, showing that Fed rate expectations are outweighing the physical deficit.
- China's silver export licensing regime restricts an estimated 60% to 70% of global refined supply to domestic use, increasing the importance of internationally traded supply from Mexico and Peru.
- The July 28-29 FOMC meeting is the next catalyst for whether rate expectations continue to outweigh the physical deficit.
Fed Rate Expectations & Silver's Price Disconnect: Why the July FOMC Meeting Matters
Spot silver trades near $56 to $57 per ounce in mid-July 2026, down 52% from the January 29 all-time high of $121.78 per ounce. That decline occurred even as the physical silver market recorded its sixth consecutive annual deficit. Price and the physical market are moving in opposite directions because Fed rate expectations are outweighing physical supply-demand fundamentals.
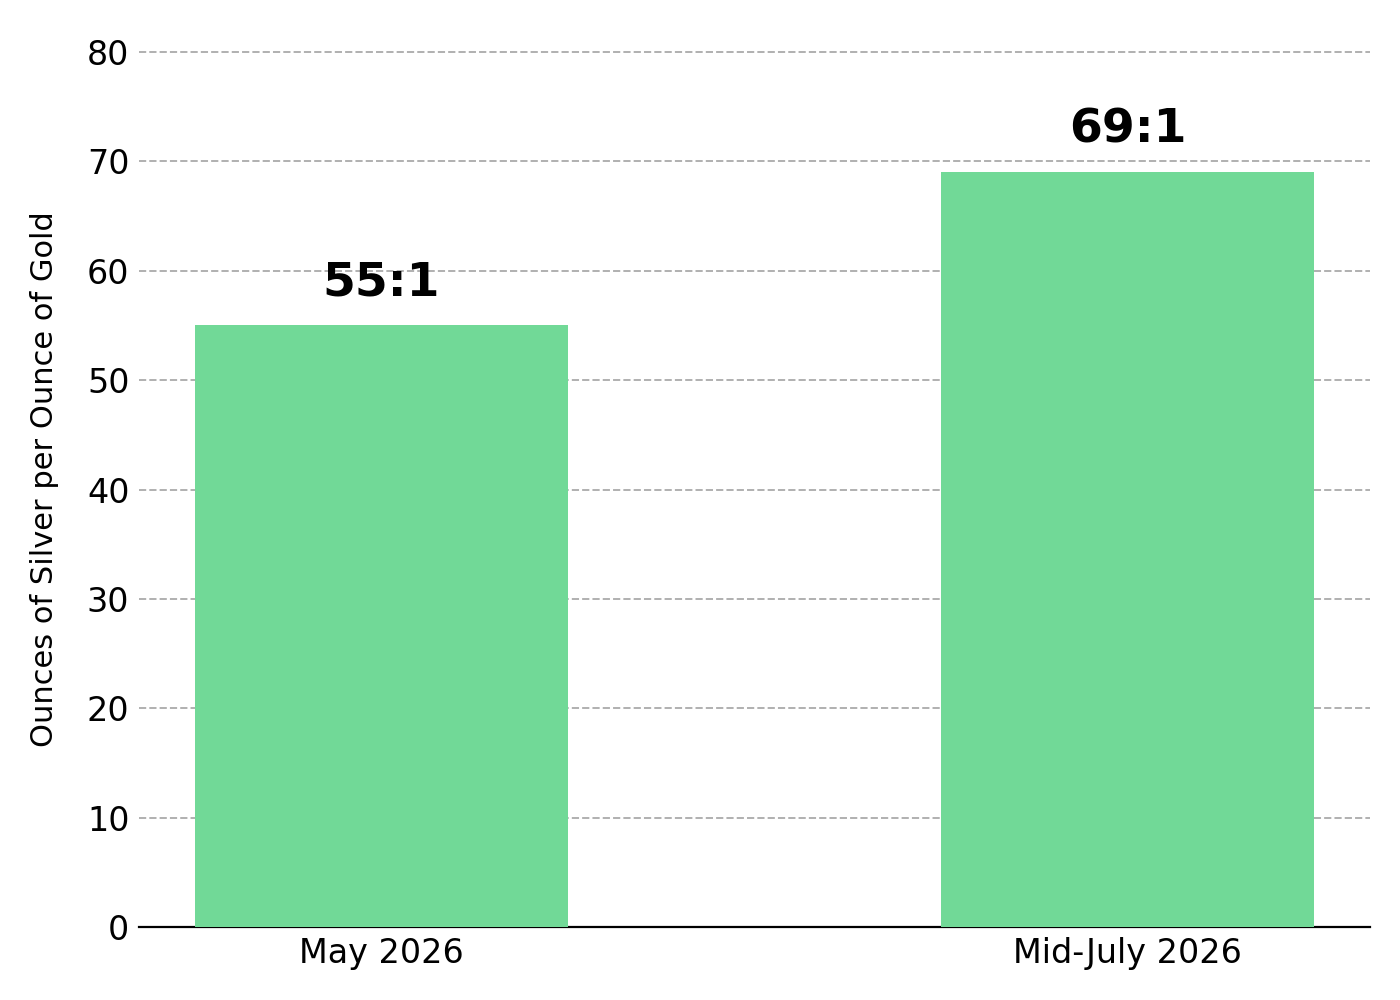
The Fed held its policy rate at 3.50% to 3.75% in June, while the accompanying dot plot shifted toward the possibility of a 2026 rate hike instead of a cut. Higher real yields increase the opportunity cost of holding non-yielding assets, and silver has absorbed that repricing more sharply than gold. The gold-silver ratio widened from 55:1 in May to about 69:1 in mid-July, showing that Fed rate expectations are outweighing the physical deficit in silver pricing.
Gregory Shearer, Head of Base and Precious Metals Strategy at J.P. Morgan Global Research, says a 1% to 2% decline in gold can translate into a 10% to 15% decline in silver because silver lacks the central bank demand that supports gold prices. The July 28-29 FOMC meeting is the next key catalyst for silver prices. The CME FedWatch Tool assigns roughly an 89% probability to rates remaining unchanged, suggesting the decision itself is already priced in. Instead, the post-meeting guidance is likely to drive silver's next price move.
A Widening Deficit & Byproduct Supply Constraints Increase the Value of Primary Silver Producers
The Silver Institute's World Silver Survey 2026 estimates a 46.3-million-ounce deficit in 2026, up 15% from the 40.3-million-ounce shortfall in 2025 and marking the sixth consecutive year that global demand has exceeded combined mined and recycled supply. The market has drawn down 762.1 million ounces from above-ground inventories since 2021, reducing the buffer available to offset future supply deficits.
Supply, not demand, remains the market's primary constraint. Global mine production remained roughly flat at 844.1 million ounces in 2026 despite a 42% average price increase in 2025 because about 74% of silver is produced as a byproduct of copper, lead, and zinc mining. Output from those mines responds to base metal economics rather than silver prices, preventing supply from expanding quickly even when silver prices rise.
Mine Upgrades & Primary Silver Supply Growth Strengthen Production Leverage
Americas Gold & Silver, which operates the Galena Complex in Idaho's Silver Valley, demonstrates how primary silver producers can expand output despite persistent market deficits. Phase 2 upgrades to the mine's No. 3 Shaft increased average hoisting rates from 42 to 85 short tonnes per hour, expanding total hoisting capacity by 150% and removing the mine's main production bottleneck. The operation also adopted mechanized long-hole stoping, increasing underground productivity by more than 300%.
Oliver Turner, Executive Vice President of Corporate Development at Americas Gold & Silver, explains why primary silver producers matter:
"Seventy percent of silver is a byproduct from other mines, a significant portion of that being copper mines. You can't just turn on more silver supply when the world needs it, which means the primary silver producers such as ourselves are producing an increasingly critical, now on the US critical minerals list, increasingly scarce metal."
China's Export Licensing Regime & Tighter Ex-China Supply Increase the Value of International Silver Production
China's silver export licensing framework took effect on January 1, 2026, replacing the previous quota system with a whitelist of just 44 approved exporters. The policy restricts an estimated 60% to 70% of globally refined silver from export markets, increasing the importance of internationally traded supply from other producing countries.
China's export licensing framework changes price discovery outside its domestic market. By restricting much of China's refined silver from export markets, the policy means the Silver Institute's 46.3-million-ounce deficit understates the supply available to buyers and manufacturers outside China. Less silver is available to international buyers even as the headline deficit remains unchanged, concentrating pricing pressure on the remaining internationally traded supply.
This dynamic makes supply from Mexico and Peru increasingly important as both countries face their own production risks. Peru's Emergency Decree No. 003-2026, issued on May 11 to address a nationwide energy shortage, together with ongoing road blockades disrupting concentrate shipments from mines to ports, highlights how quickly supply outside China can tighten.
Rising Jurisdictional Risk & Strategic Silver Supply Increase Project Risk Premiums
Peru supplies approximately half of China's imported silver-bearing concentrate, so disruptions there can constrain Chinese refining capacity in addition to reducing Peruvian mine supply. About 75% of Peru's silver projects are operated by small and mid-sized companies with limited capacity to absorb higher energy costs, increasing the risk of further disruptions to global silver supply.
Unlike Peru, Mexico's primary risk comes from rising operating and financing costs rather than energy supply. Vizsla Silver, which is developing the Panuco silver-gold project in Sinaloa, faced escalating cartel extortion before ten workers were kidnapped. The incident triggered a 50% decline in the company's share price, showing how jurisdictional risk can reprice development-stage silver assets even when project economics remain unchanged.
Major Equipment Procurement & Phased Development Reduce Execution Risk
Despite the sharp decline in its share price, Vizsla continued advancing the Panuco project toward construction. In June 2026, the company awarded FLSmidth a major process plant equipment contract covering eight plant packages, with engineering already underway under a limited notice to proceed.
Simon Cmrlec, Chief Operating Officer of Vizsla Silver, described the milestone in the context of the project's phased build:
"The award of this major equipment package to FLS represents a key procurement milestone for the Panuco Project. It supports both the initial Phase 1 plant design and future Phase 2 expansion plans while remaining in line with the process plant capital budget outlined in the Feasibility Study."
Development-Stage Projects Remain Economic Despite a Lower Silver Price Deck
Panuco's November 2025 Feasibility Study uses base-case prices of $35.50 per ounce for silver and $3,100 per ounce for gold, both below current spot prices. Using those assumptions, the study estimates an after-tax net present value of US$1.8 billion at a 5% discount rate, a 111% internal rate of return, and a seven-month capital payback. The initial 9.4-year mine plan is expected to produce 17.4 million silver-equivalent ounces annually.
Even after the 52% correction from January's high, spot silver near $56 to $57 per ounce remains well above the study's $35.50 per ounce base case. That margin provides a buffer against further price declines but does not guarantee the project's economics until financing, permitting, and construction are complete. No production decision has been made for Panuco. Construction will proceed only after engineering is completed, financing is secured, and all required permits and approvals are received.
Persistent Silver Deficits Increase the Value of Junior Exploration Success
GR Silver Mining offers the greatest exploration upside among the three companies profiled here. As an exploration-stage company advancing the 78-square-kilometer Plomosas Project in Sinaloa, it has not yet published a feasibility study, net present value, or internal rate of return. Instead, the company is directing its capital toward resource definition ahead of an updated Mineral Resource Estimate and a Preliminary Economic Assessment expected within the next six to twelve months.
Resource Expansion Drilling & Leadership Continuity Support Project Advancement
July 2026 drilling at the San Marcial SE Extension intersected 21.9 metres true width grading 168 grams per tonne silver and 1.41% zinc, confirming that mineralization extends at least 150 metres beyond the existing 2023 Mineral Resource Estimate. The result supports resource growth ahead of the updated Mineral Resource Estimate and Preliminary Economic Assessment, a key value driver for an exploration-stage company.
The company also experienced a leadership transition during the period. Eric Zaunscherb was appointed President and Chief Executive Officer on July 6, 2026, following the passing of founder Marcio Fonseca. Having previously served as Chief Executive Officer from February 2022 to June 2025, he provides continuity as the company advances its exploration program.
Eric Zaunscherb, President and Chief Executive Officer, discusses recent exploration results:
"The results from two new resource expansion areas at San Marcial demonstrate the continued effectiveness of our 20,000-metre drilling program and reinforce our confidence in the exploration potential of both the Southeastern Extension and the Parallel Breccia. As the program advances, new data will allow us to follow up on higher-grade features like the dilation zone intersected in Hole SMS26-04, which returned 45.1 metres estimated true width at 1,623 grams per tonne silver."
Silver's Physical Deficit & the Fed Rate Path: Which Will Drive Prices Next?
The same imbalance remains evident across the silver market: a physical deficit that has widened for six straight years, a byproduct-dependent supply base that cannot quickly respond to higher prices, China's export licensing regime restricting internationally traded supply, and growing jurisdictional risks in Mexico and Peru. Despite those supply constraints, spot silver remains about 52% below its January high. Instead, expectations for the Federal Reserve's rate path have continued to outweigh tightening physical market fundamentals.
This dominance is inherently cyclical rather than structural. Real yields reflect Fed policy, while Fed policy evolves with incoming inflation data and market expectations at each meeting. By contrast, the deficit reflects ore grades, byproduct economics, and permitting timelines that cannot change within a single quarter. A hawkish July 28–29 FOMC statement would likely extend the disconnect between prices and physical market fundamentals. A dovish shift could reduce the influence of rate expectations, allowing the persistent physical deficit to exert greater influence on silver prices.
The Investment Thesis for Silver
- Because roughly 74% of global silver mine supply is produced as a byproduct, primary silver producers that have already invested in mine and processing infrastructure are positioned to benefit more directly from higher silver prices.
- Development-stage projects built on conservative feasibility assumptions continue to benefit from spot prices well above their base-case forecasts, although realizing those economics still depends on permitting, financing, and successful project execution.
- Export licensing regimes that restrict refined metal from international markets increase the strategic value of production and development assets in politically stable jurisdictions without similar export restrictions.
- The evidence suggests that jurisdictional risk in leading producing nations has become a material financing cost and valuation factor, warranting the same scrutiny as resource quality, project economics, and capital intensity.
- Unlike development and producing assets, exploration-stage companies are not yet valued on fixed commodity price assumptions or operating economics. That gives them the greatest upside potential if exploration succeeds, but also the least downside protection if it does not.
- The expected path of interest rates, rather than the physical market deficit, remains the dominant near-term driver of silver prices across exploration, development, and production assets.
Silver's physical market has continued to tighten this year, with the deficit widening for a sixth consecutive year even as prices remain about 52% below January's high. That disconnect reflects expectations for the Federal Reserve's policy path rather than an easing of physical supply constraints. The July 28-29 FOMC meeting will provide the next major test of whether monetary policy expectations continue to outweigh tightening market fundamentals.
TL;DR
Silver remains about 52% below its January high despite recording a sixth consecutive annual market deficit, highlighting a disconnect between physical fundamentals and price performance. Fed rate expectations continue to outweigh tightening supply conditions, making the July FOMC meeting the next key catalyst for prices. Structural constraints, including byproduct-dependent mine supply, China's export licensing regime, and rising jurisdictional risks in Mexico and Peru, reinforce the long-term investment case for primary producers, development-stage projects, and exploration companies, although each segment faces distinct risks and opportunities.
FAQs (AI-Generated)
Analyst's Notes





Subscribe to Our Channel








.png)



.png)
Stay Informed






