Strong Central Bank Demand & Gold Price Weakness Create a Valuation Gap in Gold Equities


Gold prices corrected after rising rate expectations, but central bank buying, investment demand, and strong producer margins continue to support gold equities.
- The People's Bank of China added 320,000 troy ounces of gold in May 2026, extending its buying streak to 19 months, the longest in at least a decade, even as spot gold fell to approximately $4,315 per ounce.
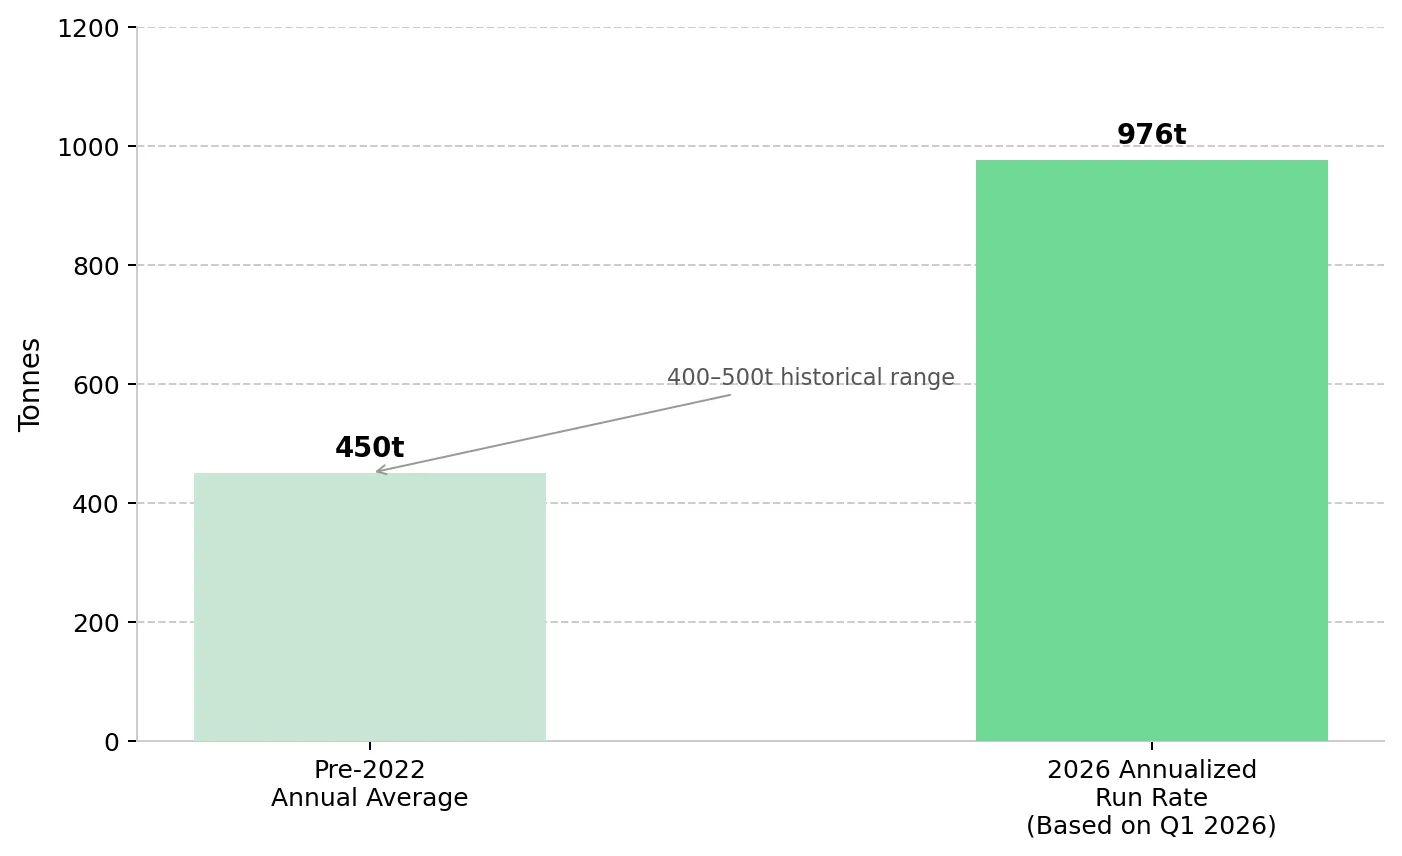
- The World Gold Council reported 244 tonnes of net central bank purchases in Q1 2026, equivalent to an annualized pace of 976 tonnes versus 400 to 500 tonnes annually before 2022.
- Spot gold erased all year-to-date gains after the May nonfarm payrolls report showed 172,000 jobs added, driving CME FedWatch Tool pricing for a December 2026 rate hike to 70%.
- Physical investment surpassed jewelry as gold's primary demand category for the first time in 2026, making gold demand more sensitive to inflation expectations, real yields, and geopolitical risk.
- Gold producers with fully funded operations and near-term production growth are generating strong operating margins at current spot prices, while declining stripping and ramp-up costs could increase margins further.
Higher Rate Expectations Weigh on Gold Prices While Central Banks Keep Buying
Spot gold fell as much as 3.5% to approximately $4,315 per ounce after the May nonfarm payrolls report increased expectations for higher interest rates, but central bank demand remained strong. US employers added 172,000 jobs in May, nearly double the consensus estimate of 85,000, while revisions added 93,000 jobs to March and April payrolls. CME FedWatch Tool pricing for a December 2026 rate hike rose from 45% to 70% during the week, while Goldman Sachs withdrew its 2026 rate-cut forecast and BNP Paribas adopted a rate-hike base case.
Central bank gold purchases continued despite the price decline. The People's Bank of China extended its gold-buying streak to 19 consecutive months through May 2026, adding 320,000 troy ounces as spot gold traded near $4,315 per ounce. Net central bank purchases totaled 244 tonnes in Q1 2026, equivalent to an annualized pace of 976 tonnes versus 400 to 500 tonnes annually before 2022. Central bank purchases are driven by reserve management, de-dollarisation policies, and portfolio diversification objectives rather than short-term economic data.
The current correction reflects higher rate expectations rather than weaker gold demand. Gold equity valuations have fallen with the gold price even as central bank demand remains strong. Producers with AISCs below current spot prices continue to generate substantial operating margins at gold prices above $4,000 per ounce.
Investment Demand Overtakes Jewelry as Gold's Primary Buyer Base
Physical investment surpassed jewelry fabrication as gold's largest source of demand for the first time in 2026. The shift reflects stronger investment demand rather than lower jewelry consumption alone. A larger share of gold demand now comes from investors responding to inflation expectations, interest rates, and geopolitical risk.
Investment Demand Makes Gold More Sensitive to Macro Risks
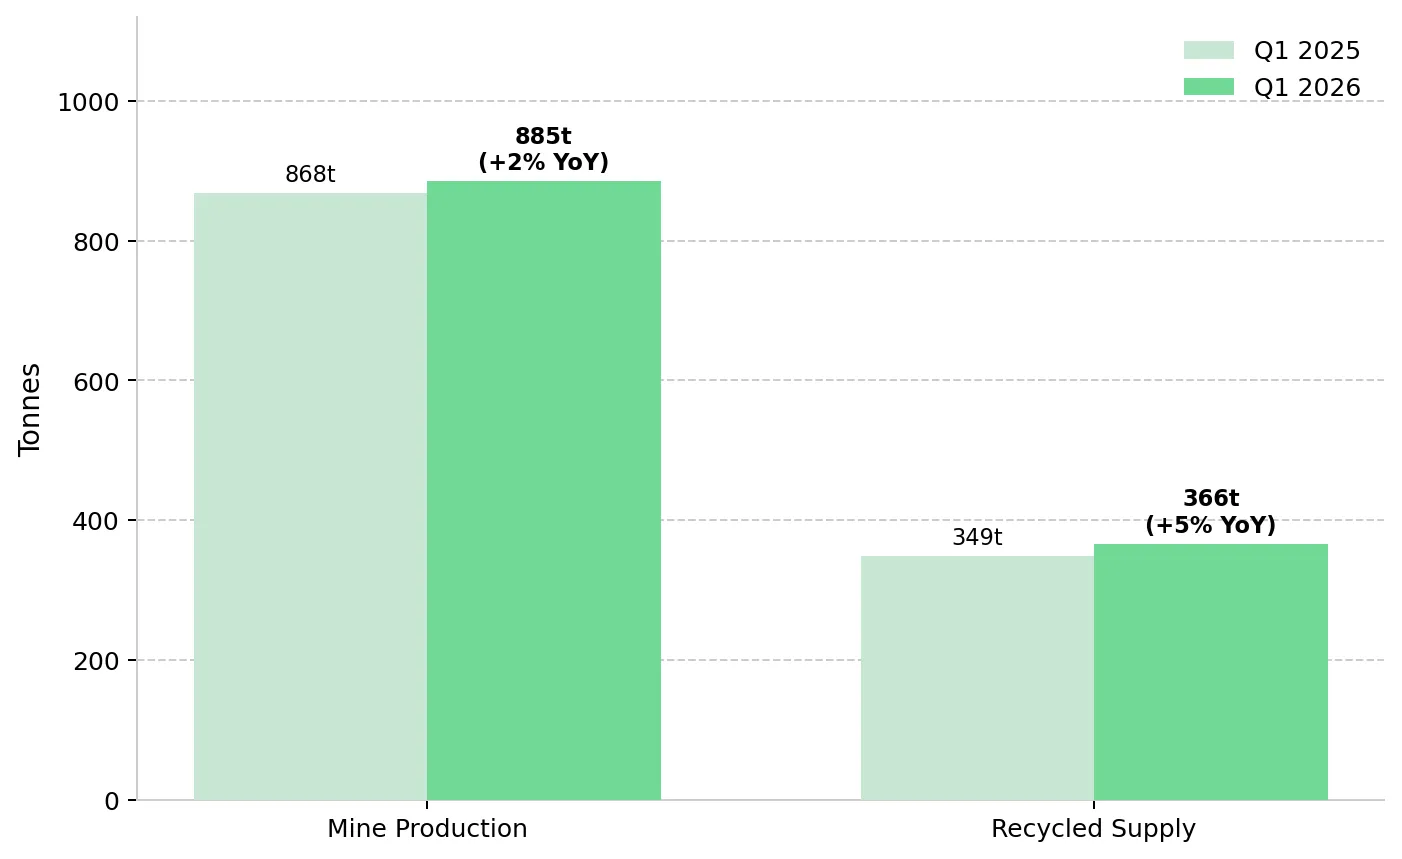
Jewelry demand in India and China is driven primarily by cultural and ceremonial purchases rather than short-term price movements. Investment demand is driven by macroeconomic and portfolio-allocation decisions. Investors buy gold to hedge inflation, manage currency risk, and diversify equity and bond portfolios. As investment demand increases, gold prices become more sensitive to real yields, currency movements, and geopolitical risk. Q1 2026 mine production rose 2% year-on-year to 885 tonnes, while recycled supply increased 5% to 366 tonnes. Mine supply growth remains limited as longer permitting timelines and higher project costs constrain new production.
ETF Selling Accelerates as Central Bank Demand Holds Firm
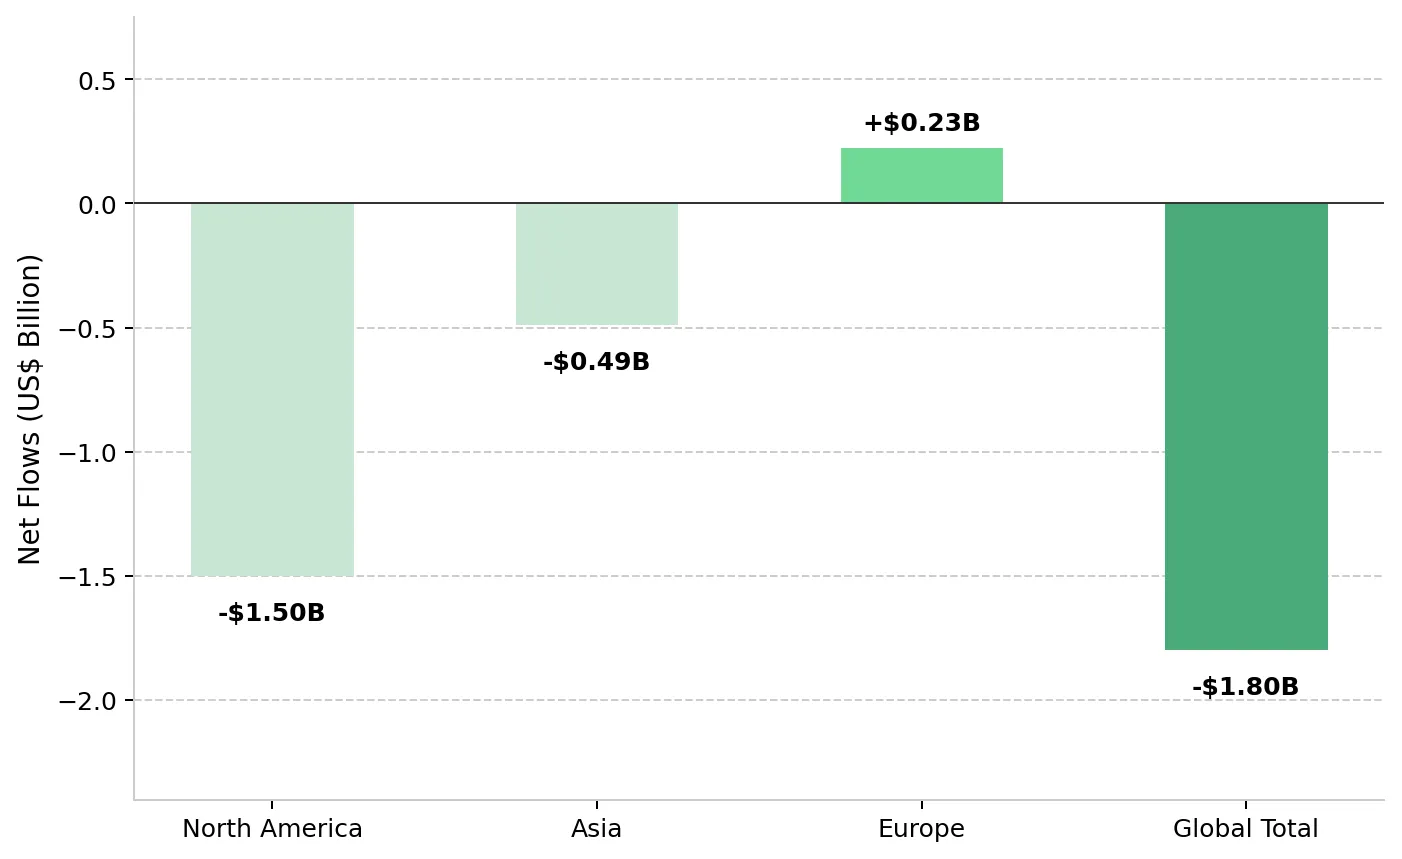
Western gold ETFs recorded net outflows of US$1.8 billion in May 2026, including US$1.5 billion from North American funds. ETF investors typically hold positions for weeks or months rather than years, making ETF flows more sensitive to changes in interest-rate expectations. ETF outflows typically accelerate when real yields rise and reverse when investors anticipate lower interest rates. Continued central bank buying can offset ETF outflows and support gold prices during periods of weaker investor sentiment.
Gold Prices Above US$4,300 Continue to Support Producer Margins
With spot gold above $4,300 per ounce, producers with AISCs of US$1,800 to US$3,000 per ounce continue to generate substantial margins. The decline from January's high near US$5,600 per ounce has reduced revenue per ounce, but producers with low costs and growing production remain highly profitable.
Waste Stripping Today Targets Lower Costs & Higher Production
Integra Resources shows how temporary cost increases can coexist with strong cash generation and planned cost reductions. The company generated US$24.9 million in mine operating earnings on a 40% operating margin in Q1 2026, with revenue of US$61.7 million from 12,518 ounces sold at an average realized price of US$4,854 per ounce. Cash costs of US$2,422 per ounce and mine-site AISC of US$3,310 per ounce reflected waste stripping to access higher-grade ore in the central pit. Management said waste stripping is expected to decline after 2026, reducing mining costs and improving margins.
George Salamis, President and Chief Executive Officer of Integra Resources, explains how current stripping activity is expected to lower costs and increase production in future years:
"What's driving AISC now is essentially the stripping campaigns that we have to get through that are occurring ahead of accessing ore on the central pit, which is one of the largest ore bodies at Florida Canyon. Once we get through that stripping in 2026, we're into much lower stripping, presumably much lower costs because of that reduced stripping rate."
Production Growth Could Lower Costs & Drive a Market Rerating
Newly commissioned mines often report elevated costs during their first quarters of commercial production as fixed operating expenses are spread across lower production volumes. As throughput increases and mining advances into additional production areas, unit costs can decline while margins improve. Production growth can therefore become an important catalyst for both earnings growth and valuation expansion.
West Red Lake Gold Mines delivered a 37% operating margin in Q1 2026, with C$41.8 million in revenue and C$14.4 million in adjusted EBITDA from 6,165 ounces sold at an average realized price of US$4,938 per ounce. AISC of US$4,678 per ounce reflects fixed-cost absorption during the early stages of mine ramp-up. Approximately 60% of the company's 2026 production guidance of 40,000 to 50,000 ounces is scheduled for the second half of the year as mining expands into new production areas.
Shane Williams, President and Chief Executive Officer of West Red Lake Gold Mines, explains why mine ramp-ups require a disciplined approach:
"People try to rush ramp-ups. It's important to be slow and steady because when you go into production, it's operational readiness…Your systems, your procedures, your people... All those systems have to be built."
Strong Cash Flow Trades at a Discount to Peer Valuations
Some gold producers trade at valuations that do not reflect their earnings and cash flow, particularly smaller companies with strong operating performance and balance sheets. Rising gold prices have increased cash generation across the sector, but valuation multiples have not expanded at the same pace for every producer. Companies that continue to generate strong margins, free cash flow, and net cash positions can trade below peer averages despite improving financial results.
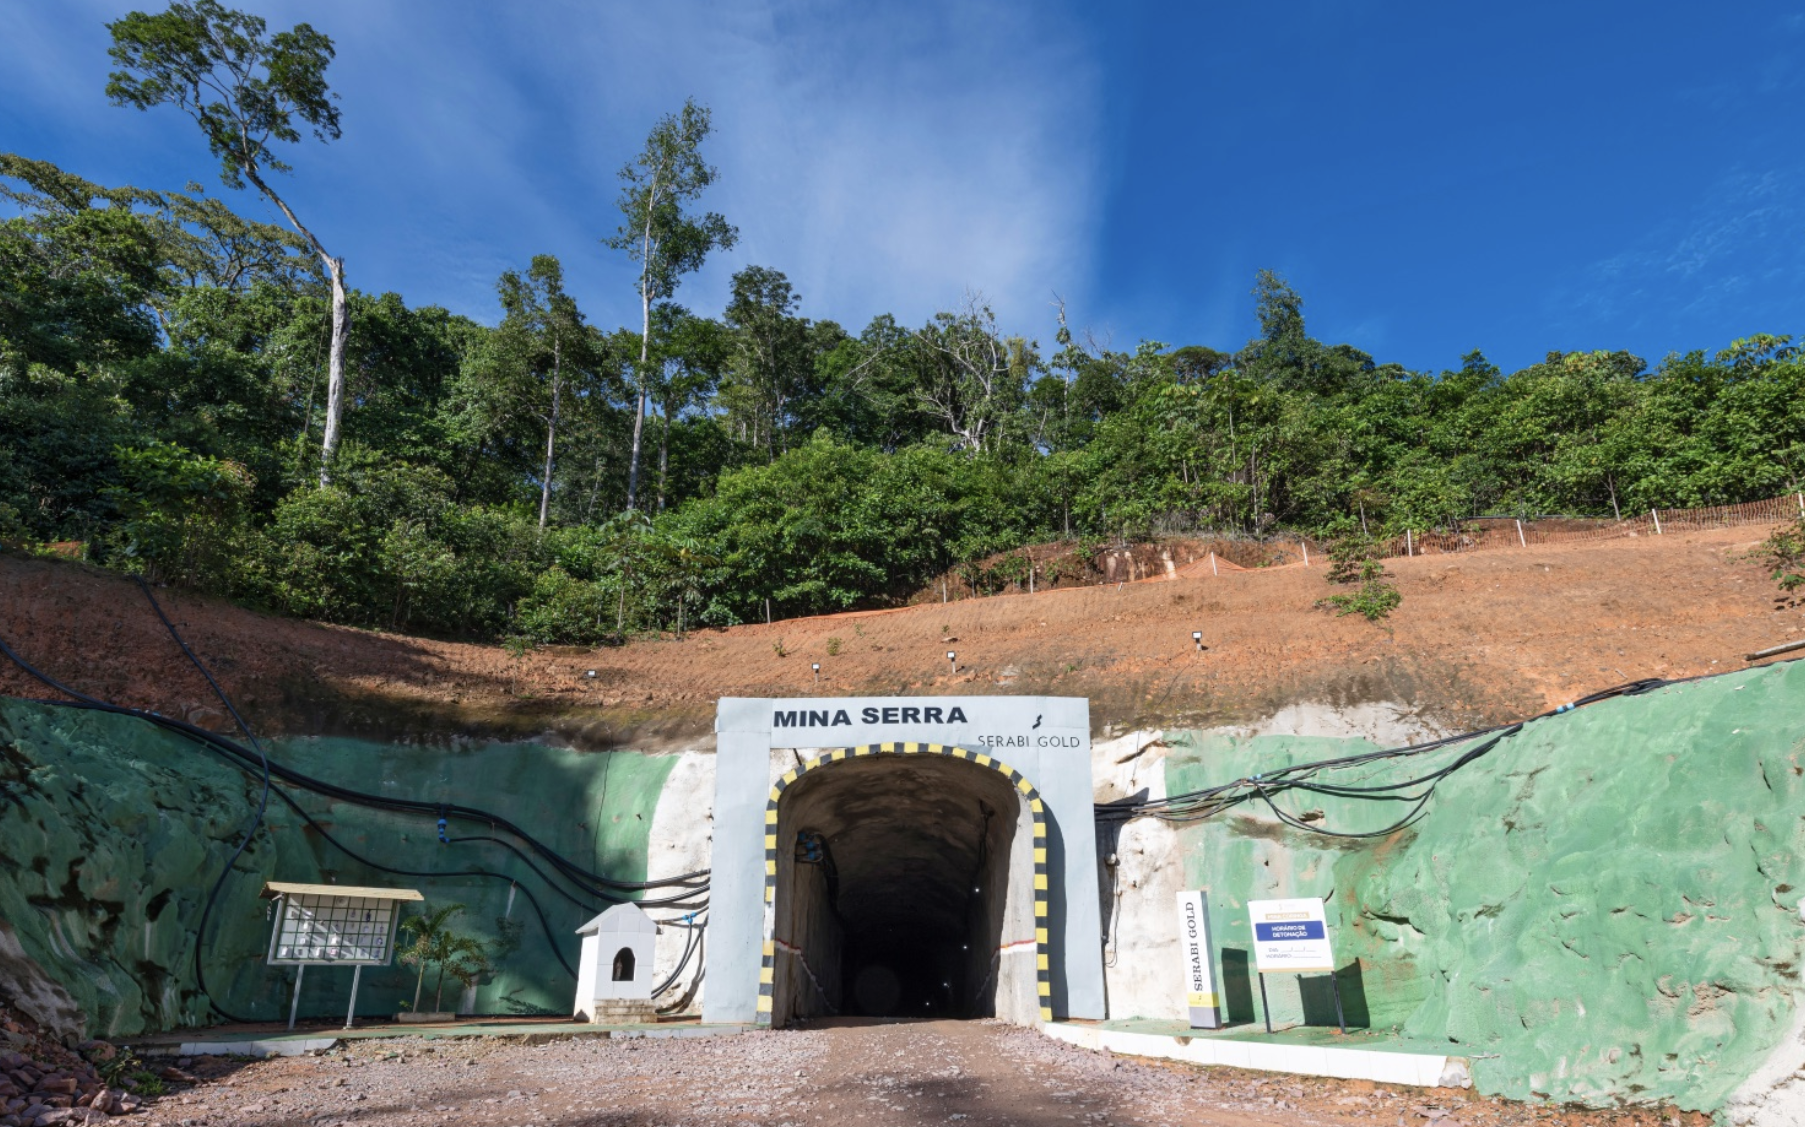
Serabi Gold trades at 1.9x EV/EBITDA versus a peer average of 3.5x and at a 26% free cash flow yield versus a peer average of 14%. The company holds US$64.4 million in cash and no debt. In Q1 2026, the company generated US$50.6 million in revenue, US$29.2 million in EBITDA, and US$21.0 million in post-tax profit. Full-year 2025 AISC was US$1,816 per ounce.
Mike Hodgson, Chief Executive Officer of Serabi Gold, outlines the company's free cash flow outlook at current gold prices:
"We'll probably be doing somewhere between $80 million and $100 million of free cash flow this year. Even with those things on top of the AISC, we're probably at a $2,000 margin. Times 55,000 oz, or 53,000 oz at the lower end of guidance, we should be looking at $80 million, $90 million, $100 million."
Royalty & Debt Capital Continue to Back Gold Projects
Royalty companies and lenders continue to provide funding for gold projects after completing technical and financial due diligence. These financing decisions are based on long-term assessments of project economics, operating risks, and expected commodity prices rather than short-term movements in spot gold. Continued access to large-scale financing indicates that institutional capital remains willing to fund projects with competitive cost profiles and clear paths to production.
i-80 Gold raised more than US$1 billion in Q1 2026 through a US$250 million net smelter return royalty, a US$150 million gold prepayment facility, and US$287.5 million in convertible senior notes. Cash and cash equivalents totaled US$513.5 million at March 31, 2026, fully funding Phase 1 and Phase 2 of the development plan.
Paul Chawrun, Chief Operating Officer of i-80 Gold, explains why institutional investors participated in the company's recent financing:
"We have first-rate institutions that have been able to provide us with the confidence to put this together. We went through comprehensive due diligence. We had a competitive process as well. There were a lot of interested parties to be part of this story."
Higher Fed Rate Expectations Pressure Gold, but Price Targets Remain Elevated
The May jobs report increased expectations that the Fed will keep interest rates higher for longer. For gold, higher-for-longer interest rates and energy-driven inflation support higher real yields, reducing the appeal of non-yielding assets. Goldman Sachs maintains a year-end 2026 gold price target of US$5,400 per ounce based on continued central bank demand. J.P. Morgan lowered its 2026 average gold price forecast to US$5,243 per ounce but continues to project prices of US$4,900 to US$5,100 per ounce as geopolitical risks moderate.
Gold producers with AISCs well below spot prices can generate strong cash flow whether gold trades at $4,300 or $4,900 per ounce. At current gold prices, many producers continue to generate substantial operating margins. The correction has reduced equity valuations without significantly changing earnings forecasts.
The Investment Thesis for Gold
- Central bank demand remains strong despite higher interest-rate expectations, with the PBOC extending its gold-buying streak to 19 months and net central bank purchases totaling 244 tonnes in Q1 2026. Continued reserve diversification supports gold demand.
- Physical investment demand surpassed jewelry fabrication as gold's largest demand category in 2026, making gold demand more sensitive to inflation expectations, interest rates, and geopolitical risk.
- Mine supply growth remains limited despite gold prices above US$4,300 per ounce, with Q1 2026 production rising only 2% year-on-year. Longer permitting timelines and higher project costs continue to constrain new mine development.
- Producers with AISCs well below current spot prices continue to generate substantial operating margins. Margins could increase further as waste-stripping campaigns and mine ramp-up costs decline.
- More than US$1 billion of recent project financing shows that royalty companies and lenders continue to fund gold development projects despite higher interest-rate expectations and lower gold prices.
A May nonfarm payrolls report showing 172,000 jobs added increased expectations for higher interest rates, strengthened the US dollar, and erased gold's year-to-date gains. The PBOC has extended its gold-buying streak to 19 months. Physical investment demand surpassed jewelry fabrication as gold's largest demand category in 2026. Mine production rose only 2% year-on-year in Q1 2026 as permitting timelines and project costs limited supply growth. Royalty companies and lenders continue to fund gold development projects, including more than US$1 billion raised by i-80 Gold in Q1 2026. Several producers discussed in this article trade at valuations that remain below peer averages despite strong margins, cash flow, and balance sheets.
TL;DR
A May US jobs report increased expectations for higher interest rates and pushed gold prices lower, but underlying demand remained strong. The People's Bank of China extended its gold-buying streak to 19 months, while net central bank purchases reached 244 tonnes in Q1 2026. Physical investment surpassed jewelry as gold's largest demand category, increasing gold's sensitivity to macroeconomic factors such as inflation, interest rates, and geopolitical risk. Mine supply growth remains limited, producer margins remain strong at current gold prices, and royalty companies and lenders continue to fund gold projects. Several gold producers continue to trade at valuations below peer averages despite strong cash flow, profitability, and balance sheets.
FAQs (AI-Generated)
Analyst's Notes


Subscribe to Our Channel


Stay Informed