

US Inflation at a Three-Year High & Fed Rate Holds Pressure Silver Prices as Supply Deficits Reach 762 Moz


US inflation at a three-year high pressured silver prices to $74/oz even as six consecutive supply deficits pushed cumulative shortages to 762 Moz.
- April 2026 CPI reached 3.8% year-over-year, the highest since May 2023, with energy prices rising 17.9% annually, pushing the CME FedWatch tool to price zero Fed rate cuts for 2026 and increasing the real carry cost of silver as a non-yielding asset.
- The US Senate confirmed Kevin Warsh as Fed Chair on May 12, 2026, reinforcing expectations that interest rates will remain elevated and making the June 16-17 Federal Open Market Committee dot plot the key scheduled catalyst for silver’s rate-sensitive pricing in Q2 2026.
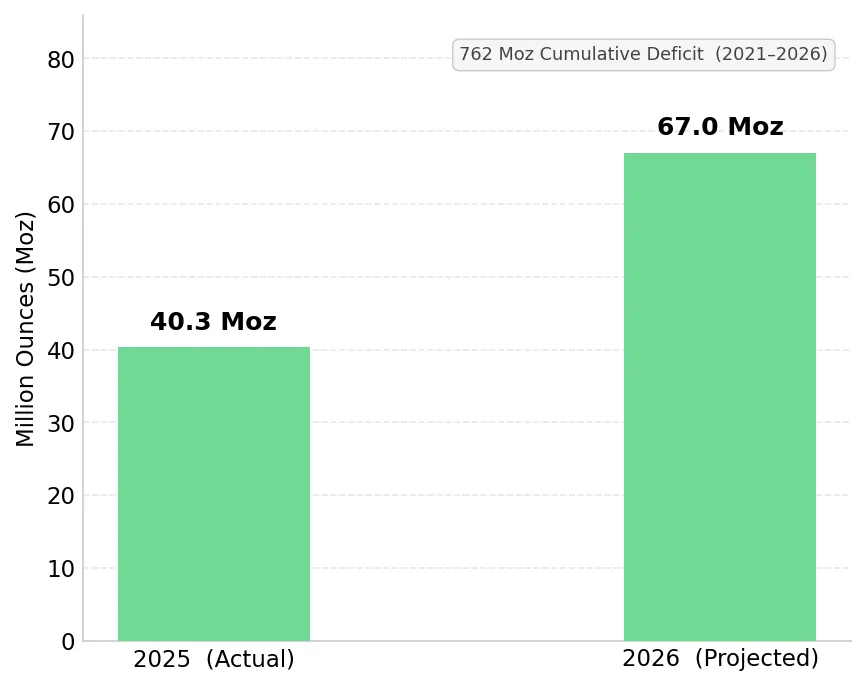
- The Silver Institute’s World Silver Survey 2026 projects a sixth consecutive annual supply deficit in 2026 at 67 million ounces, as 1.5% mine supply growth and recycling of 197.6 million ounces remain insufficient to meet fabrication and investment demand.
- Physical investment demand is projected to rise 20% to 227 million ounces in 2026, a three-year high, as India resumed silver bullion imports in May 2026 after a month-long suspension, adding near-term demand to a market already in supply deficit.
- At $74/oz silver, producing mines with sub-$35/oz all-in sustaining costs generate strong operating margins, feasibility-stage projects gain net present value upside over published base-case assumptions, and high-grade exploration programs improve discovery economics ahead of the June 16-17 Federal Open Market Committee decision.
Elevated Fed Rates & Near-Term Pressure on Silver Prices
Silver’s spot price fell from $86.73/oz to $74.96/oz, a 13.6% decline in six trading sessions driven by tighter Fed rate expectations rather than any improvement in the physical supply-demand balance, which the Silver Institute still projects in deficit.
The 3.8% CPI Print & the Collapse in 2026 Fed Rate-Cut Expectations
The Bureau of Labor Statistics reported April 2026 CPI at 3.8% year-over-year on May 12, the highest reading since May 2023, as energy prices rose 17.9% annually, the fastest increase since September 2022. Core CPI reached 2.8% year-over-year, remaining above the Fed’s 2% inflation target. After cutting the federal funds rate to 3.50%-3.75% in 2025 and holding that range for three consecutive meetings, the Fed now faces limited room for additional rate cuts while inflation remains above target. Following the CPI release, the CME FedWatch tool moved to price zero Fed rate cuts for 2026.
Kevin Warsh’s Confirmation & the Fed Rate Outlook for Silver
The US Senate confirmed Kevin Warsh as Fed Chair on May 12, 2026, replacing Jerome Powell and reinforcing expectations for prolonged elevated interest rates. Warsh’s support for tighter monetary policy and a smaller Fed balance sheet makes the June 16-17 Federal Open Market Committee meeting, including the first updated dot plot since March, the key scheduled catalyst for silver’s rate-sensitive pricing in Q2 2026. The updated dot plot will shape market expectations for any September 2026 rate cut.
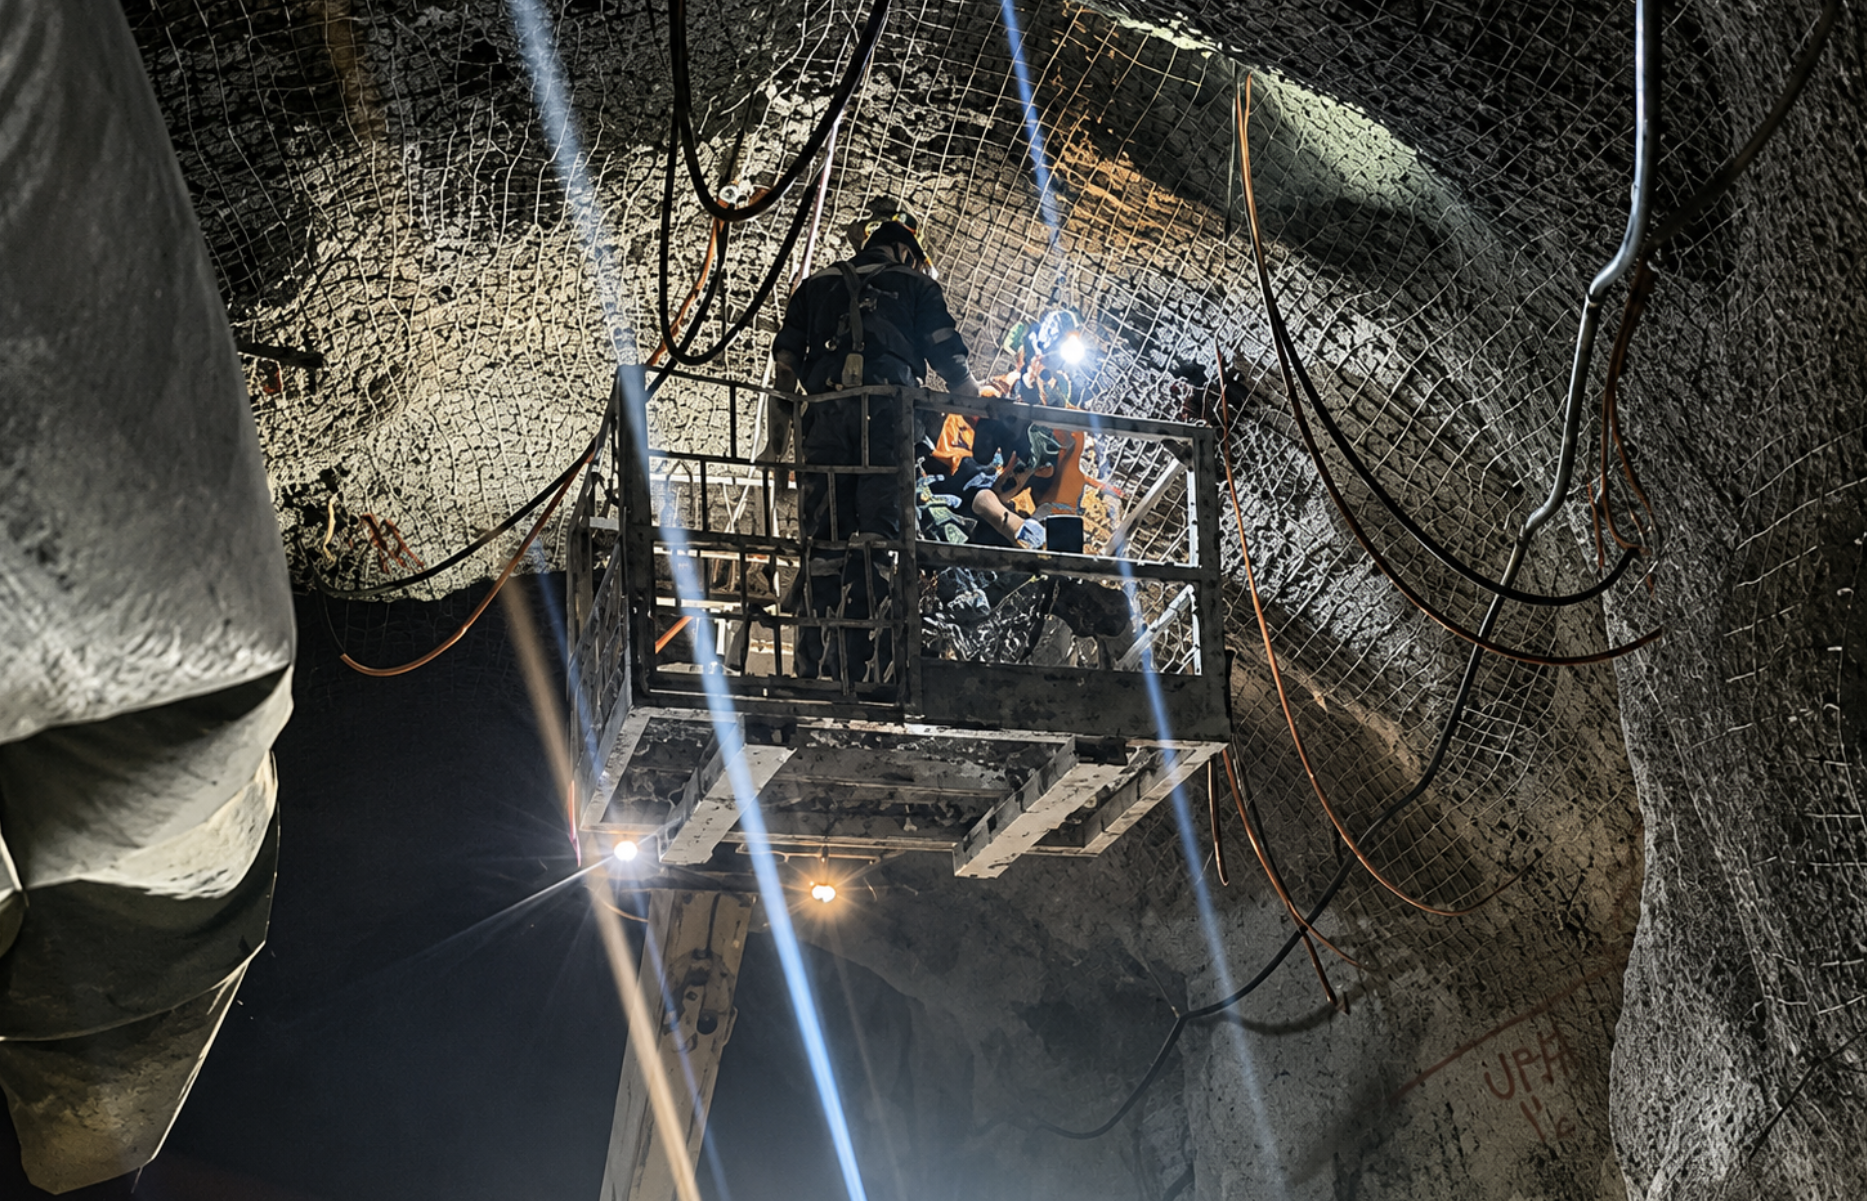
Six Consecutive Supply Deficits & Ongoing Constraints on Silver Supply
The Fed’s rate hold pressures silver prices but does not change the physical supply-demand deficit. The Silver Institute shows the supply deficit persisted through multiple Fed tightening and rate-cut cycles, indicating that physical tightness has not depended on short-term rate policy.
Six Years of Silver Deficits Across Multiple Fed Cycles
The Silver Institute reported a 40.3 million ounce deficit in 2025 and projects a sixth consecutive annual shortfall of 67 million ounces in 2026. Cumulative supply deficits now total approximately 762 million ounces, reducing available above-ground inventories across multiple market cycles. Global mine production rose 1.5% in 2026 as declining ore grades constrained output growth across Latin America, while recycling reached a 13-year high of 197.6 million ounces in 2025 but still failed to meet fabrication and investment demand. COMEX registered silver inventories fell below 100 million ounces in February 2026, a level historically associated with tighter physical supply conditions and higher price volatility.
India’s Bullion Import Restart & Rising Physical Silver Demand
Indian commercial banks resumed gold and silver bullion imports on May 12, 2026, after a month-long suspension tied to a dispute over a 3% import levy, restoring physical demand as India’s coin and bar demand rose 33% in 2025. Global physical investment demand is projected to rise 20% to 227 million ounces in 2026, a three-year high, led by India, East Asia, and the Middle East, increasing physical silver demand even as Fed policy remains restrictive
$74/oz Silver & the Different Economics of Producers, Developers and Explorers
Silver at $74/oz creates different operating and valuation outcomes across producers, developers, and exploration-stage assets. At current spot prices, producing mines with positive operating margins, development projects modeled at lower silver assumptions, and high-grade exploration programs each carry different sensitivity to further silver price changes
Americas Gold & Silver Production Growth & Positive Margins at $74/oz
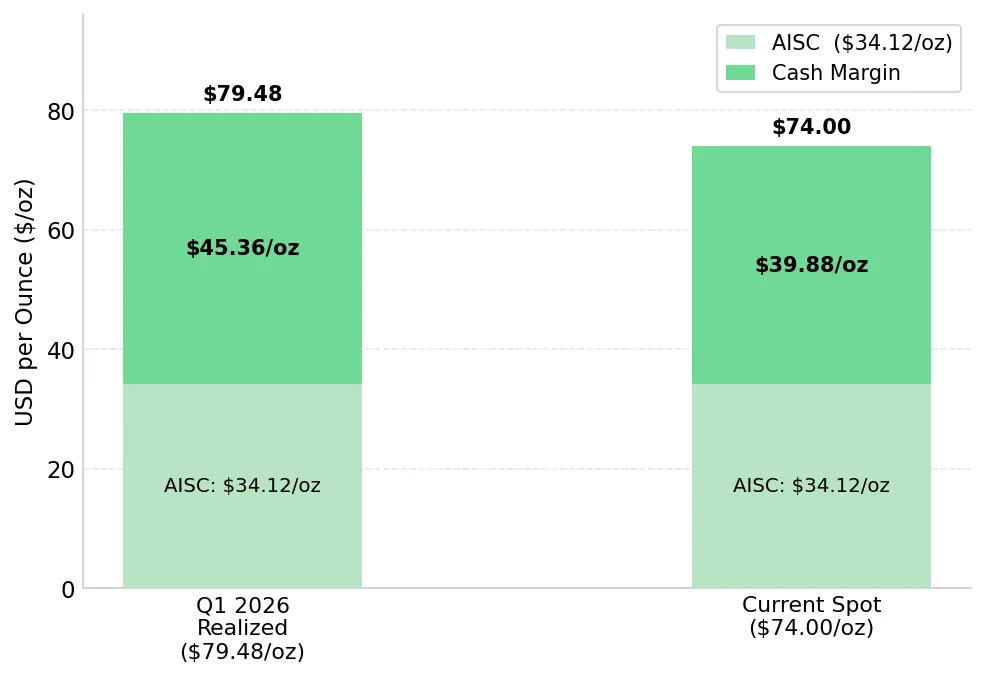
Americas Gold & Silver produced approximately 787,000 ounces of silver in Q1 2026, up 76% year-over-year, while revenue rose 187% to $67.8 million. The Galena Complex hosts more than 200 million ounces of silver at an average grade of 500 grams per tonne, while Q1 2026 all-in sustaining costs of $34.12/oz generated an operating margin of approximately $39/oz at current $74/oz silver prices. Full-year 2026 guidance targets 3.2 to 3.6 million ounces of silver production at $30 to $35/oz all-in sustaining costs, with $122.4 million in cash as of March 31, 2026 fully funding the company’s $90 million to $120 million capital program without additional equity or debt financing
Oliver Turner, Executive Vice President of Corporate Development at Americas Gold & Silver, outlines the company’s production growth strategy at the Galena Complex:
“We’re doing 410 tonnes per day right now. We’re going to exit this year at 650 tonnes per day. Over the next two years, we’ll ramp up to more than 1,000 tonnes per day.”
Vizsla Silver Feasibility Economics & Permitting Progress at Panuco
Vizsla Silver’s November 2025 Feasibility Study for the Panuco silver-gold project in Sinaloa, Mexico, outlined a 111% after-tax internal rate of return, a US$1.8 billion after-tax net present value at a 5% discount rate, a 7-month payback period, and average annual production of 17.4 million silver-equivalent ounces over a 9.4-year mine life. The study used a base-case silver price of US$35.50/oz, approximately 52% below current $74/oz spot prices, implying potential upside to the project’s published returns if current silver prices persist.
Vizsla Silver holds approximately US$445 million in cash against initial capital requirements of US$239 million. The company submitted its Manifestación de Impacto Ambiental to SEMARNAT in February 2025 and is targeting approval by mid-2026, making permitting the key requirement for a construction decision and first silver production targeted for H2 2027. Jesus Beldor, Vice President of Exploration at Vizsla Silver, describes the scale and pace of drilling completed across the Panuco project since its acquisition:
“We are very close to completing 400,000 meters in over a thousand drill holes. Last year we drilled over 37,000 meters, while in previous years we were drilling close to 100,000 meters annually.”
GR Silver Mining High-Grade Drill Results & Resource Expansion at San Marcial
GR Silver Mining reported its highest-grade drill results to date from the San Marcial deposit at the Plomosas Project in Mexico on May 19, 2026. Drill hole SMS26-04 intersected 45.1 metres true width at 1,623 grams per tonne silver, including 8.25 metres at 8,579 grams per tonne silver. The intercept extends a high-grade corridor linked to prior holes SMS25-09 and SMS22-10, supporting continuity of silver mineralization across the San Marcial system. Step-out drilling at the SE Extension continues in 2026 with resource expansion as the primary objective.
The deposit’s average true width of 22 metres across existing intersections supports lower drilling and resource expansion costs per ounce discovered. Eric Zaunscherb, Executive Chair of GR Silver Mining, describes how the deposit’s thickness and grade support rapid resource growth:
“The average in the resource at San Marcial is 22 metres thick. That’s why we can build ounces very quickly, very efficiently, and very cost effectively.”
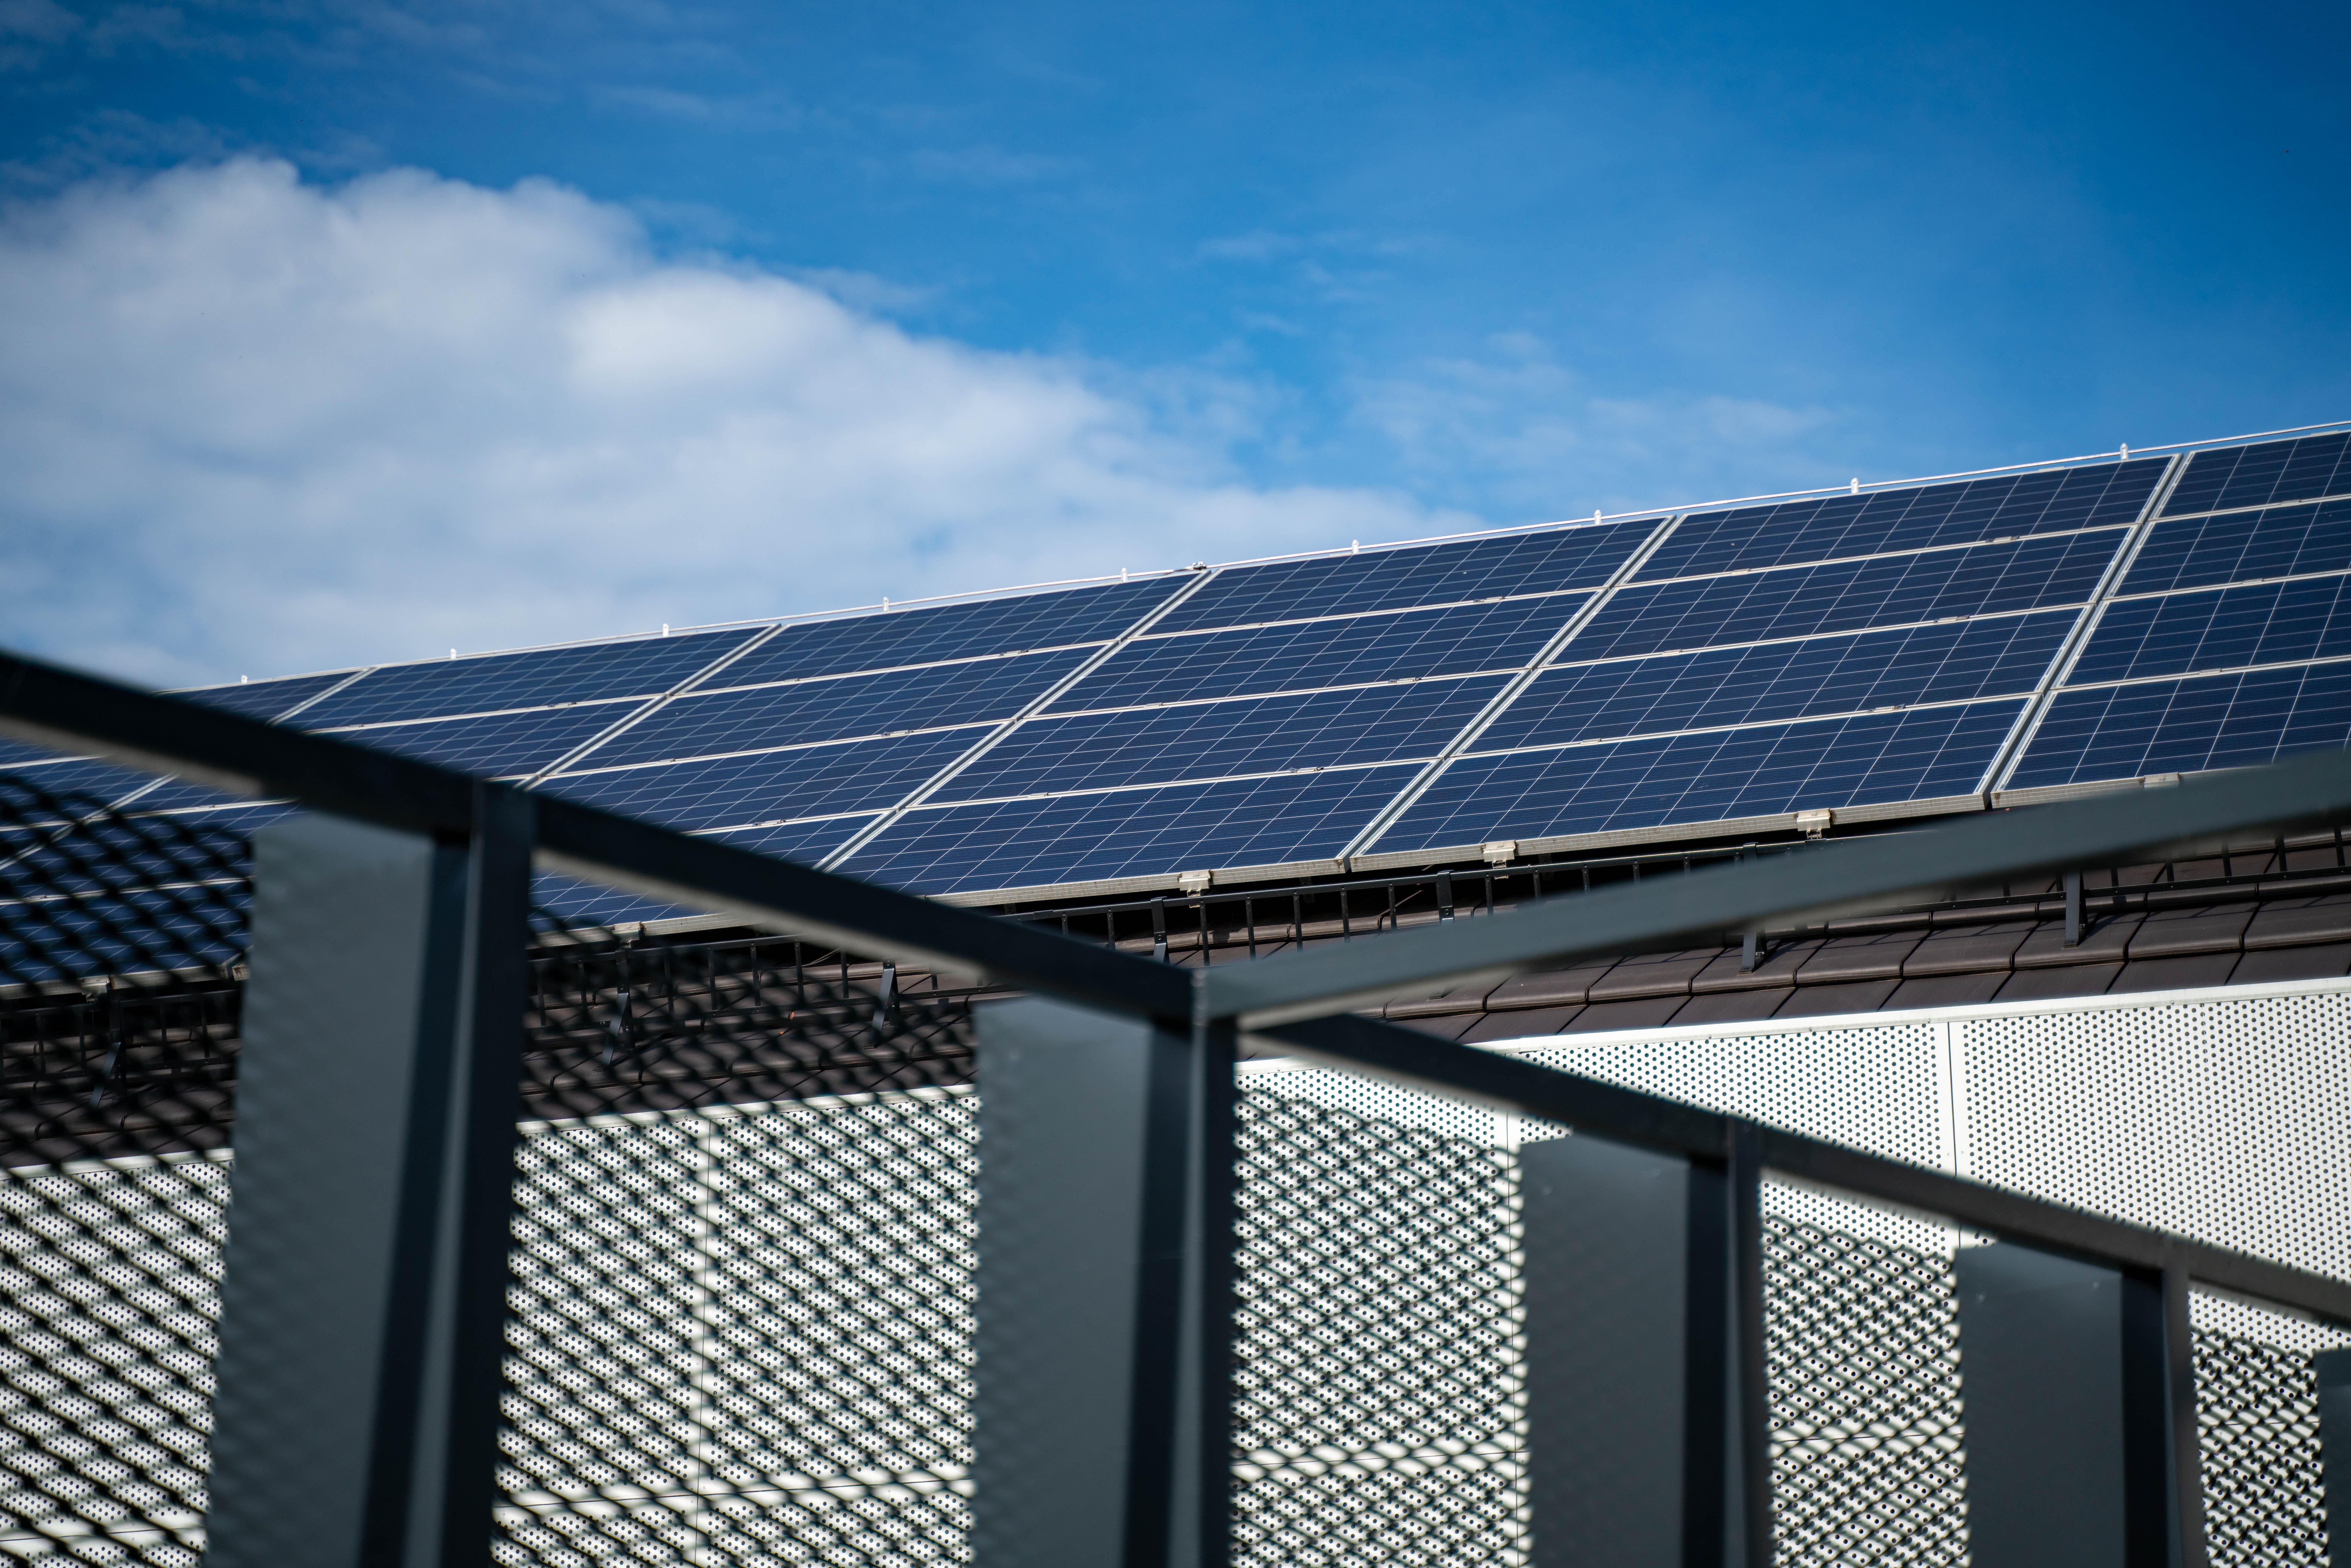
Solar Silver Thrifting & Rising Demand from Batteries & AI Infrastructure
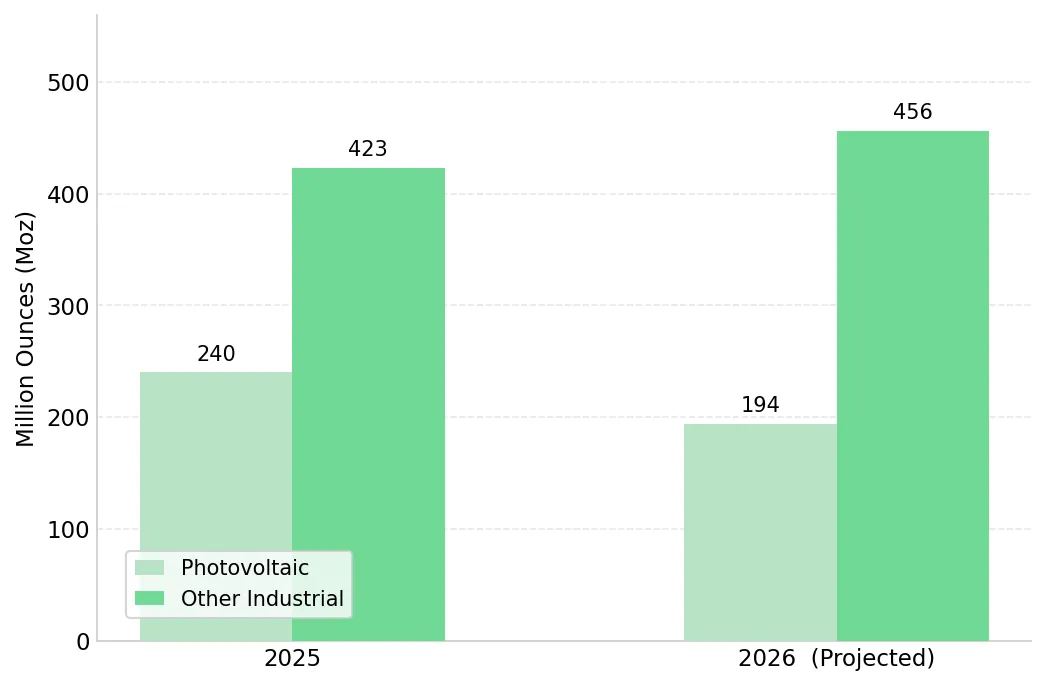
Silver’s industrial demand in 2026 is shifting away from photovoltaic manufacturing toward higher-silver-intensity applications rather than declining outright. Photovoltaic manufacturers are reducing silver loadings per panel to offset higher input costs, while solid-state batteries, AI data centers, and semiconductor manufacturing are sustaining broader industrial silver demand through higher silver use per unit.
Photovoltaic Silver Demand Falls 19% Despite Continued Solar Capacity Growth
Silver demand from the photovoltaic sector is forecast to decline 19% in 2026 to approximately 194 million ounces. Silver now accounts for an estimated 17% to 29% of photovoltaic module costs per watt, up from approximately 3% in 2023, increasing the economic incentive for manufacturers to reduce silver loadings per panel. Global solar installation capacity is projected to grow approximately 15% in 2026, indicating that lower silver demand reflects reduced silver use per panel rather than weaker solar adopt
EV Batteries, AI Data Centers & Semiconductor Demand Offset Lower Solar Silver Usage
Net industrial silver fabrication is forecast to decline only 2% to approximately 650 million ounces in 2026, as rising demand from batteries, data centers, and semiconductors offsets weaker photovoltaic demand. Solid-state electric vehicle batteries targeting up to one kilogram of silver per unit, approximately ten times the silver content of conventional lithium-ion batteries, along with AI data center construction and semiconductor manufacturing, are supporting industrial silver demand despite lower photovoltaic consumption.
The Investment Thesis for Silver
- The Fed’s rate held at 3.50%-3.75% pressures silver prices in the near term, but cumulative supply deficits of 762 million ounces and COMEX registered inventories below 100 million ounces indicate continued physical supply constraints despite restrictive monetary policy.
- The June 16-17 Federal Open Market Committee dot plot is the key scheduled catalyst for silver prices in Q2 2026 because any signal toward a September rate cut could increase investor demand for precious metals, similar to the prior easing cycle when silver rose from $29/oz to $121/oz and outperformed gold on a percentage basis.
- Producers with all-in sustaining costs below $35/oz generate positive cash margins at current $74/oz silver prices, allowing them to remain profitable even if interest rates stay elevated.
- Project developers with Feasibility Studies based on silver prices below $36/oz could generate higher net present values at current $74/oz spot prices, with permitting rather than financing now representing the main hurdle to construction.
- High-grade drill programs intersecting silver above 1,000 grams per tonne are expanding resources at lower discovery costs, supporting future supply growth in a market facing its sixth consecutive annual deficit and improving project economics across different silver price environments.
- Physical investment demand is projected to rise 20% to a three-year high of 227 million ounces in 2026, while India’s resumption of silver bullion imports in May 2026 increases non-industrial demand even as solar manufacturers reduce silver use per panel.
This week’s silver market highlighted the difference between monetary pricing pressure and persistent physical supply tightness. Above-target inflation and expectations for tighter Fed policy increased real yields and pressured silver prices in the near term. At the same time, six consecutive annual supply deficits totaling 762 million ounces continue to constrain physical silver availability despite restrictive monetary policy. At $74/oz, silver trades 38% below its January 2026 peak, yet producers with sub-$35/oz all-in sustaining costs still generate positive margins, development projects modeled at $35.50/oz silver prices retain valuation upside, and high-grade discoveries above 8,500 grams per tonne continue expanding potential future supply. The June 16-17 Federal Open Market Committee meeting will not resolve the long-term supply gap. It will shape whether lower rate expectations return investor demand to silver despite ongoing physical supply deficit.
TL;DR
Silver prices fell 13.6% in six trading sessions as April 2026 US inflation reached 3.8% year over year and the market priced out Fed rate cuts for 2026. The confirmation of Kevin Warsh as Fed Chair reinforced expectations for elevated interest rates, increasing pressure on silver prices through higher real yields. Despite weaker monetary conditions, the physical silver market remains in deficit for a sixth consecutive year, with cumulative shortages reaching 762 million ounces. Industrial demand is shifting away from solar manufacturing toward batteries, AI data centers, and semiconductors, while physical investment demand is projected to rise 20% in 2026. Producers, developers, and high-grade exploration companies continue generating positive operating, valuation, and resource expansion outcomes at current silver prices.
FAQs (AI-Generated)
Analyst's Notes


Subscribe to Our Channel


Stay Informed


