




Can Silver Break $70 While Mine Supply Remains Slow to Respond?



Silver nears $70 as Treasury buybacks support prices, while slow mine supply and byproduct economics strengthen the contrarian case.
- Silver traded at $69.32 per troy ounce on August 24, 2026, up 0.47% on the day, 5.36% on the week, 19.07% over the month, and 80% year over year.
- Silver was down 2.79% year to date, after reaching an intraday high of $121.58 on January 29, 2026, versus a low of $38.09 on August 27, 2025.
- US mines produced approximately 1,100 tons of silver in 2025 from 4 silver mines and 31 lead, zinc, copper, and gold operations where silver was recovered as a byproduct or coproduct.
- World silver mine production rose 2.8% to an estimated 26,000 tons in 2025 from 25,300 tons in 2024, despite a 34% increase in the average silver price to $38 per troy ounce.
- The gold-to-silver ratio rose to roughly 67.5 on August 24 from 66.7 on August 21, showing gold outperformed silver over the period.
Treasury Buybacks Support Silver’s 19% Rally & Keep January High in View
Silver traded above $69 per ounce on August 24, 2026, at a two-month high as concerns over US debt management and fiscal sustainability intensified after Treasury increased buybacks of longer-dated government debt. On the same day, silver reached $69.32 per troy ounce, up 0.47% from $68.99 the prior day, 5.36% on the week, and 19.07% over the month. Silver also gained about 20% across August and briefly touched $70 per ounce on August 21, 2026, showing how fiscal concerns can support precious metals even while silver remains below its January peak.
Silver was down 2.79% since the start of 2026, despite reaching an intraday high of $121.58 on January 29, 2026. The 80% year-over-year gain and negative year-to-date return are both valid, showing that the latest rebound remains well below silver’s January peak.
31 Byproduct Operations Limit Silver Supply Response Despite 34% Price Gain
Silver supply does not fully respond to higher silver prices because most output depends on mining other metals. In 2025, US mines produced approximately 1,100 tons of silver valued at an estimated $1.4 billion from 4 silver mines and 31 lead, zinc, copper, and gold operations where silver was recovered as a byproduct or coproduct. Silver is primarily recovered from lead-zinc, copper, and gold mines, while deposits containing multiple metals account for more than two-thirds of US and global silver resources.
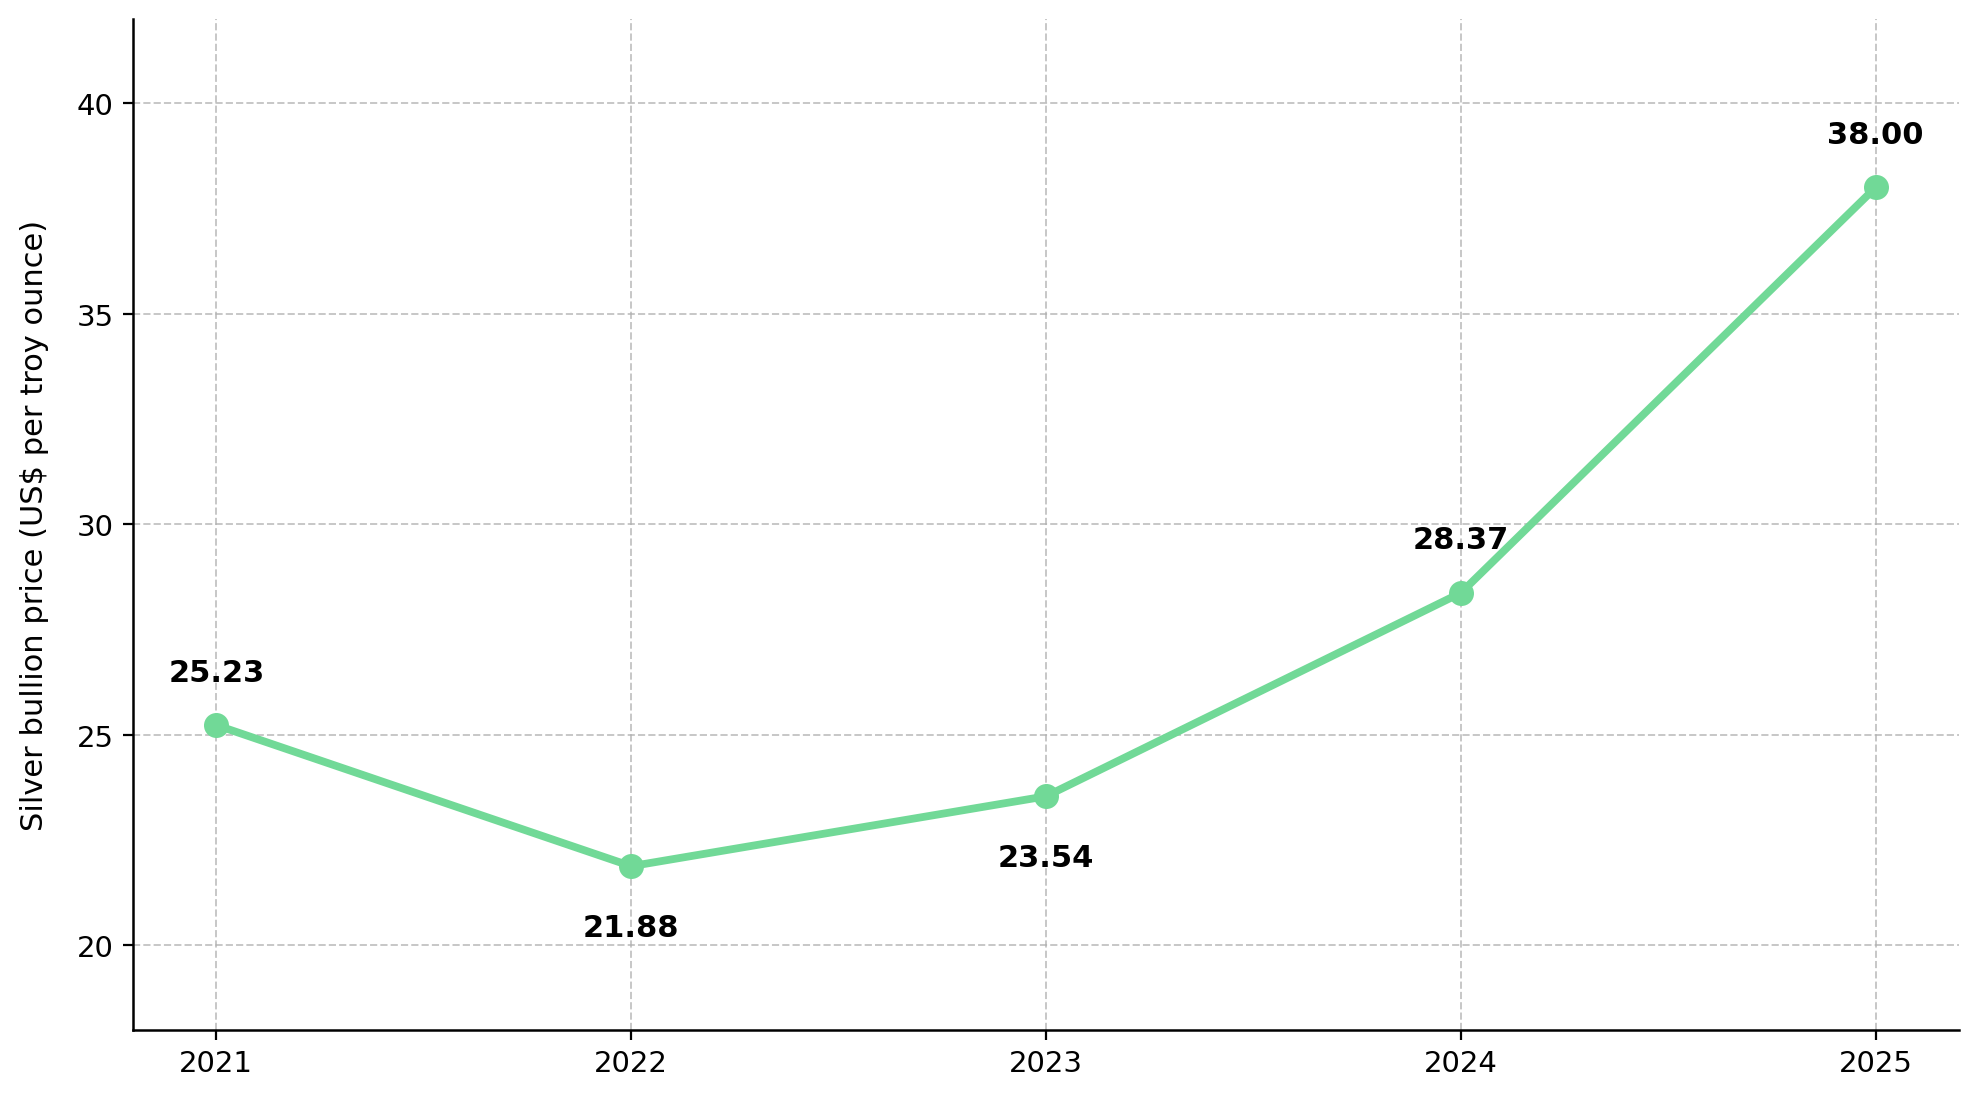
World silver mine production rose 2.8% to an estimated 26,000 tons in 2025 from 25,300 tons in 2024, while the average silver price increased 34% to $38 per troy ounce from $28.37. US mine and mill employment at primary silver operations fell 12.5% to 1,300 in 2025 from 1,485 in 2024, reinforcing that higher silver prices did not produce a comparable increase in mine supply.
Higher Silver Prices Boost Byproduct Credits & Lower Reported Mine Costs
Silver is recovered as a byproduct at 31 of the 35 US operations that produce it, so higher silver prices do not directly drive production at most mines. Instead, higher silver revenue can reduce reported cash costs for lead, zinc, copper, and gold operations because byproduct credits are deducted from the cost of producing the primary metal.
In its first-quarter 2026 filing, Americas Gold and Silver reported Galena Complex cash costs fell 21.5% to $22.12 per ounce from $28.19 a year earlier, primarily due to higher silver sales and byproduct credits. At Cosalá Operations, cash costs rose 44.7% to $24.85 per ounce from $17.17 after zinc and lead production ceased, removing those byproduct credits.
Silver’s headline price does not show which mines receive meaningful byproduct credits. The key test is whether reported costs are net of byproduct credits and how much revenue those credits contribute, because two mines at the same silver price can report opposite cost movements.
Gold-to-Silver Ratio Below 60 Could Signal Stronger Silver-Miner Economics
Current silver pricing is supported more by monetary demand than industrial demand. On August 24, 2026, silver traded near $69 per ounce versus its 2025 annual average of $38, supported by fiscal concerns following Treasury’s increase in longer-dated debt buybacks. With the gold-to-silver ratio near 67.5, gold continues to outperform silver within the precious metals rally.
If the gold-to-silver ratio falls toward its sub-45 level from late January 2026, silver would outperform gold and bring the above-$100 scenarios from Bank of America and BMO Capital Markets into range. Higher silver prices could improve margins at primary silver mines while also increasing byproduct credits at lead, zinc, copper, and gold operations.
Gold-to-silver ratio alongside silver’s spot price should be monitored to gauge whether silver is gaining ground on gold, and check producer cost disclosures to determine whether higher silver prices translate into stronger byproduct credits. A sustained move below 60 would signal stronger silver performance relative to gold and strengthen the case for reassessing primary silver producers.
Analyst's Notes





Subscribe to Our Channel



Stay Informed






