

Fed's June Dot Plot & Silver's 53% Decline Shift Focus to Mine Supply Growth


Silver's 53% decline reflects higher rate expectations, while constrained mine supply and growing industrial demand support its long-term outlook.
- Silver has fallen 53% from its January 2026 all-time high of $121.64 to $57.34 as of June 25, 2026, as the Fed's hawkish dot plot, a 13-month high in the US Dollar Index above 101.61, and Bank of America's forecast for three rate hikes before year-end strengthened the dollar and increased real yield expectations.
- The Silver Institute confirmed a sixth consecutive annual supply deficit of 46.3 Moz in 2026 after 762 Moz of above-ground inventories were drawn down since 2021 while mine production grew by less than 1% annually.
- Industrial demand from solar photovoltaics, electric vehicles, and AI data centers accounts for more than 50% of silver consumption and is growing 3 to 5% annually, independent of Fed policy.
- The gap between paper-market pricing and physical supply is creating different opportunities across silver producers, developers, and explorers.
- The May PCE print released on June 25 could determine the next move in silver prices, as a lower-than-expected core reading could reduce September rate-hike expectations, while a higher reading would strengthen dollar and real yield headwinds.
Financial Markets & Physical Silver Supply
Silver entered June 25, 2026 at $57.34 per troy ounce, its lowest price since November 2025 and 53% below its January 2026 all-time high of $121.64. Over the past month, silver has fallen 25.48% but remains 56.42% higher year over year. The gold-silver ratio widened to 65.6 on June 24, its highest level since the peak of the US-Iran conflict, as investors sold silver more aggressively than gold.
Silver's selloff reflects higher interest rate expectations. The Fed's June 16-17 FOMC meeting produced a hawkish dot plot, with 9 of 18 officials projecting at least one rate hike by year-end. On June 22, Bank of America forecast three consecutive 25-basis-point rate hikes in September, October, and December, which would lift the federal funds rate to 4.25% to 4.50%. The US Dollar Index rose above 101.61 on June 24, a 13-month high that increased the cost of silver for non-dollar buyers.
Physical silver supply remains constrained despite the price decline. Paper markets are pricing silver based on higher real yield expectations and a stronger US dollar, while physical markets reflect a sixth consecutive annual supply deficit and a 762 Moz drawdown in above-ground inventories since 2021. This disconnect suggests the current selloff reflects monetary conditions more than physical supply.
Interest Rate Expectations & Silver Market Pricing
The Fed's June 17 Summary of Economic Projections raised its 2026 PCE inflation forecast from 2.7% to 3.6% and projected core PCE at 3.3% after May 2026 CPI reached 4.2% year over year, its highest level since April 2023. May non-farm payrolls increased by 172,000 versus an 85,000 consensus, reducing the case for delaying further rate hikes. Together, these data increased expectations that the Fed will keep interest rates higher for longer, pressuring non-yielding assets such as silver.
As of June 25, CME FedWatch assigned a 72.8% probability to a September rate hike, rising to 80.6% in October and 87.9% in December. On June 19, Deutsche Bank projected two rate hikes, citing sticky inflation and a resilient labor market. With the 2-year Treasury yield above 4%, investors earn more from cash and bonds, increasing the opportunity cost of holding non-yielding metals. For silver, higher real yields reduce investment demand, while a stronger US dollar makes the metal more expensive for non-US buyers.
The Bureau of Economic Analysis released May PCE data on June 25, the Fed's preferred inflation gauge. April PCE inflation was 3.8% year over year, with core PCE at 3.3%, while economists expected May readings of 4.1% headline and 3.4% core. Core PCE at or below 3.3% could reduce expectations for a September rate hike and lift precious metals. A reading at or above 3.4% would support forecasts for further tightening, strengthening the US dollar and keeping pressure on silver prices.
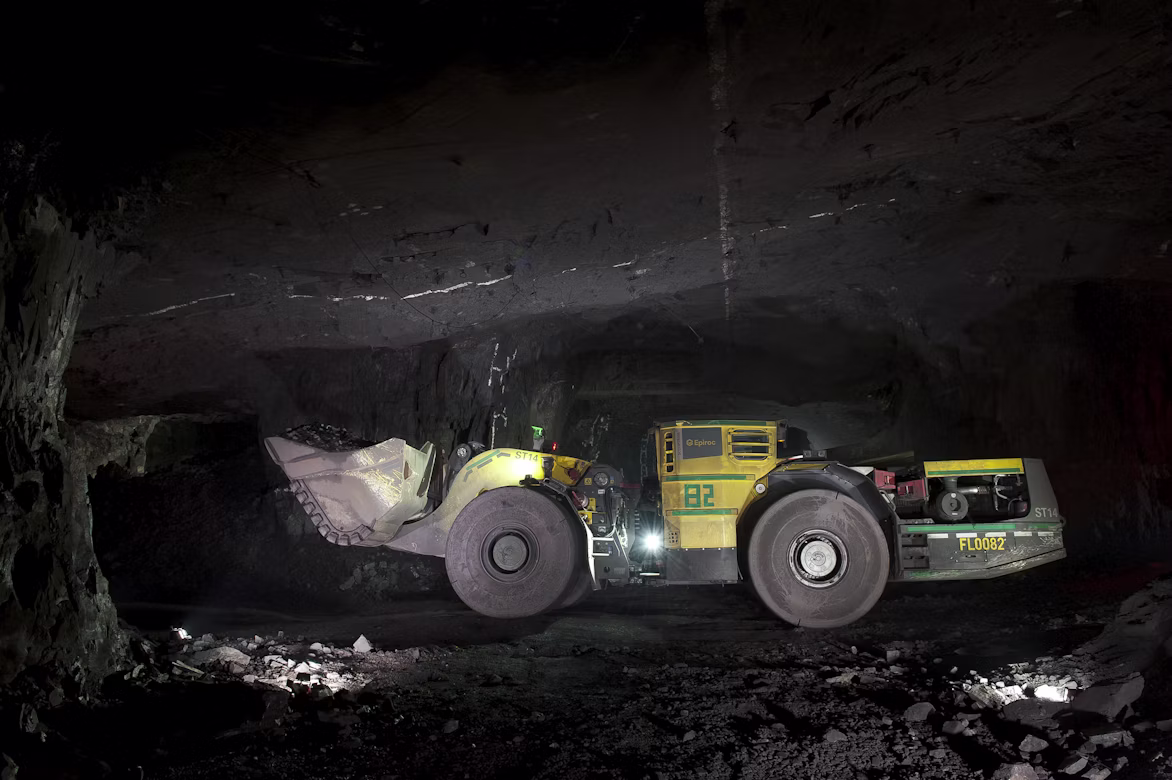
Physical Silver Demand & Limited Mine Supply
The Silver Institute's World Silver Survey 2026, released on April 15, 2026, with Metals Focus, confirmed a sixth consecutive annual supply deficit. The 2026 deficit is projected at 46.3 Moz, up 15% from 40.3 Moz in 2025, bringing cumulative drawdowns in above-ground silver inventories since 2021 to 762 Moz, nearly one year's global mine production. Rate hikes do not speed up permitting, mine development, or smelter construction.
Total global silver supply is forecast to increase 1.5% to 1.05 billion ounces in 2026, driven by a 1% increase in mine production to 820 Moz, but mine output continues to lag industrial demand growth of 3% to 5%, widening the supply deficit regardless of Fed policy. COMEX registered silver inventories stood at 82 Moz in mid-June 2026, while silver ETF holdings fell 13.4 Moz between mid-May and mid-June as investors sold paper positions rather than reducing physical demand.
Bar and coin demand is forecast to increase 20% to 227 Moz in 2026, a three-year high, while US retail demand is expected to rebound 57% as investors buy physical silver at lower prices. The Silver Institute said lower inventories are likely to keep market liquidity thin and lease rates more volatile.
Industrial Demand Growth & Mine Supply Constraints
Industrial demand now accounts for more than half of silver consumption, making the metal less sensitive to monetary cycles than gold. Solar photovoltaics now account for about 29% of global silver demand, up from 11% in 2014, because silver's conductive properties remain difficult to replace with copper or aluminum without reducing efficiency. The European Union's target of 700 gigawatts of installed solar capacity by 2030, together with expanding solar programs across Asia and North America, supports long-term silver demand regardless of Fed policy.
Battery-electric vehicles consume 25 to 50 grams of silver each, 67% to 79% more than internal combustion vehicles, because they require silver in battery management systems, power electronics, and charging equipment. Global automotive silver demand is forecast to grow at a 3.4% CAGR between 2025 and 2031, with electric vehicles becoming the largest source of automotive silver demand by 2027 and accounting for 59% of the market by 2031. AI data centers are also increasing silver demand. Global IT power capacity has grown 5,252% since 2000 to about 50 gigawatts in 2025, with new data centers using silver in connectors, power distribution equipment, and thermal management systems.
Mexico's mining policies show why silver supply cannot increase quickly. About 160 mining projects remain stalled under Mexico's post-2023 mining law, limiting new output from the world's largest silver producer, which supplies 23% to 25% of global mined silver. Growing industrial demand and limited mine supply keep the market in deficit regardless of Fed policy.
Investment Framework Across Producers, Developers & Explorers
The recent selloff affects silver producers, developers, and explorers differently. The key differences are production costs, balance sheet strength, and asset quality, which determine how well each group can withstand lower silver prices.
Production Costs & Operating Margins
Americas Gold & Silver reported consolidated AISC of $34.12 per silver ounce sold in the first quarter of 2026, within its full-year guidance of $30 to $35 per ounce, leaving a margin of about $23 per ounce at a silver price near $57. First-quarter 2026 silver production reached 787,000 ounces, up 76% year over year, while revenue increased 187% to $67.8 million and adjusted EBITDA reached $33.6 million.
Oliver Turner, Executive Vice President of Corporate Development at Americas Gold & Silver, explains why silver supply cannot keep pace with rising demand:
"We've had 6 years of a deficit of about 150 to 200 million ounces a year. We need more silver because demand continues to increase. Seventy percent of silver is a byproduct from other mines, so you can't just turn on more silver supply when the world needs it. That means primary silver producers are producing an increasingly scarce metal that's going to be required across all these applications."
Project Economics & Development Risk
Vizsla Silver completed a Feasibility Study for its Panuco silver-gold project in November 2025, outlining annual silver-equivalent production of 17.4 Moz over an initial 9.4-year mine life, with an after-tax NPV (5%) of US$1.8 billion, an IRR of 111%, and a 7-month payback based on silver at US$35.50 per ounce and gold at US$3,100 per ounce. These are feasibility study estimates, not operating results.
Michael Konnert, Founder, Chief Executive Officer and President of Vizsla Silver, discusses the combination of industrial and investment demand supporting silver:
"Silver does sit at this crossroads of industrial growth and monetary anxiety. Silver is starting to catch up with gold, and seasoned investors know that when that happens, the silver moves can be explosive."
Drill Results & Exploration Potential
GR Silver Mining reported high-grade drill results from the Plomosas Project on May 19, 2026. Hole SMS26-04 returned 45.1 metres true width grading 1,623 g/t silver, including 8.25 metres grading 8,579 g/t silver with 1.6% lead and 5.5% zinc. These are exploration results, and no economic study has yet been published for the SE Area.
Daniel Schieber, Vice President of Corporate Development and Relations at GR Silver Mining, highlights how historically low inventories are increasing the value of new silver supply:
"This metal is in a bit of a squeeze. If you look at silver inventories, they're at historical lows. That's why silver is spiky. Access to the actual silver is critical."
Mine Development Timelines & Supply Constraints
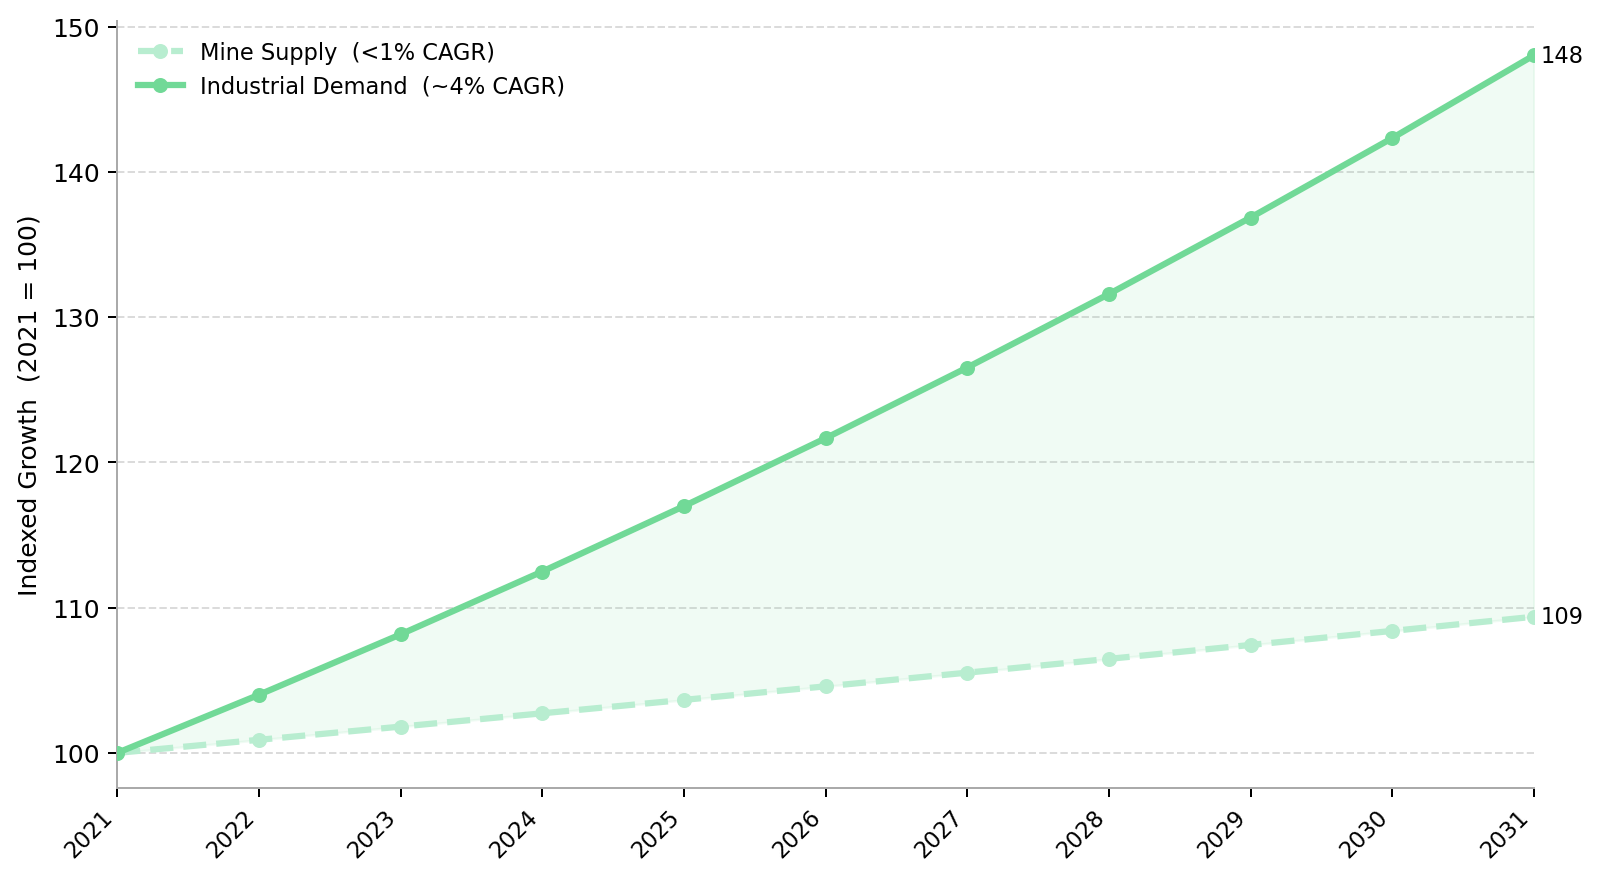
The Fed can reduce demand through higher interest rates, but it cannot increase physical commodity supply. Silver prices reflect higher real yields and a stronger US dollar, while physical demand continues to grow 3% to 5% annually against mine supply growth of less than 1% per year. Whether silver prices recover will depend on mine supply, permitting, and physical demand rather than future changes in the Fed's dot plot.
The Silver Institute estimates new mines typically take 5 to 10 years to progress from discovery to production. The 762 Moz of above-ground inventories drawn down since 2021 cannot be replaced quickly because new mine supply takes years to develop. Investors should monitor whether physical demand continues to outpace mine supply once selling pressure from higher rate expectations subsides.
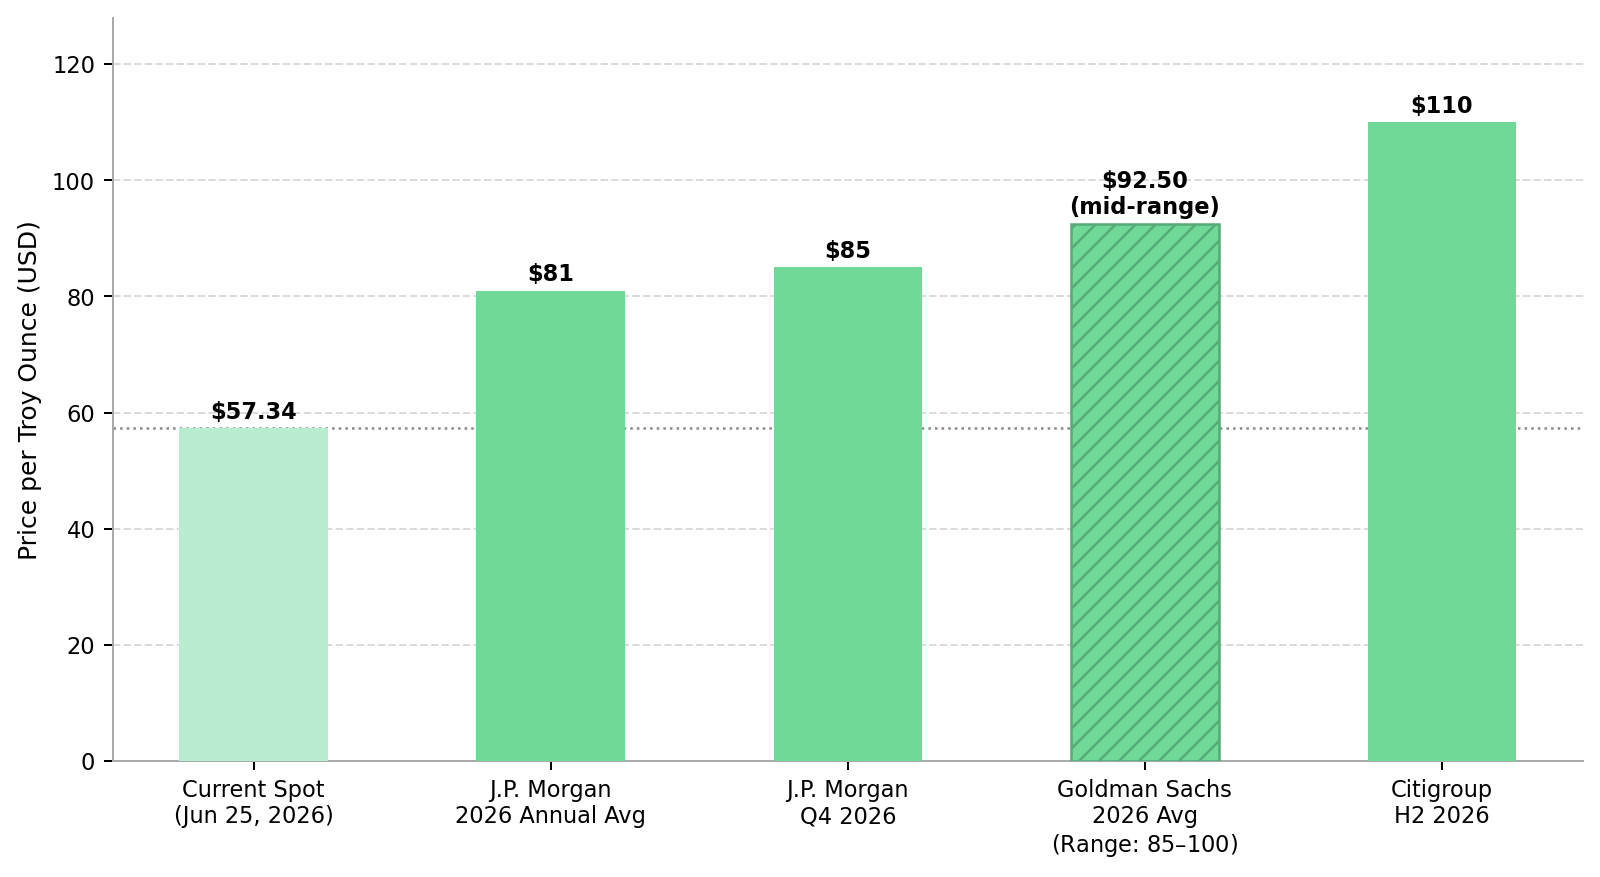
J.P. Morgan Global Research forecasts silver to average about $81 per ounce in 2026, rising to $85 in the fourth quarter. Goldman Sachs forecasts a 2026 average of $85 to $100 per ounce, while Citigroup targets $110 in the second half of 2026, citing physical supply shortages. All three forecasts are based on continued supply deficits and stronger physical demand outweighing near-term pressure from higher interest rates.
The Investment Thesis for Silver
- Silver's sixth consecutive annual supply deficit is projected to widen to 46.3 Moz in 2026 from 40.3 Moz in 2025, bringing cumulative drawdowns in above-ground inventories since 2021 to 762 Moz that cannot be replaced quickly through new mine supply.
- Industrial demand from solar photovoltaics, electric vehicles, and AI data centers continues to grow regardless of Fed policy. Solar accounts for 29% of silver demand, up from 11% in 2014, while battery-electric vehicles use 67% to 79% more silver than internal combustion vehicles.
- Mine production is growing by less than 1% annually, while industrial demand is expanding 3% to 5%, widening the supply deficit. Closing that gap requires new mine supply, which typically takes 5 to 10 years to progress from discovery to production.
- Silver producers with all-in sustaining costs below current spot prices can remain profitable despite recent price declines because operating margins remain positive.
- Development-stage projects with strong feasibility study economics can continue advancing during periods of lower construction and equipment costs, even if silver prices remain under pressure.
- A lower-than-expected May core PCE reading could reduce September rate-hike expectations, weaken the US dollar, and support silver prices.
Silver prices remain under pressure from higher real yields and a stronger US dollar, while physical demand continues to exceed mine supply for a sixth consecutive year, drawing down above-ground inventories. The key question is whether new mine supply can keep pace with growing demand from solar, electric vehicles, AI infrastructure, and physical investment. With new mines typically taking 5 to 10 years to reach production, the supply deficit cannot narrow quickly. Mine supply, physical demand, and Fed policy should be monitored together when assessing silver's medium-term outlook.
TL;DR
Silver has fallen 53% from its January 2026 peak as higher Fed rate expectations, a stronger US dollar, and rising real yields reduced investor demand for precious metals. However, physical market conditions remain tight, with the Silver Institute forecasting a sixth consecutive annual supply deficit of 46.3 Moz in 2026 and cumulative inventory drawdowns of 762 Moz since 2021. Industrial demand from solar, electric vehicles, and AI infrastructure continues to outpace mine supply growth, which remains below 1% annually.
FAQs (AI-Generated)
Analyst's Notes


Subscribe to Our Channel


%20(1).png)
.jpg)
Stay Informed


