Gold Prices Above $4,600/oz & Constrained Mine Supply Support Margin Expansion in Production-Stage Gold Equities


Gold above $4,600/oz is driving record producer margins and inaugural dividends, yet production-stage equities still trade at a 39% EV/EBITDA discount.
- Gold prices above $4,600/oz are supported by 244 tonnes of net central bank purchases in Q1 2026 alongside an 8.64% quarter-on-quarter decline in mine production. With new gold mines typically requiring 10 to 15 years to reach production, the supply shortfall cannot be reversed quickly even at current gold prices.
- Production-stage gold companies are using higher operating cash flow to fund first-time dividends, mine expansions, and reserve drilling without relying on debt or equity issuance, reducing the dilution and balance-sheet risk that defined prior gold bull markets.
- Serabi Gold reported 2025 EBITDA of $77.9 million, up 117% year-on-year, while trading at a 2026 estimated EV/EBITDA multiple of 1.9x against a peer average of 3.1x. Continued dividend payments and free cash flow generation could narrow that 39% valuation discount if earnings delivery remains consistent.
- Integra Resources generated a 40% operating margin in Q1 2026 at an average realized gold price of $4,854/oz and held $105.8 million in cash at March 31, 2026, supporting DeLamar Project pre-production expenditures without near-term equity issuance.
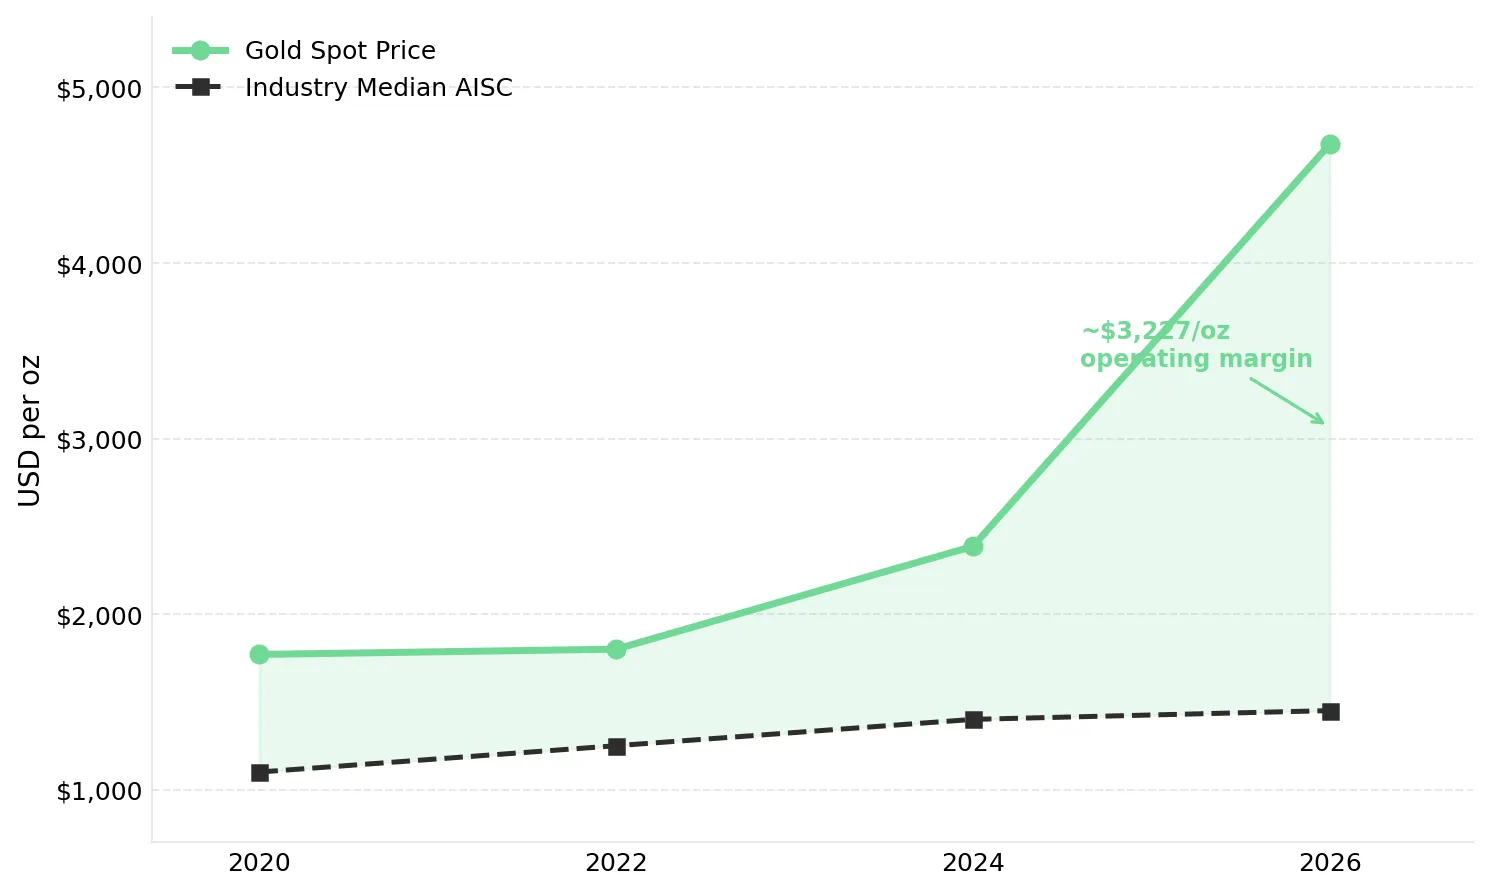
- JP Morgan and Goldman Sachs maintain year-end 2026 gold price targets of $5,000/oz and $5,400/oz respectively, compared with a spot price of approximately $4,677/oz. A further 6% to 15% increase in gold prices would expand margins for producers operating below the industry median AISC of approximately $1,450/oz.
Operating Margins Above $2,600/oz & Below-Peer Valuations in Gold Equities
Gold traded at approximately $4,677/oz as of May 11, 2026, down more than 10% from the January 2026 peak of $5,405/oz per the World Gold Council, while remaining well above the industry median AISC of approximately $1,450/oz. Producers operating below $2,000/oz AISC continue to generate historically wide operating margins at current gold prices. At $4,677/oz gold, producers with AISC below $2,000/oz can generate operating margins exceeding $2,600/oz, significantly above margins achieved during prior gold price cycles.
Gold producers operating below $2,000/oz AISC are now generating free cash flow levels that support dividends, expansion spending, and balance-sheet strengthening simultaneously. Despite stronger cash generation, valuations across parts of the production-stage gold sector remain below peer EV/EBITDA averages.
Gold Prices Above $4,600/oz & the Demand-Supply Drivers Supporting Elevated Margins
Gold prices above $4,600/oz continue to be supported by sustained central bank demand and constrained near-term mine supply growth. Central banks continue accumulating gold despite short-term price volatility, while new gold mines typically require 10 to 15 years to move from discovery to production.
Central banks bought 244 tonnes of gold on a net basis in Q1 2026, 3% above Q1 2025 and above both the prior quarter and the five-year quarterly average. Central bank reserve purchases are typically less sensitive to short-term price volatility than ETF or speculative investment flows. Continued central bank buying during periods of price weakness helps stabilize physical gold demand at elevated price levels. Physical bar and coin demand reached 474 tonnes in Q1 2026, a 42% year-on-year increase and the second-highest quarterly figure on record, driven primarily by Asian retail investors. JPMorgan projects 755 tonnes of central bank gold purchases for full-year 2026, above the pre-2022 annual average of 400 to 500 tonnes, and maintains a Q4 2026 gold price target of $5,000/oz. Goldman Sachs maintains a year-end 2026 gold price target of $5,400/oz, implying further margin expansion for low-cost producers if realized.
Total gold mine production fell 8.64% quarter-on-quarter in Q1 2026 to 1,230.9 tonnes. New gold mines typically require 10 to 15 years to move from discovery to commercial production, limiting the industry's ability to respond quickly to higher gold prices. As a result, elevated gold prices are unlikely to generate meaningful new mine supply within the next two to three years.
Higher Gold Prices & the Production Scalability Supporting Producer Earnings
Because a large portion of mining costs remain fixed after a mine reaches production, higher gold prices can expand operating margins faster than operating costs. Power, diesel, labour, and site operations account for a significant portion of mining costs, allowing revenue growth from higher gold prices to flow disproportionately into cash flow and earnings.
Existing Mill Capacity Expansion Could Lift Serabi Gold Production Toward 70,000oz
Gold averaged $1,770/oz in 2020 and $1,800/oz in 2022, far below the approximately $4,677/oz spot price recorded on May 11, 2026. The global industry median AISC moved from approximately $1,100/oz in 2020 to approximately $1,350 to $1,450/oz in 2024. At $4,677/oz gold against a $1,450/oz cost, the average industry profit per ounce is approximately $3,227/oz. Serabi Gold reported full-year 2025 cash costs of $1,437/oz and AISC of $1,816/oz against an average realized price of $3,481/oz. At a gold price of approximately $4,677/oz, Serabi Gold's implied operating margin rises to approximately $2,861/oz, 71.8% above the margin generated at its 2025 average realized gold price.
Mike Hodgson, Chief Executive Officer of Serabi Gold, connects additional milling capacity to the company’s targeted production growth:
“We’ve been a plant-constrained business. We believe the right thing to do is expand the plant at Palito by adding more milling capacity and getting us up to 70,000 to 80,000 ounces.”
Higher Gold Cash Flow & the Shift Toward Self-Funded Mine Expansion
Serabi Gold is targeting commissioning of a fourth ball mill in Q4 2026, raising processing capacity to 330,000 tonnes per year at a capital cost of US$5 million funded entirely from operating cash flow. Repurposing equipment previously allocated to Coringa reduces procurement lead times and lowers execution risk for the expansion programme. Integra Resources held $105.8 million in cash at March 31, 2026, up from $63.1 million at year-end 2025, and is deploying that liquidity into DeLamar pre-production work, including a $3.4 million deposit to Idaho Power and a $12.5 million land acquisition.
George Salamis, Chief Executive Officer of Integra Resources, frames the decision to preserve the producing asset while funding the development pipeline:
"We're a one asset producer. If the gold price hangs in there with the margins that we're reporting now, and even stronger margins again in 2027 and 2028, we could effectively get to the finish line without major dilution for the project build."
Processing Infrastructure & the Recovery Improvements Supporting Gold Producer Margins
Some production-stage gold companies can increase operating margins without requiring further gains in the gold price. Ownership of processing infrastructure can increase gold recovery rates and reduce third-party processing costs, allowing producers to retain more revenue from existing production.
i-80 Gold's Shift From Toll Milling to Owner-Operated Gold Recovery
i-80 Gold is refurbishing the fully permitted Lone Tree processing facility in Nevada to increase gold recovery and reduce reliance on third-party processing. Currently, i-80 Gold ships ore to a third-party processor and receives payment for only 55% to 60% of the gold it delivers. Owner-operated processing at Lone Tree is projected to increase gold recovery rates to approximately 92%. At US$3,000/oz gold and 150,000 to 160,000 oz of annual production, that translates to projected annual net cash flow of US$150 million to US$200 million against a US$430 million capital cost.
Paul Chawrun, Chief Operating Officer of i-80 Gold, explains the engineering depth behind the capital estimate:
"The overall capital cost is $430 million. We're quite confident with that because it's a level three engineering study, and the vast majority of it is level two."
Existing Mill Infrastructure Enables Production Growth at West Red Lake Gold Mines
West Red Lake Gold Mines is advancing the Rowan Project as a high-grade satellite ore source for the Madsen mill, which has a permitted capacity of 800 tonnes per day and operated at 685 tonnes per day in early Q2 2026. Rowan holds an NI 43-101 Indicated resource of 196,747 ounces at 12.78 grams per tonne (g/t) gold. Routing Rowan ore to the already-permitted Madsen mill allows West Red Lake to expand production without funding a new processing facility, reducing capital intensity and permitting risk. The standalone Rowan Preliminary Economic Assessment (PEA) reported a net present value (NPV) of $125 million and a 42% internal rate of return (IRR) against a $70 million capital estimate. The combined Madsen-Rowan Pre-Feasibility Study is targeting delivery in Q3 2026.
Shane Williams, Chief Executive Officer of West Red Lake Gold Mines, connects existing mill infrastructure to lower-capital production growth:
"We can see a pathway to 150,000 ounces a year in Red Lake. Our mill can be ramped up and effectively doubled with very little capital."
Below-Peer EV/EBITDA Multiples & the Earnings Delivery Required for Re-Rating
Several production-stage gold companies continue to trade below peer valuation multiples despite reporting higher margins, free cash flow, and shareholder returns. Valuation multiples in the gold sector typically expand only after companies demonstrate consistent earnings and cash flow delivery across multiple reporting periods.
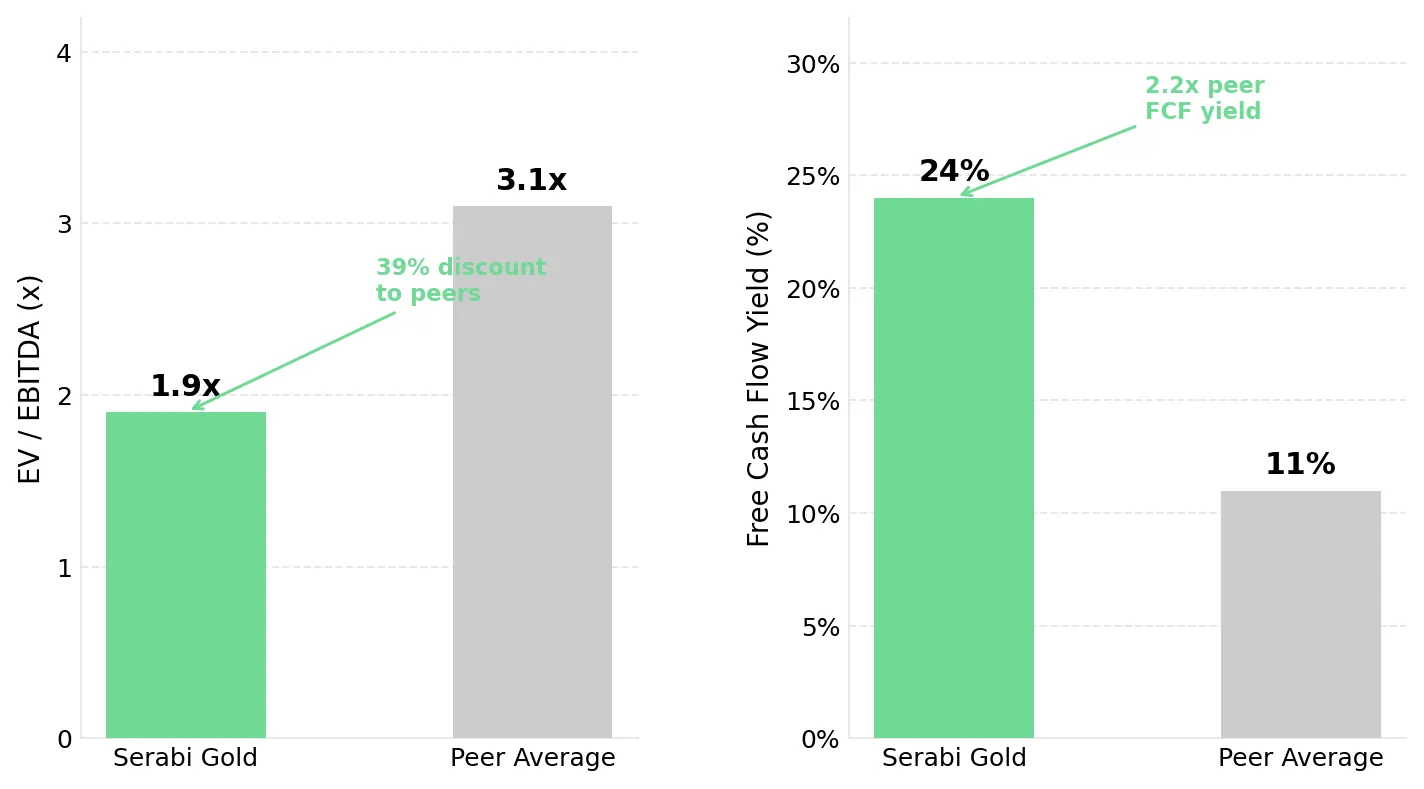
Serabi Gold's estimated 2026 EV/EBITDA multiple of 1.9x is 39% below the peer average of 3.1x, while its Price-to-Net Asset Value (P/NAV) ratio of 0.6x remains broadly in line with the peer average of 0.5x. Serabi Gold's valuation implies comparable asset valuation to peers on a P/NAV basis, while assigning a lower multiple to its earnings and cash flow generation.
Continued quarterly earnings delivery can support valuation multiple expansion toward peer averages. By Q3 2026, Serabi Gold is targeting commissioning of its fourth ball mill, Integra Resources is targeting the Florida Canyon technical report and DeLamar Notice of Intent, West Red Lake Gold Mines is targeting the Madsen-Rowan Pre-Feasibility Study, and i-80 Gold is targeting first gold from Archimedes Underground alongside continued Lone Tree construction progress. Successful project execution and earnings delivery can increase institutional confidence in long-term cash flow generation and support higher valuation multiples.
The Investment Thesis for Gold
- Gold prices above $4,600/oz continue to be supported by 244 tonnes of net central bank purchases in Q1 2026, above the five-year quarterly average, alongside an 8.64% decline in quarterly mine production. JPMorgan's $5,000/oz and Goldman Sachs's $5,400/oz year-end 2026 gold price targets would further expand operating margins for low-cost producers if realized.
- Producers with AISC below the industry median of approximately $1,450/oz as of 2024 are generating gross margins of approximately $3,227/oz at current spot prices. Many valuation models in the gold sector still use long-term gold price assumptions closer to $1,500 to $2,000/oz, leaving current earnings and cash flow generation underrepresented.
- First-time dividends and board-approved capital return policies indicate that more production-stage gold companies are generating sufficient free cash flow to fund expansion and return capital without relying heavily on equity financing, reducing dilution risk for shareholders.
- Producers that own their processing infrastructure can increase gold recovery rates from approximately 55% to 60% under third-party arrangements to roughly 92% under owner-operated pressure oxidation. Higher recovery rates allow producers to retain more revenue from existing ore production, supporting stronger operating margins and cash flow generation.
- Production-stage gold producers continue to trade below peer EV/EBITDA averages as institutional investors wait for additional earnings and operational delivery data. H2 2026 project milestones could strengthen confidence in long-term cash flow generation and support higher valuation multiples if successfully delivered.
Production-stage gold companies do not require a return to the January 2026 gold price peak of $5,405/oz to generate strong earnings and cash flow. At approximately $4,677/oz gold, many producers are already generating operating margins above $2,000/oz alongside positive EBITDA and free cash flow. Consistent quarterly earnings delivery can reduce the valuation discount currently applied to producers trading below peer multiples. The investment case for production-stage gold is increasingly supported by current operating margins and cash flow generation rather than long-term price forecasts. Current physical gold demand, producer cost structures, and capital return policies already support the operating margins and free cash flow being generated across the sector.
TL;DR
Gold at approximately $4,677/oz remains well above the industry median all-in sustaining cost of approximately $1,450/oz, supporting operating margins above $2,000/oz for many production-stage gold companies. Higher operating cash flow is supporting inaugural dividends, self-funded mill expansions, and processing upgrades that increase gold recovery rates by up to 37 percentage points. Central banks purchased 244 tonnes of gold on a net basis in Q1 2026, above the five-year quarterly average, while mine production fell 8.64% quarter-on-quarter, supporting continued tightness in the physical gold market. Yet EV/EBITDA multiples for several producers remain nearly 40% below peer-group averages. Closing the valuation gap does not require gold to recover to the January 2026 peak of $5,405/oz. Continued operational execution and earnings delivery are likely to determine whether production-stage gold companies re-rate toward peer valuation multiples.
FAQs (AI-Generated)
Analyst's Notes


Subscribe to Our Channel


%20(1).png)


.jpg)
Stay Informed