

Gold’s Pullback Puts Producer Costs & Cash Flow in Focus



Central bank buying rose 42% as physical retail demand fell. Testing cash flow at lower gold prices helps assess whether mining shares offer value.
- Spot gold rose 1.2% to $4,112.90/oz on November 9, 2026, recovering from its October 30 low of $3,869.85/oz.
- Central bank purchases reached an estimated 321.2 metric tons in the third quarter, up 42% year over year, while jewelry demand fell 17% and bar-and-coin demand fell 19%.
- US inflation data due November 10, 2026 could change December Fed rate expectations, with stronger inflation potentially pressuring gold and softer readings supporting it.
- The World Gold Council (WGC) reports second-quarter all-in sustaining costs at $1,930/oz, assuming unchanged costs, gold’s October low leaves an illustrative $1,940/oz spread before income taxes, interest and growth spending.
- Testing producer cash flow below the October 30 low of $3,869.85/oz can identify businesses less dependent on a gold-price recovery; central bank buying guarantees no price floor.
Lower Oil Prices Support Gold’s Rebound Above $4,000
Spot gold rose 1.2% to $4,112.90/oz after gaining about 5% the previous week. Oil fell after US President Donald Trump played down further attacks on Iran, potentially reducing inflation pressure and the need for Fed rate hikes that make interest-paying assets more attractive than gold.
Clyde Russell, Asia Commodities and Energy Columnist at Reuters, noted that gold had recovered from its annual low of $3,869.85/oz following earlier rebounds near $4,000. Gold remains about 26.5% below its record of $5,594.82/oz, creating a reason to reassess producers whose costs support cash generation at lower gold prices.
Central Bank Buying Cushions Weaker Physical Retail Demand
Central bank purchases rose 42% year over year to 321.2 metric tons in the third quarter, supporting gold demand as jewelry consumption fell 17% and bar-and-coin demand fell 19%. Physically backed gold exchange-traded funds (ETFs) added 211.2 metric tons, lifting holdings to a record 4,256 metric tons. Total demand fell just 1% to 1,369 metric tons, showing why weaker physical retail buying alone does not undermine gold’s demand case.
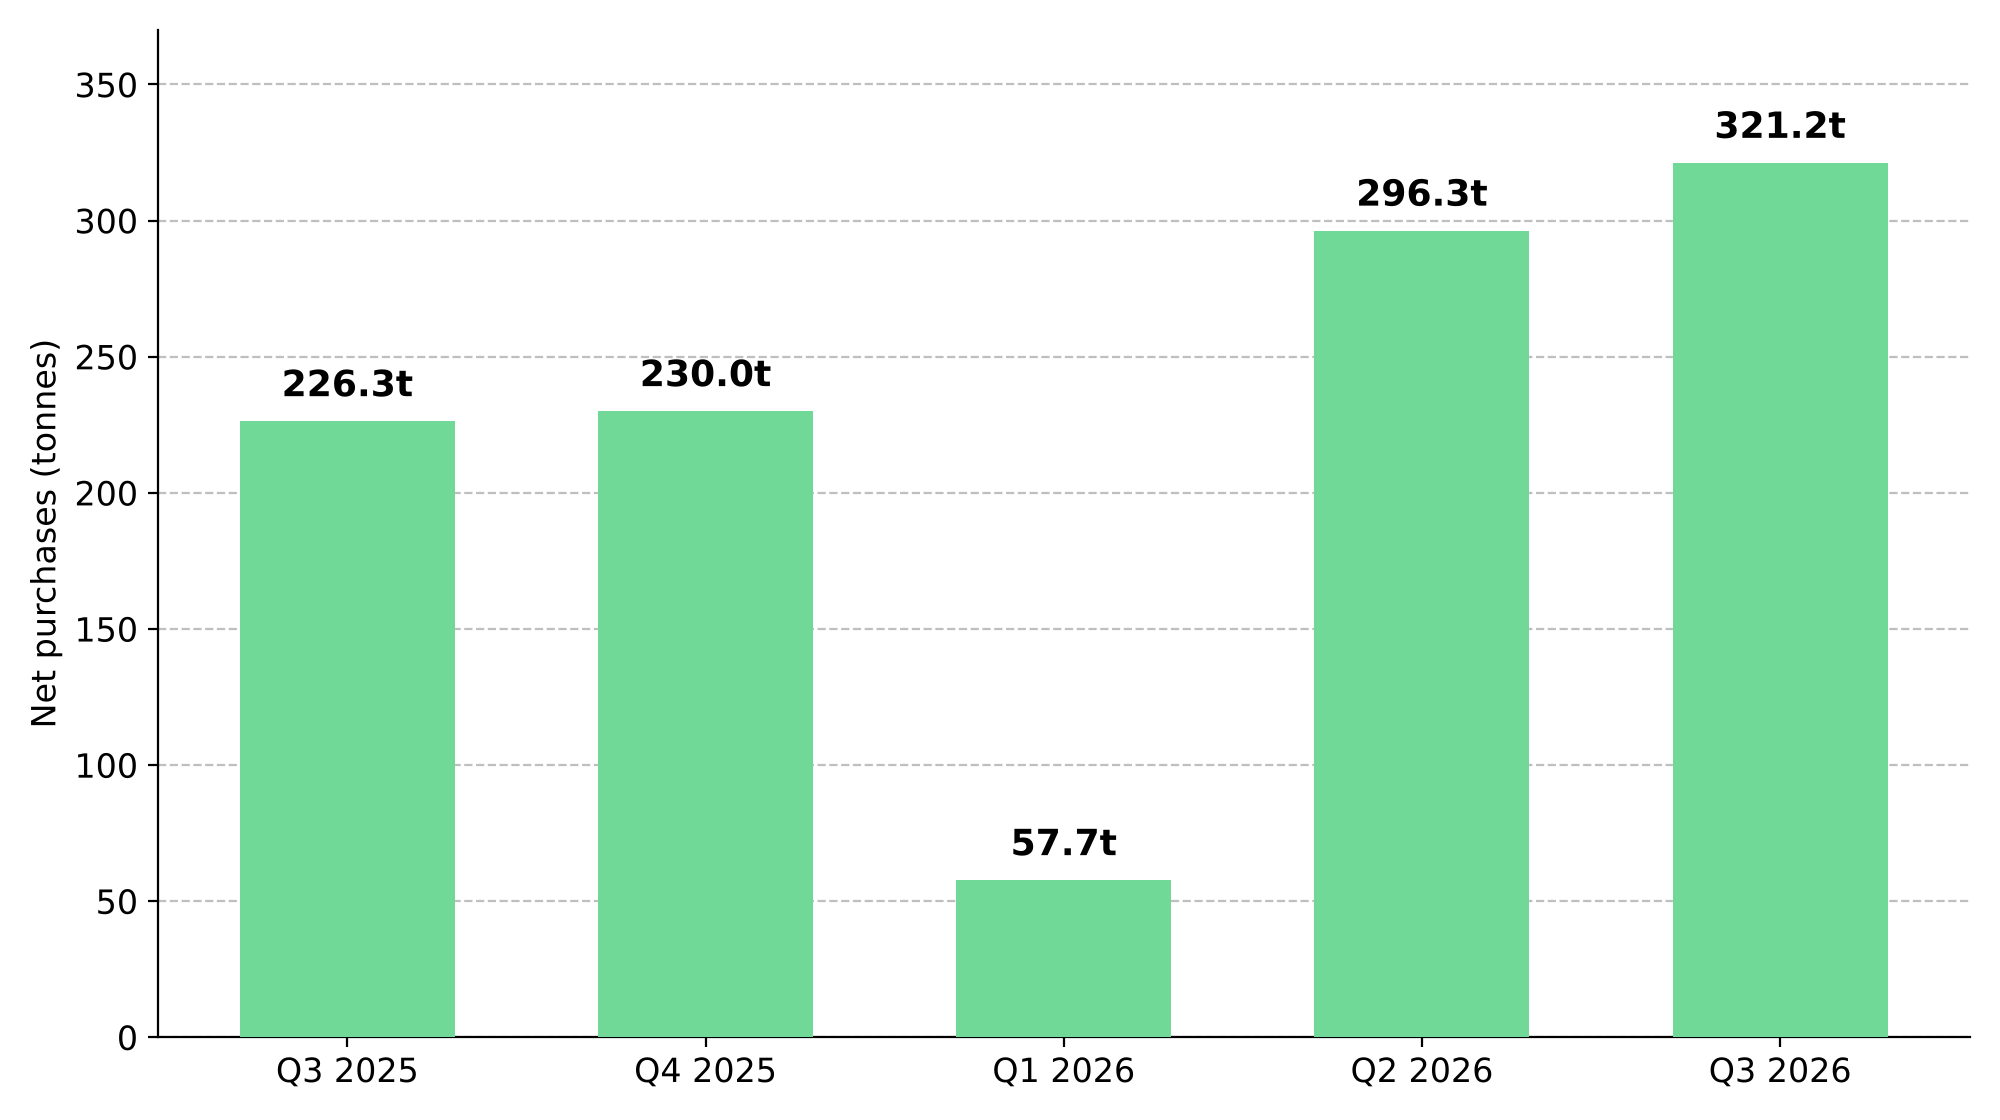
Central bank purchases increased from 57.7 metric tons in the first quarter to 296.3 in the second and 321.2 in the third as quarterly average prices declined. Lower prices may have encouraged purchases, while reserve diversification and risk management remained the main drivers. These purchases support gold demand but do not establish a guaranteed $4,000 price floor.
Softer Inflation Could Lift Bullion by Reducing Fed Hike Bets
Higher rates make interest-paying assets more competitive with gold. Louise Street, Senior Markets Analyst at the WGC, described the year-end outlook as finely balanced between rate pressures and demand linked to geopolitical and financial risks.
Tim Waterer, Chief Market Analyst at KCM Trade, warned that stronger inflation could strengthen the dollar, lift December hike odds and pressure gold. Softer readings could support bullion. Clyde Russell, Asia Commodities and Energy Columnist at Reuters, argued that equity weakness could initially trigger gold selling, then support demand if economic weakness encouraged lower rates.
Central bank demand estimates establish no price floor. Testing producer cash flow below the October low of $3,869.85/oz helps identify businesses less dependent on a gold-price recovery.
Rising Mining Costs Strengthen the Case for Low-Cost Producers
Producers selling at market prices benefit from gold rebounds, but rising costs reduce the gain. The WGC reported second-quarter all-in sustaining costs (AISC) of $1,930/oz, up 22% year over year.
At gold’s October low of $3,869.85/oz, unchanged AISC of $1,930/oz leaves an illustrative $1,940/oz spread, compared with $870/oz at hypothetical costs of $3,000/oz. These spreads exclude income taxes, interest and growth spending and do not represent free cash flow.
Lower costs provide more room to absorb falling gold prices, while thin margins can amplify earnings declines. Company filings help assess costs, debt and spending needs before inflation data and Fed decisions change market expectations.
Lower Costs Support Cash Flow Resilience
Central bank buying and ETF inflows support gold demand despite weaker physical retail purchases. Producers with lower costs, manageable debt and disciplined spending have greater scope to sustain cash generation at lower gold prices. Their investment appeal depends on how that resilience is reflected in share valuations, with a stronger foundation where cash generation remains healthy without bullion revisiting its record.
Analyst's Notes





Subscribe to Our Channel








Stay Informed