




Silver's Sixth Consecutive Deficit Meets Fed Tightening and Solar Substitution: What Investors Should Watch Next



Silver's forecast sixth consecutive deficit meets Fed tightening and solar substitution, making inventories, ETF flows, and supply risks key market signals.
- A forecast sixth consecutive 46.3-million-ounce deficit reflects persistent inventory drawdowns, supporting continued physical market tightness.
- Restrictive Fed policy and accelerating solar substitution weigh on near-term silver prices despite tightening physical fundamentals.
- Existing producers add incremental supply, but long development timelines prevent new mine supply from closing the current deficit quickly.
- Development-stage economics and exploration success do not translate into near-term silver production, making project stage critical when assessing investment opportunities.
- Concentrated mine supply in Peru and refining capacity in China increase the silver market's vulnerability to supply disruptions.
- COMEX inventories, ETF flows, Peruvian concentrate shipments, solar substitution, and Fed policy will determine whether physical tightness or macro headwinds dominate the silver market.
Physical Deficits & Price Downgrades: Why Silver's Mixed Signals Can Coexist
Silver enters August 2026 with physical market fundamentals and institutional price forecasts pointing in opposite directions. The Silver Institute and Metals Focus forecast a sixth consecutive annual silver deficit of 46.3 million ounces in the World Silver Survey 2026, following a 40.3 million ounce shortfall in 2025. Since 2021, the market has drawn down a cumulative 762.1 million ounces from above-ground inventories, approaching one full year of global mine output. Yet J.P. Morgan's Gregory Shearer, Head of Base and Precious Metals Strategy, cut the bank's full-year silver price forecast to $60 to $65 per ounce from $81 per ounce, citing silver's lack of central bank reserve buying, which leaves it more exposed than gold to tighter monetary conditions.

The question is which signal deserves greater weight: a six-year physical deficit that continues to tighten inventories or a bank reassessment of near-term price risk. The answer depends on where a project sits in the production cycle, from operating mines generating cash flow to exploration projects still being delineated through drilling, because each stage responds differently to the same macro and physical market conditions.
Restrictive Fed Policy & Solar Thrifting Support Lower Silver Price Expectations
Two mechanisms explain why silver's near-term outlook has become more cautious despite a widening physical deficit: restrictive Fed policy and slowing demand growth from solar photovoltaics. Unlike gold, silver lacks central bank reserve buying, making it more sensitive to higher interest rates. At the same time, solar manufacturers continue reducing silver intensity through thrifting and engineering improvements.
The Fed held rates at 3.50% to 3.75% on July 29, 2026, while three dissents and persistent 3.3% core PCE inflation reinforced expectations of higher-for-longer policy, with markets pricing roughly a 60% chance of a September rate increase. Without a sovereign reserve demand floor like gold, silver is more exposed to macro tightening, allowing modest declines in gold to translate into larger moves in silver prices.
Solar Thrifting & Copper Substitution Reduce Silver Demand
Solar photovoltaic silver demand is estimated to fall 19% in 2026 to roughly 151 million ounces, the largest annual decline on record, despite continued growth in global panel installations. The decline reflects lower silver intensity per panel as manufacturers increasingly replace silver paste with copper conductors to reduce costs.
LONGi Green Energy, JinkoSolar, and Shanghai Aiko Solar have all advanced copper substitution from development to commercial deployment. As a result, the Silver Institute forecasts total silver fabrication will fall about 2% in 2026 to a four-year low, with growth in data centers and electric vehicles only partially offsetting weaker solar demand.
Tight Physical Inventories & Concentrated Supply Risk Support a Sixth Consecutive Deficit
The bullish case for silver rests on physical market tightness rather than macro price expectations. COMEX-registered inventories cover only 18% of open futures contract exposure, with paper claims totaling about 5.5 times the metal available for delivery. Although registered inventories have risen 3.9% over the past 30 days, the increase represents only a partial recovery from the broader inventory drawdown documented in the World Silver Survey 2026.
Exchange-traded fund flows tell a similar story. The iShares Silver Trust recorded a $228.59 million net inflow over five days in late July 2026, its strongest in months, but remains in net outflow of $543.75 million over three months and $2.43 billion over six months, suggesting investor demand has recovered only partially since the January 2026 rate shock.
Peru & China Concentrate Mine Supply & Refining Capacity
Peru's state-owned oil company, Petroperú, continues to face an energy shortage that prompted a government emergency decree in May 2026, while recurring road blockades have periodically disrupted concentrate shipments from mine sites to ports. Peru supplies a substantial share of the silver-bearing concentrate processed by Chinese refineries, so prolonged shipment disruptions would tighten concentrate availability and compound existing refining constraints further down the supply chain.
China's export licensing regime, effective January 1, 2026, limits silver export eligibility to roughly 44 state-approved entities that each produce at least 80 tonnes annually, replacing a quota system that allowed a much broader group of exporters to participate. Because China accounts for approximately 70% of global silver refining capacity, the licensing regime reduces the flexibility with which refined silver produced from Peruvian and other imported concentrates reaches industrial buyers outside China.
Existing Producers Lead the Near-Term Supply Response
Oliver Turner, Executive Vice President of Corporate Development at Americas Gold and Silver, frames the supply side constraint in terms of how little of the silver market can respond to price at all:
"Seventy percent of silver is a byproduct from other mines, a significant portion of that being copper mines, and copper mines are now constrained because of sulfuric acid supply due to the Strait of Hormuz. You don't have an elastic, highly responsive supply of silver. You can't just turn on more silver supply when the world needs it."

Americas Gold and Silver's production profile reflects the broader structure of the global silver market identified by the Silver Institute. Primary silver mines supplied only approximately 26% of global output in 2025, leaving 74% of supply dependent on base metal production rather than silver prices. Because most silver is produced as a by-product of copper, zinc, and lead mining, higher silver prices alone cannot generate enough new production to eliminate a sixth consecutive annual market deficit.
Long Development Timelines & Silver's Supply Response Lag
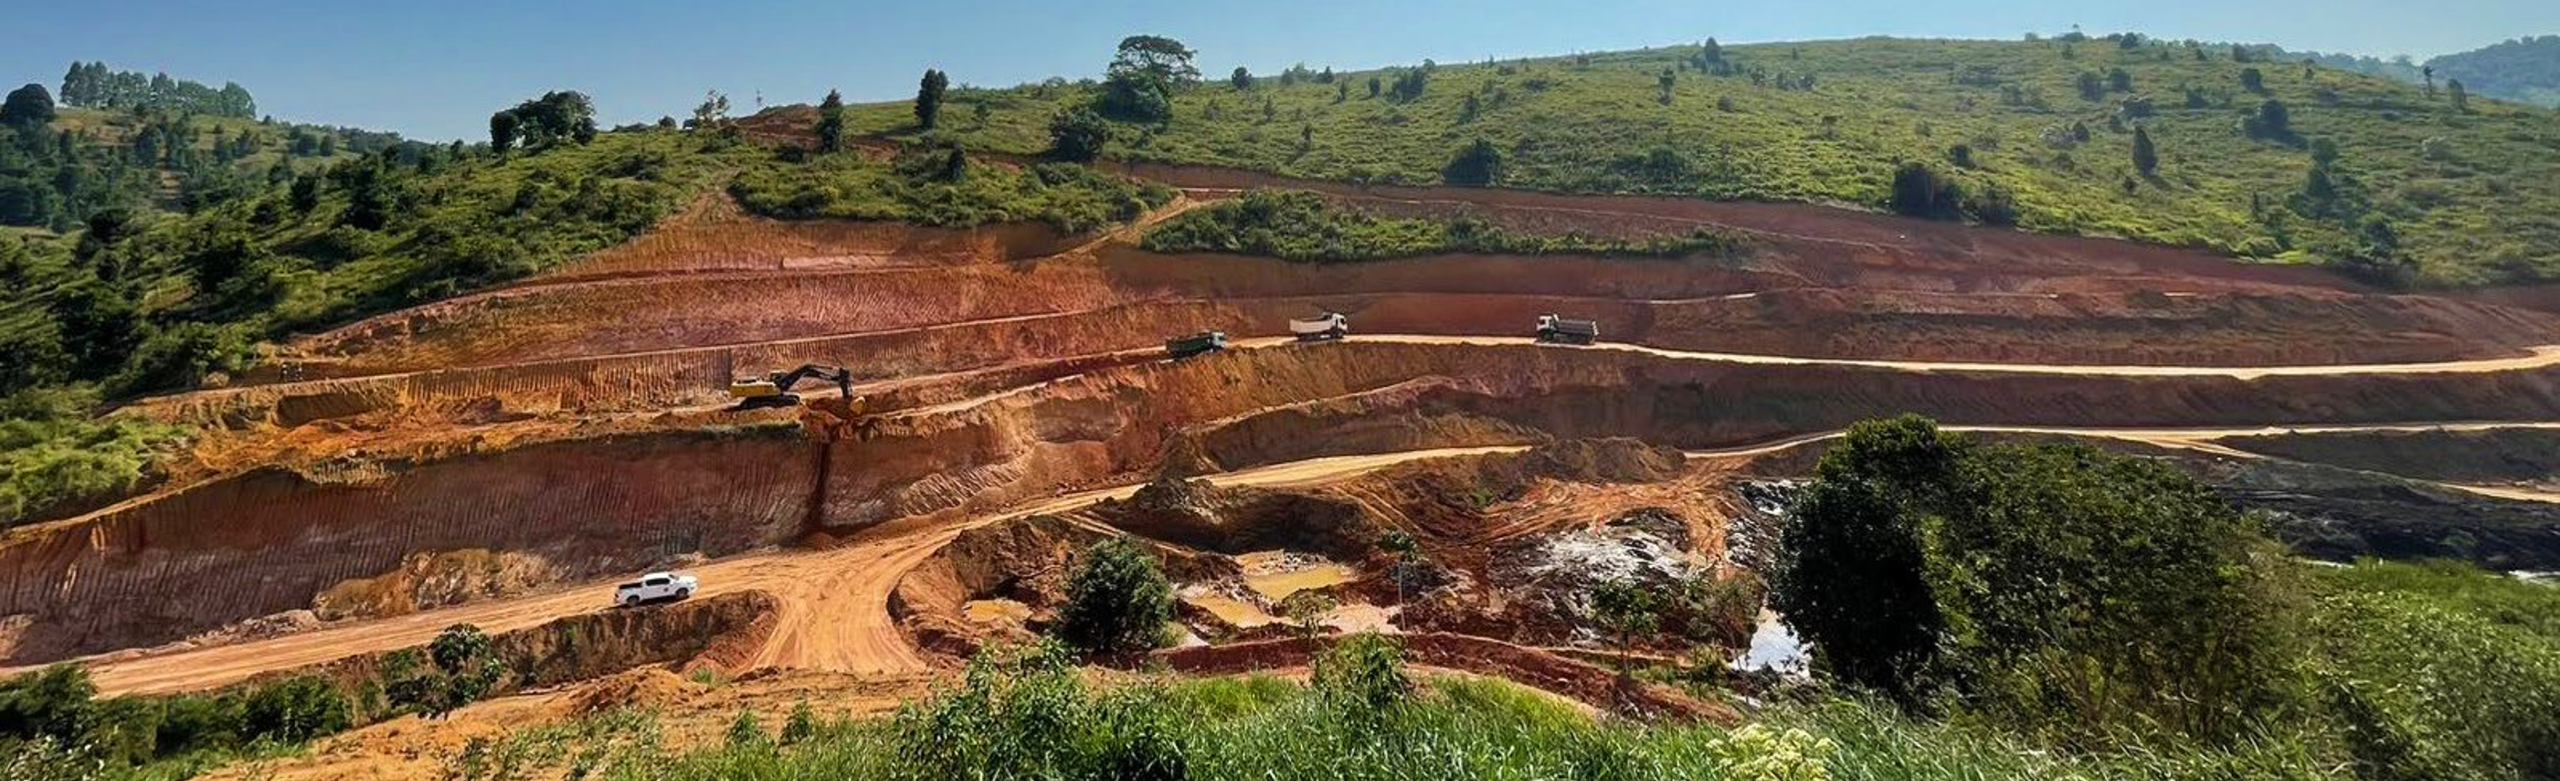
A sixth consecutive silver deficit cannot be eliminated without new mine supply, but permitting, financing, procurement, and construction determine how quickly projects reach production. Vizsla Silver's November 2025 Feasibility Study outlined a 111% after-tax IRR and average annual production of 17.4 million silver-equivalent ounces, yet first production is not expected until the second half of 2027, illustrating that even high-quality projects require years to convert stronger silver prices into new supply.
In June 2026, Vizsla Silver awarded the plant equipment contract for the Panuco Project to FLSmidth, with Chief Operating Officer Simon Cmrlec framing the award as a key procurement milestone that keeps the process plant on budget while supporting both the initial Phase 1 design and future Phase 2 expansion. The agreement covers eight major process plant packages designed for an initial throughput of 3,300 tonnes per day, with capacity to expand to 4,000 tonnes per day in Phase 2. The agreement marks progress in procurement rather than production, illustrating that even fully financed, high-return projects require multiple quarters of engineering, procurement, and construction before they can add new supply capable of reducing the market deficit.
The agreement covers eight major process plant packages designed for an initial throughput of 3,300 tonnes per day, with capacity to expand to 4,000 tonnes per day in Phase 2. The agreement marks progress in procurement rather than production, illustrating that even fully financed, high-return projects require multiple quarters of engineering, procurement, and construction before they can add new supply capable of reducing the market deficit.
Exploration-Stage Discovery Economics Remain Furthest From Production
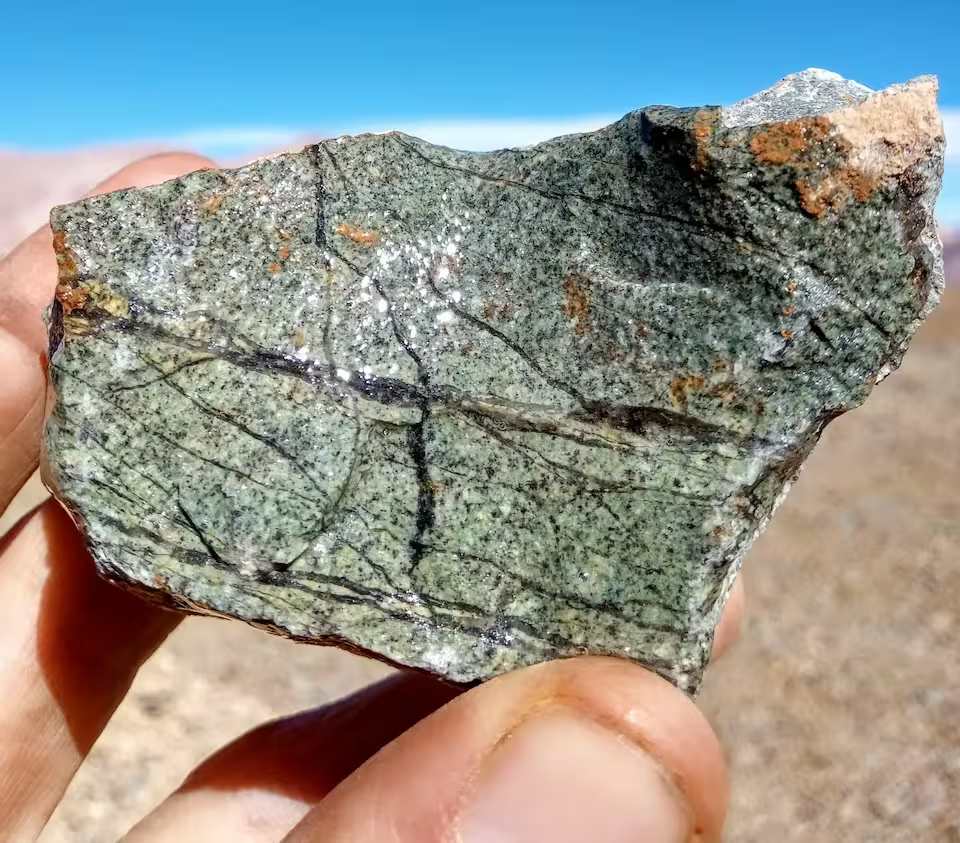
GR Silver Mining is advancing the Plomosas and San Marcial projects through exploration, with a 2023 Mineral Resource Estimate of 77 million ounces of silver across indicated and inferred categories. The company targets an updated resource estimate in late 2026 and a Preliminary Economic Assessment in the first half of 2027, placing the projects several development milestones away from construction and new mine supply.
Eric Zaunscherb, Executive Chair and Interim President and Chief Executive Officer of GR Silver Mining, points to how much of the known mineralised system remains untested even after years of drilling:
"What we've drilled is about 20 percent of that perimeter all the way around that intrusive body, so there's another 80 percent of that perimeter to go. That's one exploration target, and that's where we see the high grade silver."
GR Silver Mining measures exploration success using discovery economics rather than near-term production. The company aims to accelerate development by reusing the permitted, past-producing Plomosas mine for an initial bulk sample program, potentially shortening Mexico's typical five- to seven-year greenfield permitting timeline.
The Investment Thesis for Silver
- A forecast sixth consecutive 46.3-million-ounce deficit reflects persistent inventory drawdowns rather than a temporary imbalance, supporting continued physical market tightness.
- Existing producers add incremental supply but cannot close a forecast 46.3-million-ounce market deficit through current operations alone.
- Development-stage projects with strong economics still require years of engineering, construction, and commissioning before contributing new silver supply.
- Exploration-stage discovery economics help distinguish projects that convert drilling into meaningful resource growth from those that do not.
- Jurisdictional risk in Mexico affects permitting, logistics, and execution, favoring companies that adapt their development strategies to local operating constraints.
- Concentrated silver supply in Mexico and Peru increases market vulnerability because disruptions in either jurisdiction constrain production in an already undersupplied market.
The debate between a six-year physical deficit and a bank's more cautious price outlook is not a contradiction that investors must resolve before allocating capital. J.P. Morgan's downgrade reflects specific near-term mechanisms: the absence of central bank reserve demand, elevated probability of further interest rate increases, and accelerating solar substitution. The Silver Institute's forecast of a sixth consecutive annual deficit reflects longer-run supply constraints: mine supply that cannot respond rapidly to higher prices and concentrate and refining bottlenecks concentrated in Peru and China. The companies discussed here represent three different stages of that mine development pipeline, and tracking how each converts its stated development timeline into delivered ounces, rather than choosing between competing macro narratives, provides a more disciplined framework for positioning across the cycle.
TL;DR
Silver faces opposing forces in 2026. The Silver Institute forecasts a sixth consecutive annual deficit of 46.3 million ounces as above-ground inventories continue to decline, while J.P. Morgan expects lower prices because restrictive Fed policy, the absence of central bank buying, and solar manufacturers' shift toward copper reduce demand growth. Supply remains constrained because most silver is produced as a by-product and new projects require years to reach production. Investors should monitor COMEX inventories, ETF flows, Peruvian concentrate shipments, solar substitution, and upcoming Fed decisions to determine whether tightening physical fundamentals or macroeconomic headwinds ultimately drive silver prices.
FAQs (AI-Generated)
Analyst's Notes





Subscribe to Our Channel










Stay Informed






