
US Fund Selling Takes Gold to 14-Month Low as Central Banks Buy


Rate bets pushed gold to a 14-month low despite steady official buying and UK fund inflows, squeezing high-cost Canadian, Australian and US producers.
- Spot gold fell 3.27% to US$3,722.60 an ounce on Nov 18, its lowest since September 2025, after hawkish Fed minutes.
- CME FedWatch priced a 95.7% chance of a December hike, and North American funds were the only regional gold ETF sellers in October.
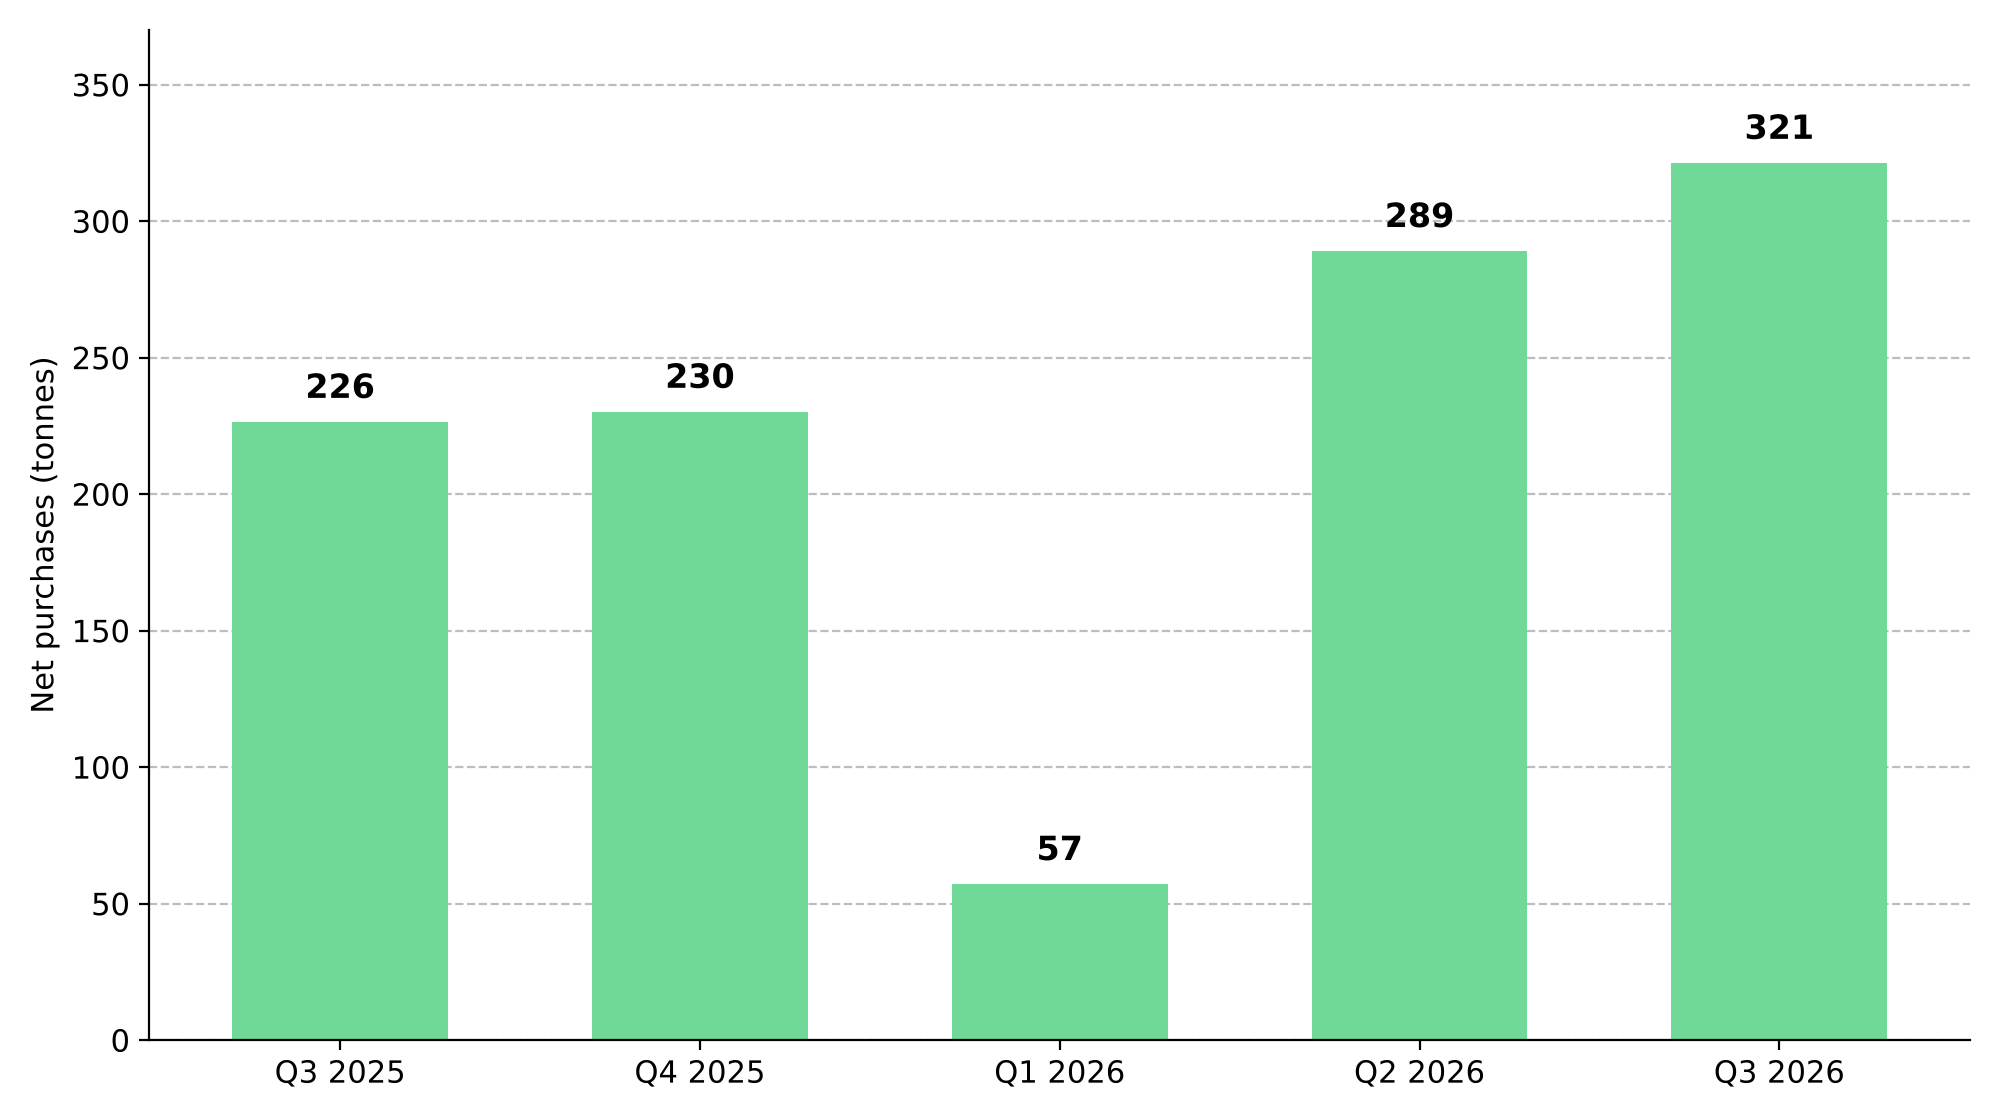
- Central banks bought 321 tonnes in the third quarter, while industry all-in sustaining costs hit a record US$1,930 an ounce.
- Goldman Sachs targets US$4,650 for end-2027 and Morgan Stanley US$5,250. Neither removes rate risk for producers before the second half of 2027.
- Central bank buying below the WGC’s 227-tonne five-year quarterly average would weaken the case for owning unhedged producers.
Hawkish Fed Minutes Drive Gold 33% Below Its January Record
Gold fell to its lowest level since September 2025 on Nov 18 after minutes from the Fed’s Oct 27-28 meeting reinforced expectations of further rate hikes. Spot gold traded near US$3,722.60 an ounce in late US trading, down 3.27% on the session, after touching US$3,719.10. The price sits about 33% below the US$5,589.38 intraday record of Jan 28.
The US dollar index traded near 103.70, close to a 19-month high, and the 10-year Treasury yield sat near 5.1%. CME FedWatch priced a 95.7% chance of a December hike. The fall spread to equities: the S&P/TSX composite lost more than 650 points by late morning on mining and energy losses.
Treasury Yields Above 5% Drive US Fund Selling of Gold
October consumer prices rose 0.4%, and core inflation met the 0.3% threshold at which Fed Governor Christopher Waller had said a 50-basis-point hike may be warranted. The selling centered on US holders. North America was the only region with gold ETF outflows in October, at US$512 million, while UK-led European funds added US$1.8 billion. Retail demand also weakened, with bar and coin buying down 19% to 268 tonnes in the third quarter.
The Fed raised rates in September and held at 3.75% to 4.00% in October on a 10-2 vote. Goldman Sachs economists expect a further hike in March 2027. Renewed US-Iran strikes failed to lift haven demand on Nov 18.
Central Bank Buying Holds as the Fed Path Decides Gold’s 2027 Direction
The WGC’s 321-tonne third quarter total predates the November sell-off; Goldman’s more recent three-month tracking shows about 85 tonnes a month. Goldman’s base case runs a December hike, a March hike and first cuts only in the second half of 2027.
Goldman’s US$4,650 end-2027 target sits about 25% above spot, assuming official buying of 60 tonnes a month. Morgan Stanley targets US$5,250 for the fourth quarter of 2027. In the downside case, where Waller’s 50-basis-point path extends the cycle, a producer with US$1,900 costs earns US$1,600 an ounce at US$3,500 gold.
The Fed decision and Summary of Economic Projections on Dec 9 decide between the scenarios. The reversal level is officially buying below the WGC’s 227-tonne five-year quarterly average in its full-year 2026 report, due around late January 2027, which would remove the floor under unhedged producers.
Record Cost Inflation Leaves Unhedged Gold Producers Carrying the Price Fall
Unhedged gold producers with costs near the WGC’s record industry all-in sustaining cost (AISC) of US$1,930 an ounce carry the sharpest exposure. If costs hold at that second quarter level, the margin at spot is about US$1,793 an ounce, roughly 30% below the second quarter’s, against a 17% lower price. Australian producers face more: national output fell 12% in the third quarter, spreading fixed costs over fewer ounces.
It realized US$4,317 an ounce in Q3 against AISC of US$1,454, then guided the fourth quarter AISC to about US$1,900 on sustaining capital and oil prices. At spot, its margin falls about 36% against a 14% lower gold price. The test is whether costs fall when gold does; sustaining capital and energy do not.
Official Buying Matters Most as Rates Set the Near-Term Gold Price
Gold’s fall is a rate event centered on US holders. In the latest data, central banks and UK-led European funds bought while US-listed funds sold, so the demand floor sits outside the US fund market.
For producers in Canada, Australia and the US, cost inflation is the longer threat. Spot margins remain wide by historical standards, so the lower price belongs in near-term earnings estimates, while the record rise in AISC belongs in valuations. Low-cost, multi-mine producers with strong balance sheets hold the firmest footing. Cheaper gold also cuts scrap supply, now at its lowest since Q4 2023 on WGC data, and deters marginal mine projects.
Rate-driven selling has lowered the gold price without changing who buys the metal, which leaves position size as the main protection for holders of unhedged producers.
Analyst's Notes





Subscribe to Our Channel







Stay Informed