Central Bank De-Dollarization & Fed Policy Constraints Create Wide Valuation Discount in Gold Developer Equities


With central banks buying 244t of gold in Q1 2026 and PCE at 4.5% trapping the Fed, developer equities face a 17-37% re-rating when ETF demand unlocks.
- Central banks net purchased 244 tonnes of gold in Q1 2026, up 17% quarter-on-quarter and above the five-year quarterly average.
- US Q1 2026 GDP grew at 2.0% annualized, below the 2.3% consensus, while the PCE deflator rose to 4.5%.
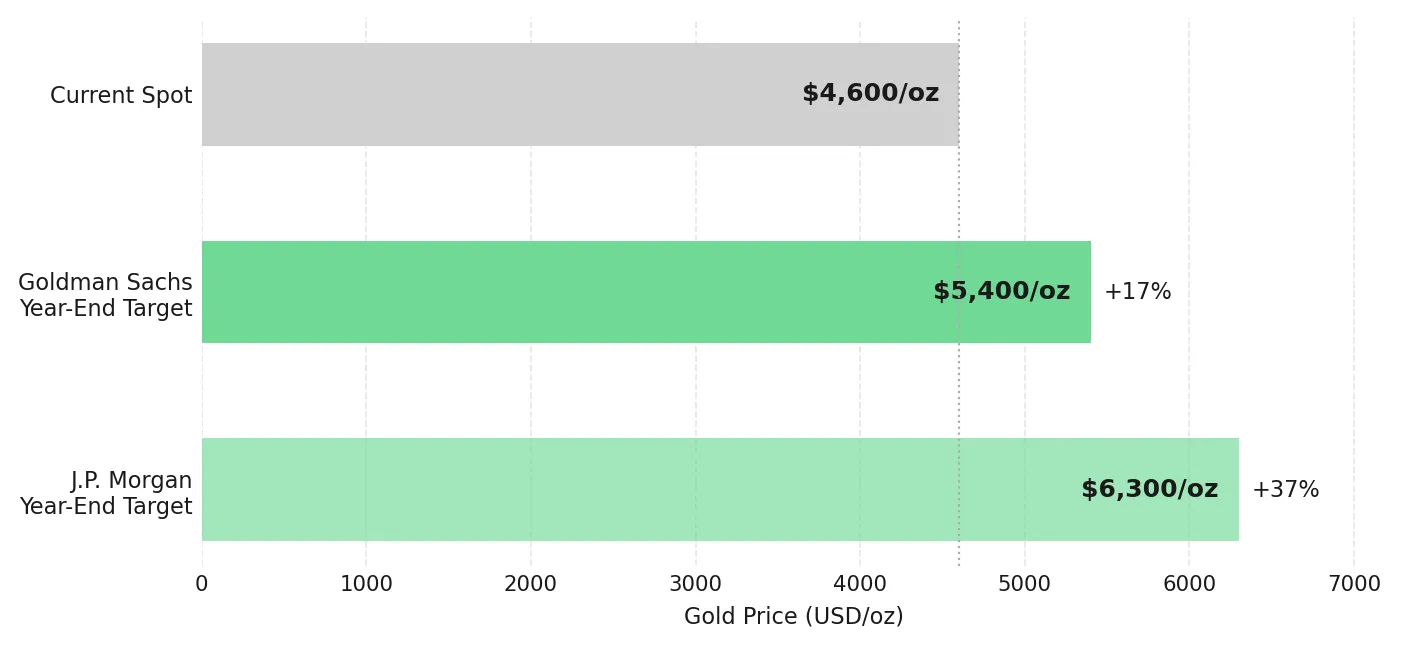
- Goldman Sachs targets $5,400/oz and JPMorgan targets up to $6,300/oz for year-end 2026, implying a 17-37% re-rating from current spot near $4,600/oz, with each 25 basis point cut estimated to generate approximately 60 additional tonnes of ETF demand within six months.
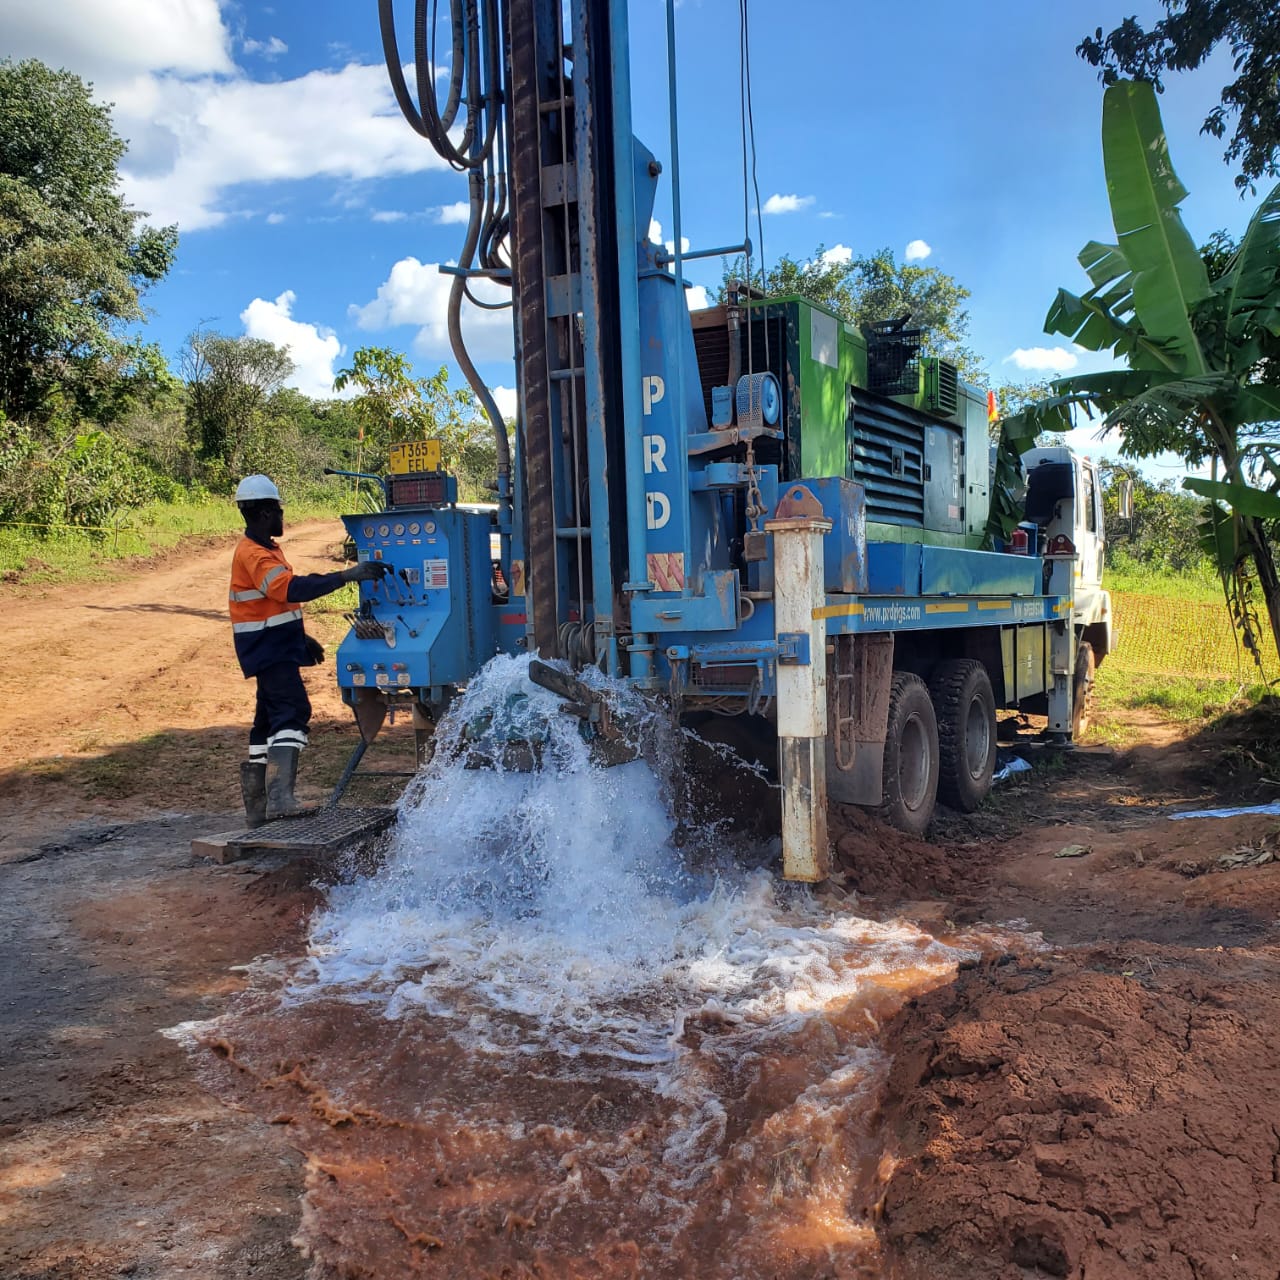
- Developers and producers in Nevada, Ontario, Newfoundland, and Brazil are advancing on-schedule construction programs, securing Bureau of Land Management approvals, and expanding resource bases in measurable regulatory jurisdictions.
- The de-dollarization thesis extends to rare earths and copper, where China controls 85-90% of global refining capacity, generating policy-level procurement demand from the US, European Union, and Australia for allied-nation developers.
Energy Inflation Curbs Gold Price Recovery, Suppressing Western ETF Flows
Gold spot is trading near $4,600/oz, 17.5% below its January 29, 2026 all-time high of $5,595/oz. Middle East conflict-driven energy inflation removed the conditions for Federal Reserve rate cuts, triggering outflows from Western gold ETFs that collectively added approximately 500 tonnes of demand during 2025.
Sovereign Reserve Shifts Establish a Gold Price Floor Independent of Western Flows
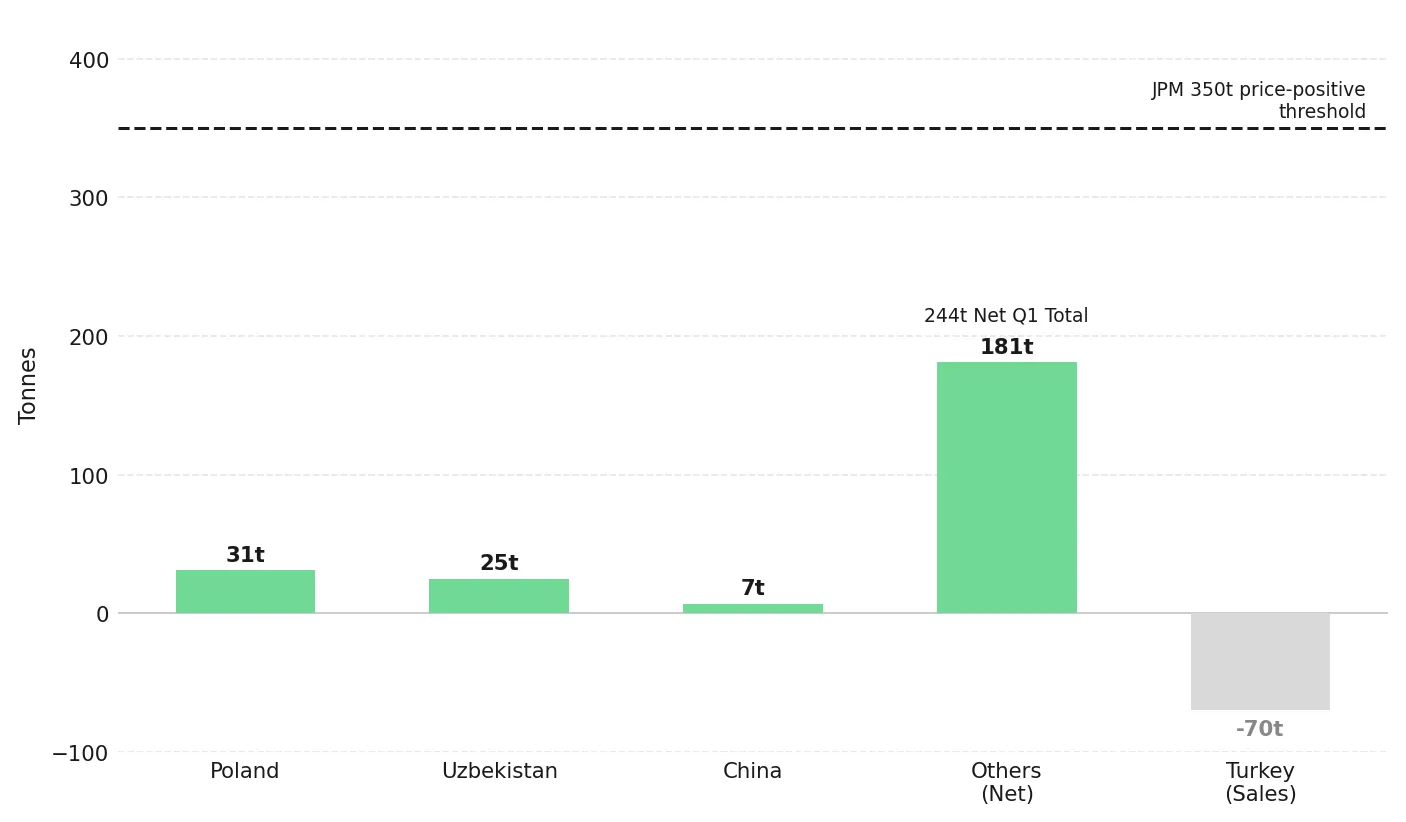
JPMorgan identifies 350 tonnes as the quarterly demand threshold above which gold prices typically rise, quantifying every 100 additional tonnes as worth a 2% quarter-on-quarter price increase. Central bank net purchases of 244 tonnes in Q1 2026 place sovereign buying within 106 tonnes of that threshold before any ETF demand is counted.
WGC Data Confirms Multi-Year Strength in Central Bank Gold Accumulation
The National Bank of Poland purchased 31 tonnes toward an explicit 700-tonne target, lifting holdings to 582 tonnes. The Central Bank of Uzbekistan added 25 tonnes, bringing its gold allocation to 87% of reserves. The People's Bank of China added 7 tonnes, more than doubling its Q4 2025 pace, with holdings at 2,313 tonnes or 9% of reserves. The WGC's full-year target of 700-900 tonnes covers most incremental mine supply growth before Western ETF allocations are counted.
IMF Data Shows Fiscal Deficits Drive Sustained Sovereign Gold Diversification
IMF data confirms the dollar's reserve share has declined over the past decade, with the US fiscal deficit running at 6-7% of GDP. The dollar index fell to a two-month low in late April 2026 following suspected Japanese currency intervention, reducing gold acquisition costs for non-US reserve managers.
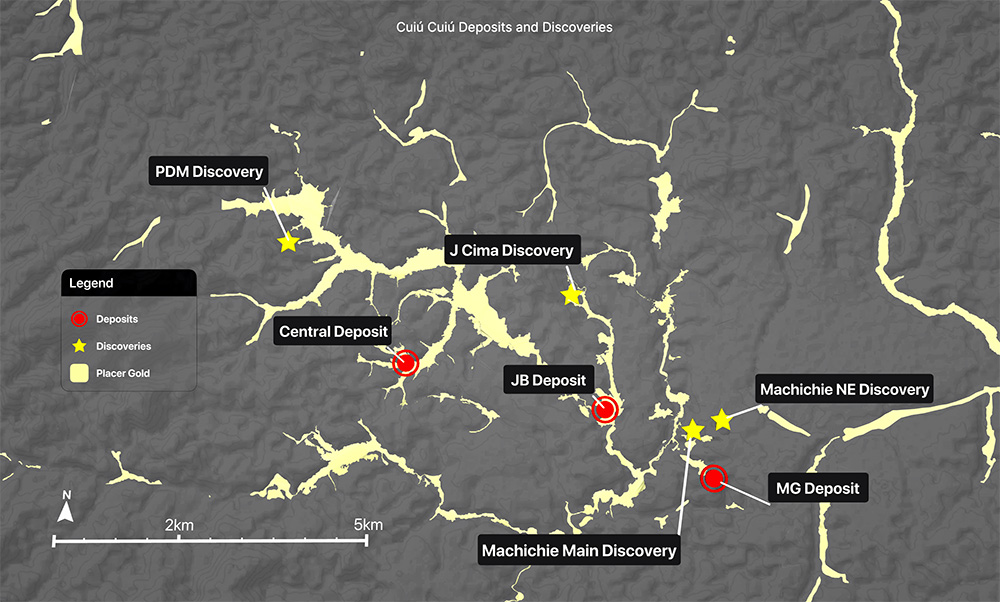
Cabral Gold targeting Q4 2026 commercial production from its Phase 1 heap leach project at Cuiú Cuiú, Brazil, is advancing against this backdrop. Alan Carter, President and Chief Executive Officer, confirms the project is transitioning from developer to producer:
"We're on schedule and on budget. So we are quickly transitioning from a junior developer to a junior producer. We told you that we would get the financing in place and we did, and we're now executing."
High Inflation and Below-Trend Growth Eliminate Federal Reserve Policy Options
The Q1 2026 data eliminate the Federal Reserve's two policy options, producing a monetary stasis in which cash loses 4.5% of purchasing power annually while gold's zero nominal yield becomes comparatively less penalizing.
Consumer Spending Slowdown and Rising PCE Define the Stagflationary Configuration
Q1 2026 real GDP grew at 2.0% annualized, driven by a government spending rebound from Q4 2025's shutdown contraction and pre-tariff stockpiling that will not recur in Q2. Consumer spending grew at only 1.6%. The PCE deflator rose to 4.5%, eliminating the ability to lower rates without accelerating inflation and the ability to raise rates without compressing below-trend growth. The April 29, 2026 FOMC vote to hold rates at 3.5-3.75% passed 8-4, the most internally divided decision since October 1992 per Federal Reserve Board records.
Institutional Targets Await Fed Rate Cuts to Unlock Suppressed ETF Demand
Goldman Sachs holds a year-end 2026 gold price target of $5,400/oz. JPMorgan targets up to $6,300/oz. Both institutions identify the same trigger: Federal Reserve rate cut pricing re-enters the market as energy inflation moderates, unlocking suppressed Western ETF demand. Goldman Sachs quantifies this at approximately 60 tonnes of new ETF demand per 25 basis point rate cut within six months. Three cuts would add approximately 180 tonnes to the 244 tonnes of quarterly sovereign buying already on record, pushing combined demand above JPMorgan's 350-tonne price-positive threshold.
This 17-37% gap between current spot and institutional targets is the financial consequence of a suppressed ETF demand. Developers and near-producers capture re-ratings disproportionately because their net asset values are most sensitive to the gold price assumption in discounted cash flow models.
Permitted Construction & Advancing Permitting Position Developers to Capture the Gold Price Re-Rating
The investment question reduces to which developers and near-producers have verified construction milestones, permitting approvals, and active execution schedules to generate cash flow when suppressed ETF demand unlocks.
Cabral Gold’s Production Target Delivers High IRR Leverage to Institutional Price Estimates
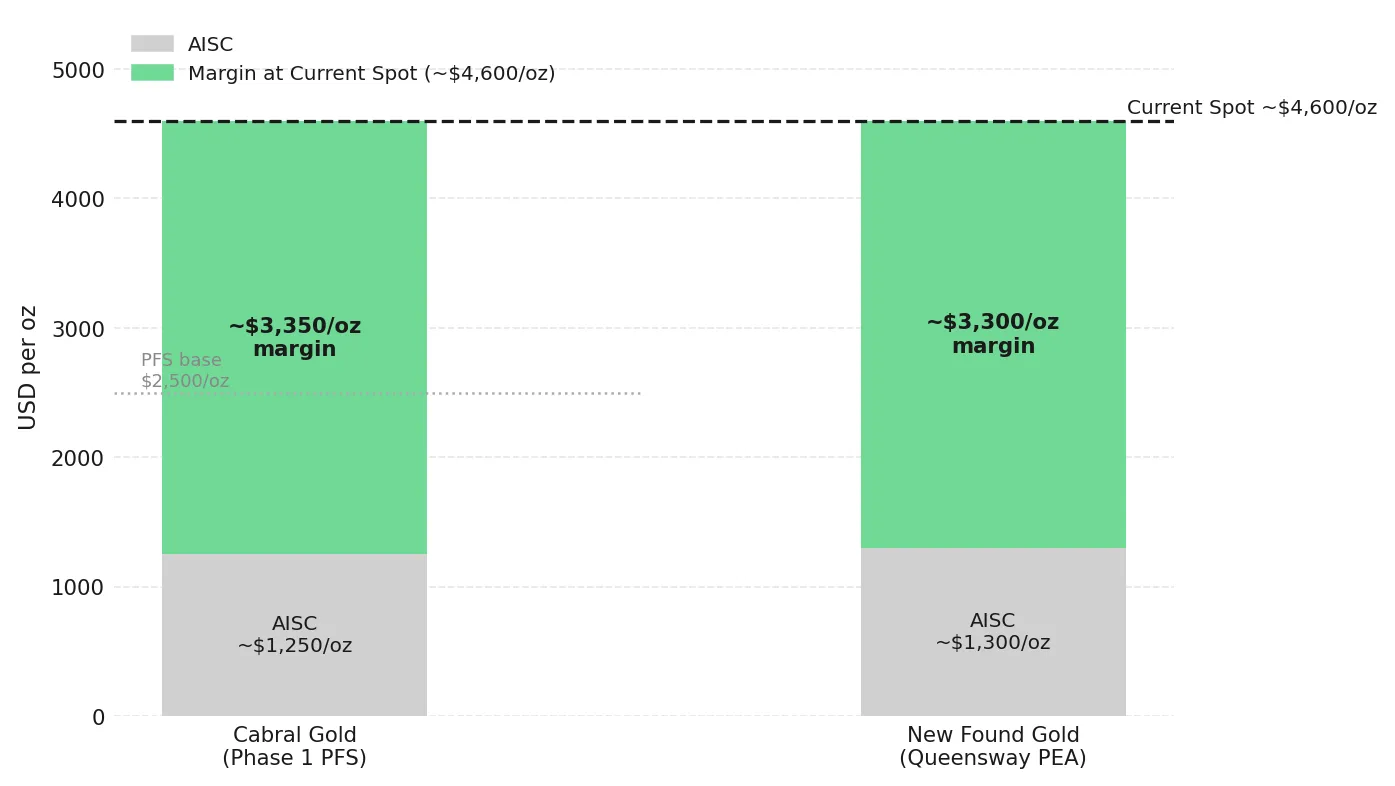
Cabral Gold's Phase 1 gold-in-oxide heap leach project at the Cuiú Cuiú Gold District is approximately 70% complete as of late April 2026, with 85% of project costs committed under contract and commissioning targeting June 2026, ahead of the original Q3 schedule. The Updated Pre-Feasibility Study filed July 29, 2025 reported a 78% after-tax IRR at a $2,500/oz base-case gold price with an AISC of approximately $1,200-$1,300/oz. At the current spot near $4,600/oz, the margin above AISC is approximately $3,300/oz.
Carter clarifies the cost structure relative to the study base case:
"A pre-feasibility study done in July of last year assumed a gold price of $2,500 an ounce and the after-tax rate of return was 78%. The all-in sustaining cost is 1,200. That's just above 1,300 now that diesel price is going up. But that is the plan."
Integra Resources Secures Final Nevada Approvals, Accelerating Pre-Feasibility Timeline
Integra Resources is advancing Nevada North from a position of existing production and internally generated cash flow. The Florida Canyon Mine currently produces gold and funds permitting, drilling, and technical studies across the portfolio, eliminating near-term equity dilution risk.
The April 29, 2026 approval of the Exploration Plan of Operations for the Wildcat Deposit increases drill capacity, but the investment implication is capital efficiency: production-funded development compresses the timeline to the H2 2027 Pre-Feasibility Study without balance sheet expansion.
George Salamis, President, Chief Executive Officer and Director of Integra Resources, outlines the production growth profile underpinning the self-funded platform:
"2026 is about building capacity today at Florida Canyon to deliver more ounces, stronger cash flow, lower costs tomorrow. The guidance range looking out two years is 80,000 to 90,000 ounces per year in 2027 and another 80,000 to 90,000 ounces in 2028."
Hycroft Mining’s Strong Balance Sheet Supports Major Resource Expansion and Development Scale
Hycroft Mining reported a 55% increase in measured and indicated resources to 16.4 million ounces of gold and 562.6 million ounces of silver in the Initial Assessment Technical Report filed February 18, 2026. A high-grade silver resource of 90.2 million ounces at Brimstone and Vortex is under evaluation by RESPEC. Hycroft holds US$189 million in cash with zero debt as of March 31, 2026.
Diane Garrett, President and Chief Executive Officer of Hycroft Mining, confirms the high-grade strategy driving market attention:
"Nobody thought there was high-grade at Hycroft. This is the game-changer. This is what's attracting the attention of the market. And this is the focus of the institutions. They agree with our vision. They agree with our plan."
Financing and High-Grade Intercepts Signal Institutional Conviction in Development-Stage Gold
New Found Gold, advancing the Queensway Gold Project in Newfoundland and Labrador, has transitioned from discovery drilling to development-stage planning, with the July 2025 PEA defining an initial production profile and the April 27, 2026 C$115 million financing funding progression toward production. Keith Boyle, Chief Executive Officer, details the Queensway cash flow case:
"The first couple of years we're looking at about 100,000 oz a year at an all-in sustaining of about $1,300. So, you do the quick math on that and that's 300 plus million dollars of cash flow a year."
West Red Lake Gold Mines reported 471 g/t Au over 1 meter from Vein 013, against a 2025 PEA delivering a 42% after-tax IRR at US$1,800/oz gold. Shane Williams, President and Chief Executive Officer, attributes the anticipated re-rating to the company’s successful delivery of milestones:
"I do see that as we begin to deliver, that's where we're going to get re-rated. And up to now, we said what we were going to do. We've done it slowly and steadily. We've delivered."
Supply Chain Risk Drives Strategic Relevance for ISR-Amenable Rare Earth Projects
Cobra Resources holds Australia’s only ISR-amenable rare earth project, avoiding open-pit mining, with carbonate grading 42.94% heavy REEs and 38.9% magnet REEs with less than 0.9% impurities. CSIRO sequential leach tests confirmed recoveries of up to 25% using tap water alone. The company also holds an option over the 1,855km² Manna Hill Copper Project in South Australia's Nackara Arc, where initial drilling returned 74 meters at 1.02% copper.
Robert Vero, Managing Director of Cobra Resources, explains product differentiation and cost positioning:
"We announced results for our optimized flowsheet that produced one of the highest proportions of heavy rare earth mixed rare earth carbonates globally. That adds great not only strategic and commercial value, but it provides great marketability. We have 4 and a half percent dysprosium and terbium and 43% heavies in that mixed rare earth carbonate and we're producing it from one of the lowest cost forms of mining."
The Investment Thesis for Gold
- Central bank net buying of 244 tonnes in Q1 2026 places sovereign demand within 106 tonnes of JPMorgan's 350-tonne price-positive threshold, establishing a floor independent of Western institutional sentiment.
- A PCE deflator at 4.5% against 2.0% GDP growth traps the Federal Reserve in policy stasis, making cash a 4.5% annual real-return loser and validating gold's zero nominal yield for long-duration holders.
- Goldman Sachs and JPMorgan targets of $5,400 and up to $6,300/oz sit 17-37% above current spot, with the re-rating trigger quantified at 60 tonnes of new ETF demand per 25 basis point rate cut within six months.
- Developers and near-producers with AISC below $1,500/oz exhibit maximum margin expansion at current spot, where ~$4,600 gold implies ~$3,100+/oz operating margins, driving disproportionate increases in after-tax NPV.
- Assets in Nevada, Ontario, Newfoundland, and South Australia offer regulatory predictability through NEPA processes, CSIRO-validated metallurgical programs, and provincial frameworks, reducing technical risk premiums in institutional DCF models.
- Developers transitioning from construction to production re-rate as commissioning risk is removed, shifting valuation from discounted future cash flows to realized operating performance and compressing discount rates applied by institutional investors.
Gold's discount to institutional targets reflects the energy-driven inflation delaying Federal Reserve rate cuts that unlock Western ETF demand. Sovereign accumulation of 244 tonnes in Q1 2026, a PCE deflator at 4.5% against 2.0% GDP growth, and an 8-4 FOMC vote are the documented preconditions for a re-rating cycle whose trigger, magnitude, and beneficiary cohort are quantifiable. Developers with permitted assets and advancing milestones are positioned to capture that re-rating first.
TL;DR
Central banks purchased 244 tonnes of gold in Q1 2026, placing sovereign demand within 106 tonnes of JPMorgan's price-positive threshold before Western ETF flows are counted. US PCE inflation at 4.5% against 2.0% GDP growth has trapped the Federal Reserve in policy stasis, suppressing ETF inflows while simultaneously validating gold as a purchasing power preserver. Goldman Sachs targets $5,400/oz and JPMorgan targets up to $6,300/oz by year-end 2026, a 17-37% re-rating from current spot near $4,600/oz. Developers and near-producers with low AISC structures, advancing construction timelines, and permitting approvals in Nevada, Ontario, Newfoundland, and Brazil are positioned to capture that re-rating disproportionately when rate cuts unlock suppressed demand.
FAQs (AI-Generated)
Analyst's Notes


Subscribe to Our Channel


Stay Informed