Cooler US Inflation Steadies Gold After a 6% September Loss



Lower-cost gold miners retain larger margin cushions, while jobs and inflation data could change Fed hike odds and the timing of selective buying.
- Spot gold rose 0.1% to $4,162.38/oz on October 1 after August personal consumption expenditures (PCE) inflation of 3.4% missed a 3.7% forecast, reducing October Fed hike odds to 37% from 45%.
- The 10-year Treasury yield closed at 5.29% on September 30, making bonds more competitive with gold, which pays no income and lost more than 6% that month.
- Central banks bought a second-quarter record 288.9 tonnes in Q2 2026 while gold exchange-traded funds (ETFs) shed 44.8 tonnes, supporting demand despite fund selling.
- At October 1 spot prices and unchanged Q1 2026 all-in sustaining costs (AISC) of $1,785/oz, the modeled producer margin remains about $2,377/oz, 23% below Q1’s record, favoring lower-cost producers ahead of the October 28 Fed decision.
- A London Bullion Market Association (LBMA) afternoon gold price below the article’s $4,000/oz risk threshold would cut that modeled margin below $2,215/oz, making lower production costs more valuable.
PCE Inflation Miss Cuts Fed Hike Odds, Lifting Gold Off September Lows
Spot gold rose 0.1% to $4,162.38/oz after annual PCE inflation of 3.4% missed a 3.7% forecast. The surprise cut October Fed hike odds to 37% from 45%, reducing near-term rate pressure on gold and supporting the rebound case.
Gold remains 26% below its $5,595 record after losing more than 6% in September. A 5.29% 10-year Treasury yield limits gold’s appeal by offering income that the metal does not pay.
Fed Hikes Raise Gold's Holding Cost as Central Banks Absorb Supply
The Fed raised rates by 25 basis points to 3.75%-4.00% to bring inflation toward its 2% target. Higher rate expectations can lift Treasury yields, making bonds more attractive than gold and encouraging ETF selling. Traders still price an 89% chance of a December hike, limiting relief from lower October hike odds.
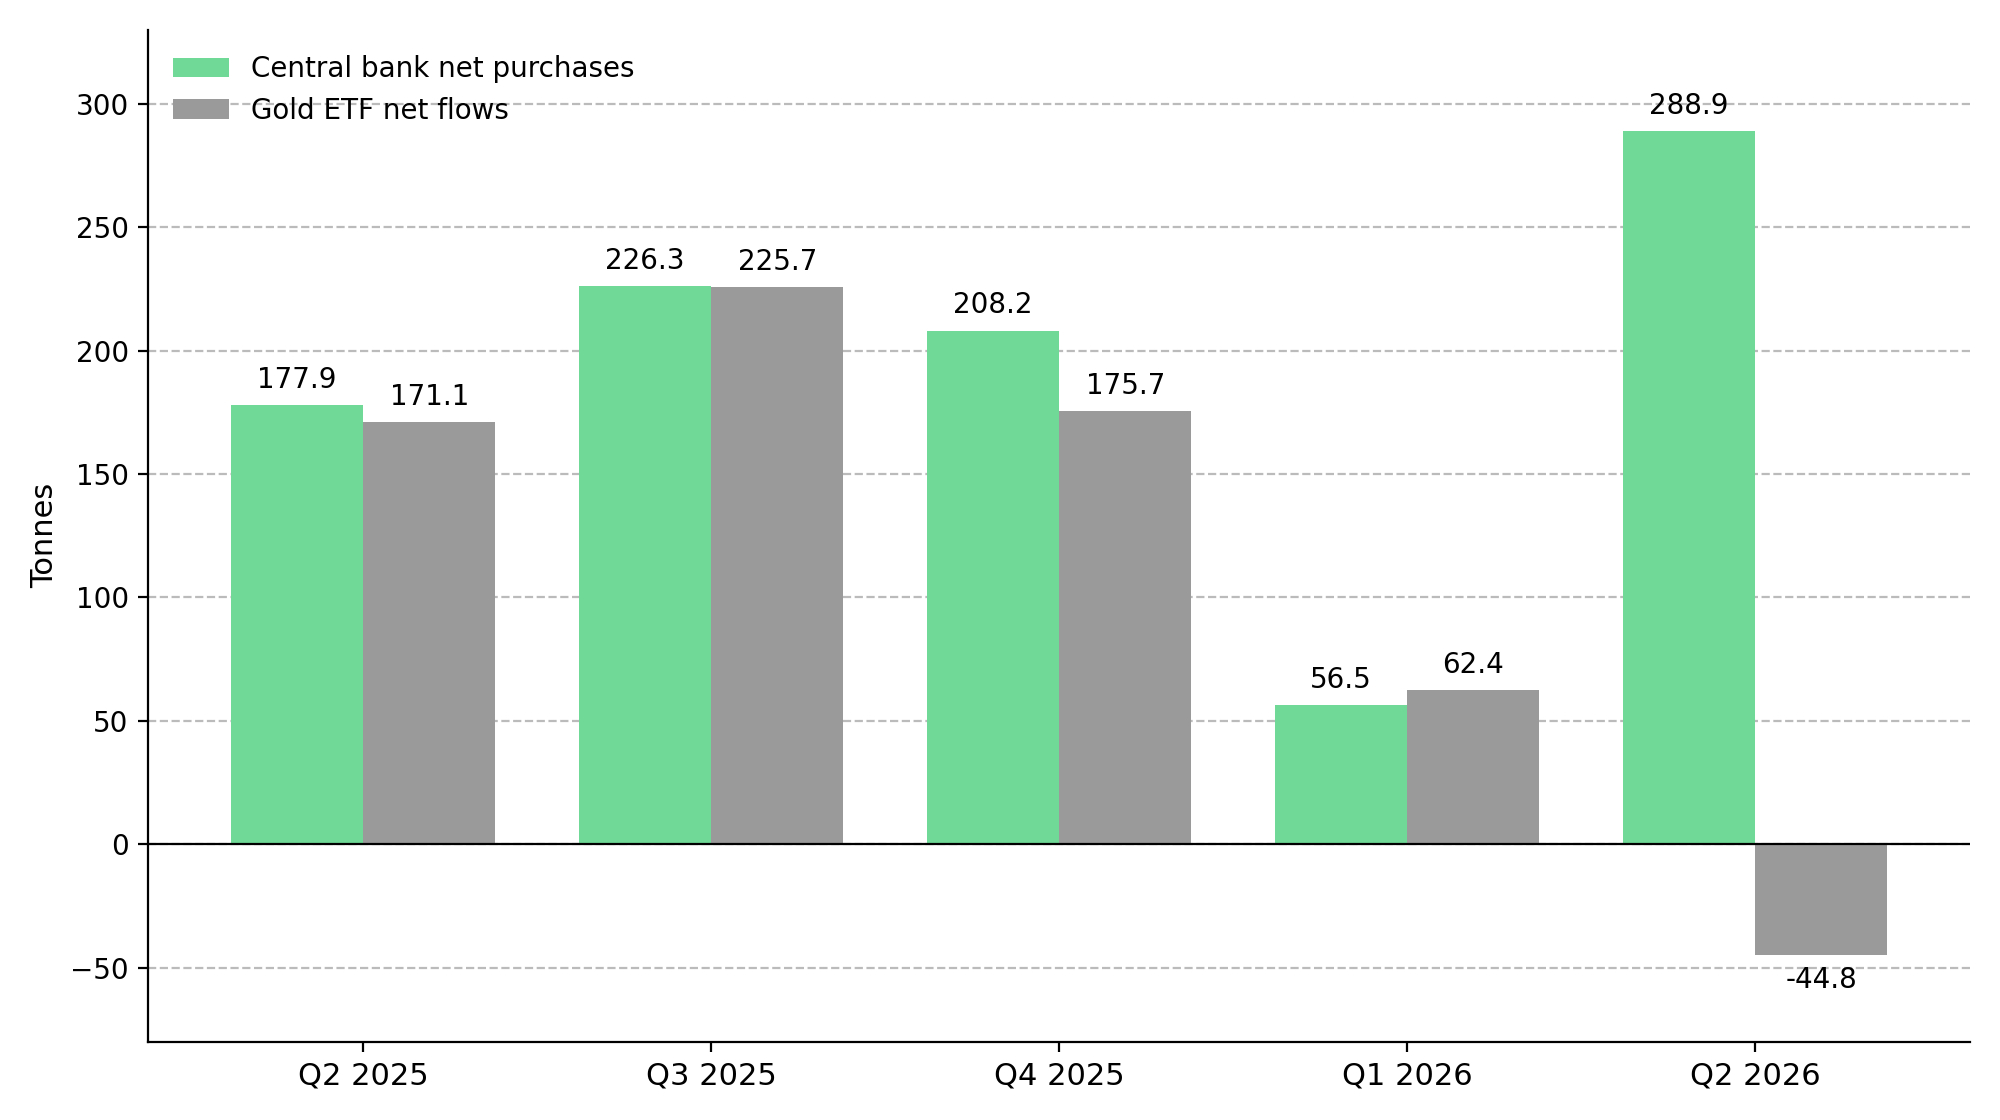
Central banks bought a second-quarter record 288.9 tonnes in Q2 2026 while ETFs shed 44.8 tonnes, supporting gold demand despite fund selling. Paul Brink, President and Chief Executive Officer of Franco-Nevada and World Gold Council Chair, said growth in official gold holdings underscored gold’s role as a strategic reserve asset.
Payrolls & the October Fed Decision Decide Whether Gold Holds $4,000
Lower October hike odds offer gold some relief, but an 89% chance of a December hike keeps rate pressure in place. Nitesh Shah, Commodity Strategist at WisdomTree, said bond-market volatility could increase demand for gold as protection against uncertainty.
Before the October 28 Fed decision, weaker payrolls and cooler consumer price index (CPI) inflation could lower hike odds and support gold; stronger readings could lift yields and pressure prices. Tony Sage, Chief Executive Officer of Critical Metals, warned before the PCE release that hotter inflation could lift yields and the dollar, weighing on gold.
At $4,162.38/oz and unchanged Q1 AISC of $1,785/oz, the modeled producer margin is about $2,377/oz, 23% below Q1’s record. An LBMA afternoon price below the article’s $4,000/oz risk threshold would reduce that margin below $2,215/oz, favoring lower-cost producers that can withstand further declines.
Higher Rates & Fuel Costs Squeeze Unhedged Gold Producer Margins
Spot gold is $711/oz below Q1’s $4,873/oz average, while Q1 AISC rose 16% year over year to $1,785/oz, mainly because of higher royalties. At unchanged costs, the modeled margin is $2,377/oz, 23% below Q1’s record. Royalty and streaming companies offer gold-price exposure with less direct exposure to mine fuel costs.
B2Gold’s Q1 2026 MD&A bases its annual guidance on $5,000/oz gold, with each $100/oz price decline reducing AISC by about $12/oz through lower royalties and production taxes. Holding other inputs unchanged, that leaves an $88/oz reduction in its modeled margin.
The PCE release cut October hike odds by eight percentage points, showing how quickly policy expectations can change. Test position sizes against a $4,000/oz scenario while retaining exposure to a recovery. Lower-cost producers have larger margin cushions, but shares can fall more than bullion because costs decline more slowly than gold prices.
Rate Pressure Caps Gold Prices While Official Demand Sets the Floor
Higher Treasury yields make bonds more competitive with gold, while central bank purchases add demand without guaranteeing a price floor. Record Q2 buying therefore offers support for the longer-term case, rather than proof that September’s decline has ended.
Unhedged producer valuations should be tested using current gold prices, updated costs, and a $4,000/oz downside scenario. Lower-cost operators retain larger margin cushions, improving their ability to withstand another decline and participate in a recovery.
For multi-year holdings, the selloff creates opportunities to assess lower-cost producers where valuations and balance sheets support selective buying.
Analyst's Notes





Subscribe to Our Channel
%20(1)%20(1).jpg)
.jpg)
Stay Informed