Fed Hike Bets Pressure Gold, but Low-Cost Miners Retain Larger Margin Cushions



Lower-cost gold miners retain larger margin cushions, while jobs and inflation data could reshape bond yields and gold’s rebound prospects.
- Spot gold traded at $4,188.17 an ounce on September 30, on course for a September loss of more than 5% despite an unresolved Gulf conflict.
- The oil shock reaches gold through the Fed: higher crude kept US inflation above target, the Fed hiked to 3.75% to 4.00% on September 16, and Treasury yields rose to multi-year highs.
- Two outcomes hang on the October 28 Fed decision: a hike points gold back to its $4,110.55 September low; a hold lets the haven bid act on price.
- For unhedged gold producers, September's price loss of more than $200 an ounce outweighs the fuel cost of the whole oil shock, and the Fed outcome cannot be forecast.
- A CME FedWatch December hike probability below 50%, from 89% before the August PCE release, would reverse the current direction.
Gold Price Heads for Over 5% Monthly Loss as Fed Hike Outweighs Gulf War Bid
Spot gold rose 0.2% to $4,188.17 an ounce but remained down more than 5% for September. Earlier, gold fell nearly 4% to $4,110.55 as higher crude prices lifted Fed hike bets. Gold subsequently rebounded above $4,200 after core personal consumption expenditures (PCE) inflation came in at 3.0%, below the 3.3% consensus.
Despite the unresolved Gulf conflict, gold remained about 24% below its record, leaving recovery potential if lower Fed hike expectations reduce the appeal of interest-paying assets.
Oil-Driven US Inflation Forces Fed Hikes, Lifting Yields & Pushing Gold Lower
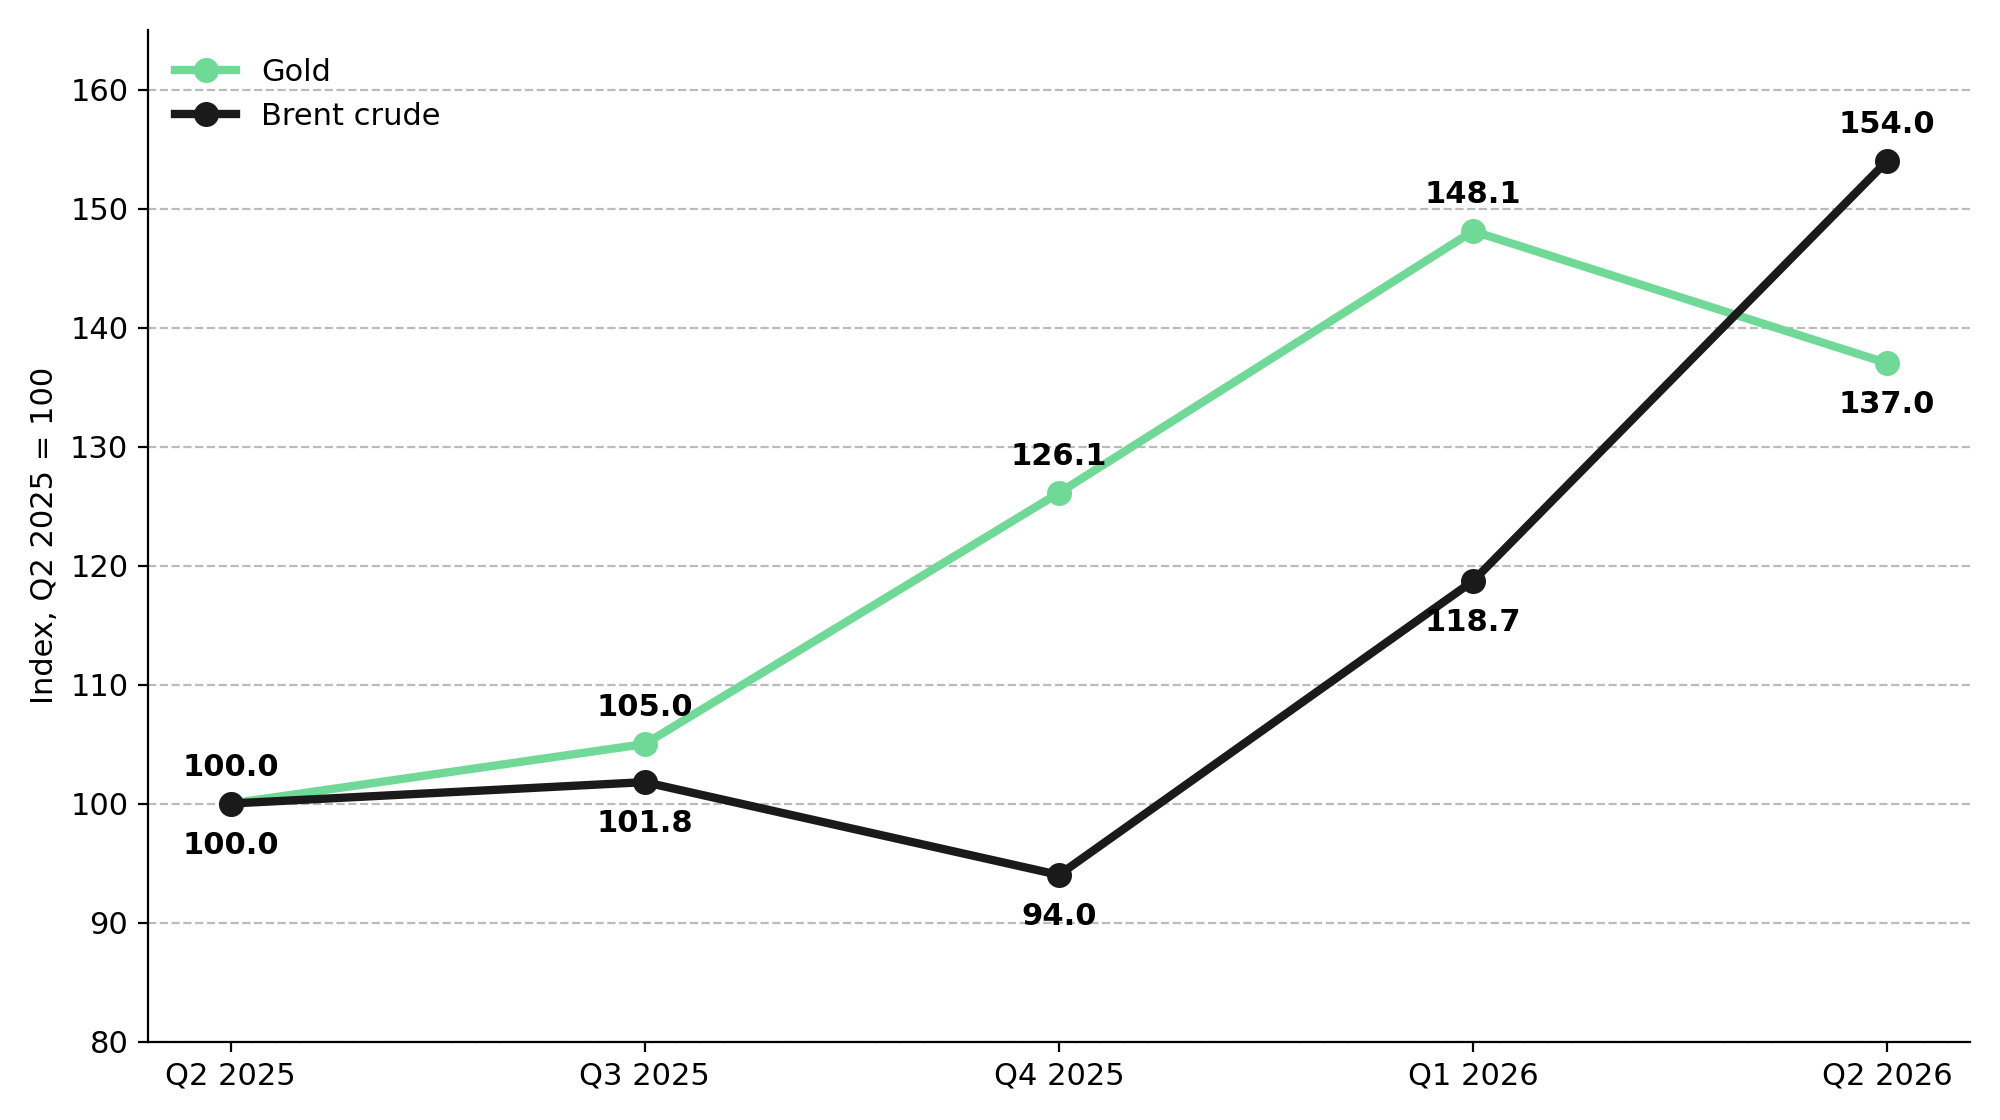
Brent averaged $104.40 a barrel in Q2 2026, up from $63.70 in Q4 2025, while August headline PCE inflation held at 3.4% year over year. The Fed raised its target range to 3.75% to 4.00%, and higher Treasury yields made interest-paying bonds more attractive than gold.
The median Fed projection indicated one more 0.25 percentage point hike this year. John Williams, President of the New York Fed, said one further hike would probably be enough. Before the PCE release, CME FedWatch priced a 45% chance of an October hike and 89% for December. Lower crude prices could reduce inflation pressure and Fed hike expectations, supporting a gold recovery.
Official Gold Demand Slows to 130 Tonnes as Fed Path Sets Gold Price Direction
Central banks reported net gold purchases of about 130 metric tons through July, versus 160 a year earlier, maintaining demand despite slower buying. Paul Brink, President and Chief Executive Officer of Franco-Nevada Corporation, said growth in official gold holdings during Neal Froneman’s chairmanship highlighted gold’s role as a reserve asset.
An October Fed hike could renew selling pressure, with the $4,110.55 September low serving as a downside reference. A hold could support a recovery if bond yields fall. The 16 analysts surveyed by LBMA are targeting an average year-end gold price of $4,500.
Payrolls on October 2 and consumer price index (CPI) inflation on October 14 could reshape rate expectations before the October 28 Fed decision. December hike odds falling below 50%, from 89% before the PCE release, would indicate reduced tightening expectations and could support gold, without confirming a price reversal.
Rate-Driven Gold Price Drop Hits Unhedged Producer Margins Harder Than Diesel Costs
Gold price declines reduce unhedged producers’ revenue per ounce, while higher oil prices raise operating costs. Newmont’s 2026 guidance assumes $70 Brent, with an estimated $11 cost increase per ounce for each $10 rise in oil. Applying that sensitivity to $104.40 Brent would add about $38 per ounce to Newmont’s costs, far less than gold’s September decline of more than $200 per ounce.
At $4,188.17 gold, a $100 price move changes the margin above all-in sustaining costs (AISC) by 4.6% at $2,000 AISC and 5.9% at $2,500 AISC, assuming unchanged costs. Lower-cost producers therefore retain a larger margin cushion during a selloff.
A return to the $3,978.55 annual low would reduce gold by 5.0% and the modeled margin at $2,500 AISC by 12.4%. Smaller positions can limit portfolio exposure to this downside while preserving participation in a gold recovery.
Fed Rate Path, Not Gulf Risk, Now Sets Gold Producer Valuations
Higher oil prices can pressure gold when they lift inflation and Fed hike expectations, making interest-paying assets more attractive. Falling hike expectations could support a recovery even if the Gulf conflict remains unresolved.
Gold prices and operating costs both determine margins, so valuations should test further declines alongside recovery scenarios.
Central banks’ reported net purchases of 130 metric tons through July sustained gold demand. At $4,188.17 gold and $2,000 AISC, the illustrative margin is about $2,188 per ounce before taxes and other costs, giving lower-cost producers a cushion to sustain operations and potentially fund mine development.
Analyst's Notes





Subscribe to Our Channel
.jpg)
.jpg)
Stay Informed