




Fed Risk Leaves Silver 44% Below Peak Despite 46.3Moz Deficit Forecast


Silver’s 46.3Moz deficit meets Fed rate risk, leaving prices 44% below their peak as supply constraints shape silver exposure.
- Silver is entering its sixth consecutive annual deficit, forecast at 46.3 million ounces for 2026, yet spot price remains near 69 dollars per ounce as of August 27, 2026, well below its January 2026 peak above 120 dollars.
- Fed Chair Kevin Warsh delivers his first Jackson Hole keynote on August 28, 2026, 3 weeks before a September 16, 2026, Federal Open Market Committee meeting where markets price roughly 1 in 3 odds of a rate hike rather than a cut.
- Mine supply cannot flex to close the shortfall, since Mexican ore grade decline and Peru's energy-driven concentrate disruptions are multi-year constraints rather than one-quarter events.
- China's silver export licensing regime is tightening access to bullion meeting the London Good Delivery standard, a specification China holds on roughly 70% of that supply, adding weight to permitted, non-Chinese pipelines such as Mexico's.
Sixth Silver Deficit & 74% Byproduct Output Raises Shortfall Risk
The Silver Institute’s World Silver Survey 2026, released on April 15, 2026, forecasts total demand of 1,112.6 million ounces against supply of 1,066.4 million ounces, resulting in a reported deficit of 46.3 million ounces compared with 40.3 million ounces in 2025. The forecast marks a sixth consecutive annual deficit, while silver’s limited supply response increases the risk that the shortfall continues: approximately 74% of mined output is produced as a byproduct of lead, zinc, copper, and gold mines, so production follows the economics and operating plans of those metals rather than silver prices alone.
Mexico’s 5% Silver Output Decline & Copper Credits Reshape Producer Margins
Mexico remained the largest silver-producing country in 2025, but output fell 5% to 172.9 million ounces, its third consecutive annual decline, according to the Silver Institute’s April 15, 2026 World Silver Survey. Operational disruptions, policy changes, and lower grades contributed to a 3% decline in North American production, its lowest level in 10 years.
Americas Gold and Silver’s August 14, 2026 results reported that Cosalá’s cash costs fell 45% to US$16.91 per silver ounce. Higher copper byproduct credits drove the reduction, showing that margins depend partly on copper revenue rather than silver prices alone.
Peru’s Near-50% Silver Concentrate Share & China’s Refinery Supply Risk
The Silver Institute’s April 15, 2026 World Silver Survey reported that Peru produced 130.6 million silver ounces in 2025, up 7% and equal to 15% of global mine output. Chinese customs data showed that Peru supplied 956,000 metric tons of silver-bearing concentrate in 2025, nearly half of China’s imports. A prolonged disruption could therefore reduce feedstock for Chinese refineries, although China’s licensing framework has not yet demonstrated lower refined-silver exports.
Hawkish Fed & Inventory Buffer Hold Silver 44% Below Its Peak
A multi-year silver deficit can support higher prices by drawing down above-ground inventories, but it does not require prices to rise continuously while existing stocks remain available to cover the shortfall. Reuters reported spot silver at US$68.34 per ounce on August 27, 2026, approximately 44% below its January 29 record above US$121, while the Silver Institute’s World Silver Survey 2026 forecasts the annual deficit widening 15% to 46.3 million ounces.
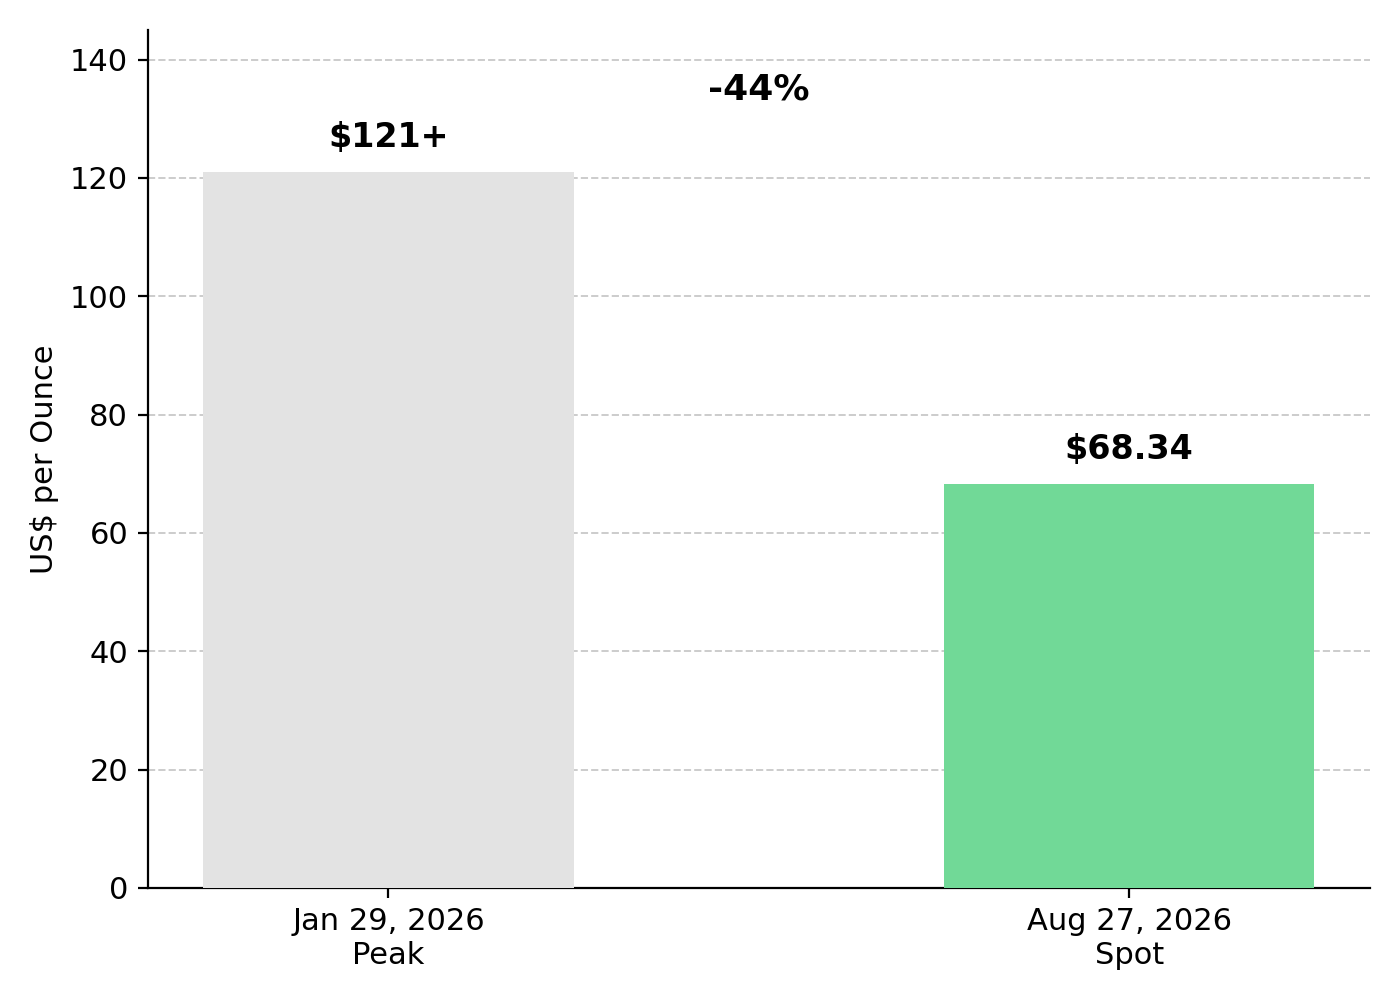
The price decline shows that the annual supply-demand balance has not controlled near-term pricing because available inventories can cover the deficit while Fed policy, real yields, the US dollar, and market positioning determine marginal investment demand.
3.7% Inflation & Jackson Hole Test Silver’s Financial Demand
The Bureau of Economic Analysis reported on August 26 that July PCE inflation reached 3.7%, while core inflation remained at 3.3%, keeping both above the Fed’s 2% goal. The Fed’s July 29 decision held rates at 3.50% to 3.75% by a 9-to-3 vote, while Reuters reported a 36% probability of a September 16 increase.
Kevin Warsh’s August 28 Jackson Hole speech will provide the next policy signal. A 25-basis-point increase would raise silver’s opportunity cost and could strengthen the US dollar, while industrial demand would respond more slowly because purchases depend mainly on production and capital spending.
67.45 Gold-to-Silver Ratio & Central Bank Demand Favor Gold
The gold-to-silver ratio stood at 67.45 on August 26, 2026, showing that gold retained relative strength despite silver’s forecast deficit. Gold benefits from central bank reserve demand, while silver depends more on industrial use, private demand, real yields, and the US dollar.
A falling ratio signals silver outperformance, while a rising ratio indicates continued preference for gold.
Iran Sanctions & Hormuz Risk Test Silver Against Higher Rate Pressure
The US Treasury’s August 24, 2026 campaign expanded secondary-sanctions exposure across Iran’s aviation, digital-asset, gold, shipping, and technology sectors while targeting more than 60 entities, individuals, and vessels. On the same date, Iran threatened fines, detention, and cargo confiscation against 45 tankers accused of violating its Strait of Hormuz transit rules, increasing the risk of further disruption to energy shipments.
The effect on silver is two-sided: further escalation could increase precious-metals demand, but higher energy costs could reinforce inflation and rate-hike expectations, raising the opportunity cost of holding non-yielding silver. Reuters reported on August 27 that spot silver rose 0.4% to US$68.34 while market attention remained centered on Kevin Warsh’s Jackson Hole speech, identifying Fed guidance as the more immediate pricing catalyst.
Silver Deficit & Project Stage Shape Cash Flow, Financing, & Valuation
The forecast 46.3 million-ounce deficit affects silver companies differently because revenue exposure, financing requirements, and technical risk change between exploration, development, and production. A producer can convert higher realized silver prices into operating margins and free cash flow when revenue per ounce rises faster than production and sustaining costs.
A development-stage project gains value when sustained silver prices improve feasibility-study returns and increase the probability that permitting, financing, and construction can proceed. An exploration-stage project remains dependent on drilling to establish grade, continuity, and scale, with its valuation typically discounted until mineralized intercepts support classified resources and a credible development path.
Higher Silver Prices Lift Revenue 71% but US$40.63 AISC Delays Profitability
Americas Gold and Silver’s August 14, 2026 results maintained guidance targeting 3.2 million to 3.6 million silver ounces at an AISC of US$30 to US$35 per ounce. First-half AISC was US$36.92, so meeting guidance requires lower second-half costs. Second-quarter revenue rose 71% to US$46 million, but AISC of US$40.63 and a US$5 million net loss show that higher silver prices had not yet produced net profitability.
The company held US$88.9 million in cash against planned 2026 capital spending of US$90 million to US$120 million, with funding dependent on cash, operating cash flow, or debt. It also settled US$76 million of metal-delivery obligations, reducing debt-service and mark-to-market exposure but issuing approximately 10.6 million shares in the process.
US$1.8B NPV & Permit Timing Define the Path to 2027 Production
Vizsla Silver’s November 12, 2025 feasibility study for Panuco reported a post-tax NPV5% of US$1.8 billion, a 111% IRR, and a seven-month payback based on silver at US$35.50 per ounce and gold at US$3,100 per ounce. The study models annual production of 17.4 million silver-equivalent ounces over an initial 9.4-year mine life. Vizsla submitted its environmental-impact application in February 2025 and is targeting a construction decision in the second half of 2026, subject to permit receipt, detailed engineering, and financing review. With first production targeted for the second half of 2027, permit receipt and the construction decision stand as the next catalysts investors can use to gauge whether the study's NPV and IRR begin converting into realized cash flow on schedule, or whether delays push that conversion further out and keep the project priced on optionality rather than production.
Resource Drilling & Bulk Sampling Test the US$1.02-per-Ounce Valuation
GR Silver Mining’s July 27, 2026 presentation reported an enterprise value of US$1.02 per in-situ silver ounce compared with a company-selected peer average of US$2.58. July drilling extended mineralization at least 150 meters beyond the 2023 San Marcial resource boundary, while a separate May 19 result returned 45.1 meters true width grading 1,623 grams per metric ton silver.
These results remain outside the classified resource, leaving valuation dependent on resource conversion, metallurgy, financing, and project economics. Mexico's environment ministry, SEMARNAT (Secretaría de Medio Ambiente y Recursos Naturales), also confirmed on May 21 that the past-producing Plomosas mine does not require a new environmental authorization for bulk-sample test mining, reducing the permitting work needed to collect operating data but not authorizing full production.
Eric Zaunscherb, Executive Chair, Interim President and Interim Chief Executive Officer of GR Silver Mining, ties the permitting shortcut directly to project value:
"If we proceed with the bulk sample test mining program at Palmarejo and demonstrate to the regulators that we're doing a good job there, then there's an opportunity to make that process for permitting and technical studies for San Sebastian shorter. That obviously has a big impact on the NPV of the project."
46.3Moz Deficit Forecast & Fed Policy Keep Silver’s Price Response Uncertain
The Silver Institute’s World Silver Survey 2026 forecasts a 46.3 million-ounce deficit, but above-ground inventories can cover the shortfall without producing an immediate price increase. Mexico, Peru, and China produced approximately 416 million ounces in 2025, equal to about 49% of global mine output, leaving supply exposed to disruptions across three major jurisdictions.
Kevin Warsh’s August 28 speech and the September 16 Fed decision are the nearest-term catalysts for silver’s financial demand. A hold would support silver only if Fed guidance lowers expected rates and pushes real yields or the US dollar lower, conditions that could reduce the gold-to-silver ratio. A rate increase or restrictive guidance would raise silver’s opportunity cost and could prolong its underperformance relative to gold even if the annual deficit continues.
The Investment Thesis for Silver
- The deficit is a supply side story rather than a demand side one, since roughly 74% of mine output is tied to other metals' economics and will not respond quickly to price alone.
- The Federal Reserve's interest rate decision is the nearest term repricing catalyst, with the Jackson Hole keynote and the September rate decision the two dates most likely to determine whether the gold to silver ratio compresses toward its historical relationship with physical scarcity.
- Jurisdictional concentration in a small number of producing countries raises single-country event risk, a lens through which energy disruption in one country or ore grade decline in another should be read as ongoing supply variables rather than isolated headlines.
- Export licensing in the world's largest refining and consuming market makes permitted, non-Chinese supply strategically relevant, a dynamic that favors jurisdictions with functioning permitting frameworks over unpermitted ground regardless of grade.
- A company's position in the mine development pipeline, exploration, development, or production, determines how a given allocation captures the deficit thesis, since a producer converts it into present-tense cash flow, a developer converts it into feasibility-backed optionality tied to a defined permitting timeline, and an explorer converts it into resource-conversion potential priced at a discount until drilling closes that gap.
The Silver Institute’s World Silver Survey 2026, released on April 15, forecasts a sixth consecutive annual deficit of 46.3 million ounces. Spot silver traded at US$68.34 on August 27, about 44% below its January peak, showing that available inventories, real yields, the US dollar, and positioning continue to outweigh the annual supply gap in near-term pricing. Kevin Warsh’s August 28 keynote and the September 16 Fed decision are the next monetary catalysts, with less restrictive guidance supporting silver and a rate increase extending the pressure on financial demand.
TL;DR
Silver faces a sixth consecutive annual deficit, forecast at 46.3 million ounces in 2026, but spot prices remain 44% below their January peak. Available inventories and concerns about restrictive Fed policy continue to outweigh the supply gap in near-term pricing. Because 74% of mined silver is produced as a byproduct, higher silver prices cannot quickly lift supply. Mexico’s declining output, Peru’s role in Chinese concentrate imports, and China’s export controls increase supply risk. Kevin Warsh’s Jackson Hole speech and the September Fed decision are the next major catalysts, while producers, developers, and explorers offer different exposure to any silver repricing.
FAQs (AI-Generated)
Analyst's Notes





Subscribe to Our Channel





.png)



Stay Informed






