Gold Demand Value Rose 74% Year-on-Year in Q1 2026 While Mine Supply Grew 2%, Expanding Producer Margins and Developer NPVs


Gold demand value hit US$193B in Q1 2026, up 74% year-on-year, while supply grew just 2%, driving the re-rating case for gold producer and developer equities.
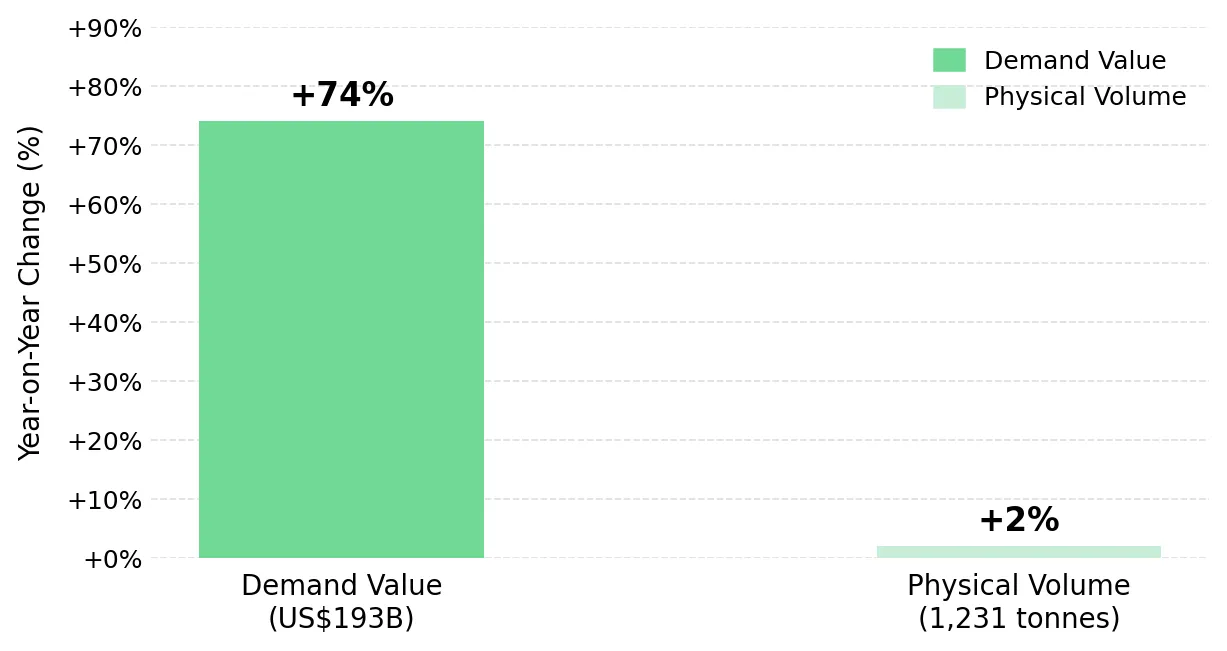
- The World Gold Council's Q1 2026 Gold Demand Trends report records quarterly gold demand value at US$193 billion, a 74% year-on-year increase, while volume grew only 2% to 1,231 tonnes, establishing that price-insensitive institutional demand is absorbing the physical tonnage at a higher price level.
- Mine supply grew 2% year-on-year in Q1 2026, with recycling contributing a 5% uptick, neither sufficient to absorb a demand base that expanded 74% in value over the same period.
- Central banks net purchased 244 tonnes in Q1 2026, the seventeenth consecutive quarter of net official-sector accumulation, reducing the downside price sensitivity of gold equities relative to prior cycles.
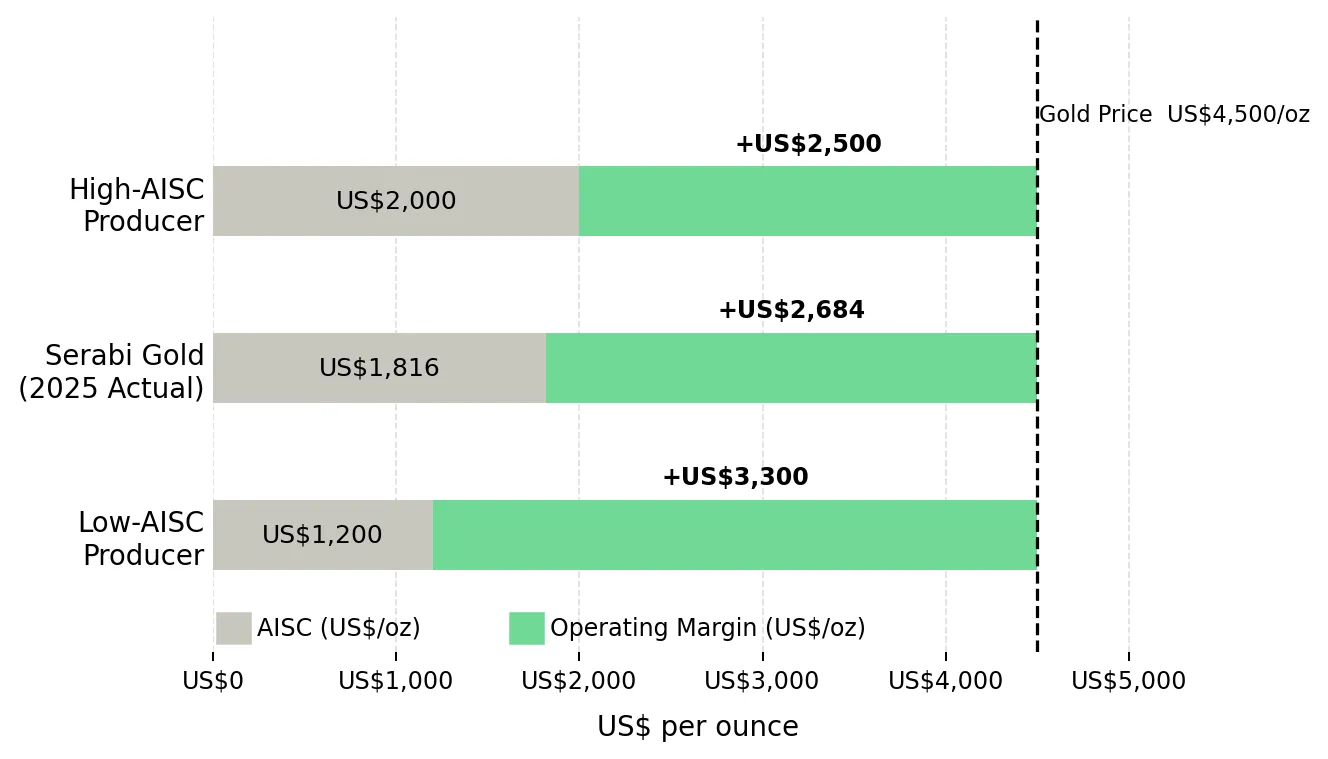
- Producing gold companies with all-in sustaining costs between US$1,400 and US$1,900 per ounce are generating operating margins of US$2,500 to US$3,000 per ounce, sufficient to fund organic growth and inaugural shareholder returns without equity dilution.
- Developers with funded, permitted, or near-production assets carry steep net present value sensitivity to sustained high gold prices, with projects in Nevada and British Columbia's Golden Triangle showing net present value multiples of 2x to 5x current market capitalization at spot gold.
Gold entered May 2026 trading between US$4,518 and US$4,647 per ounce, approximately 17% below its January 29, 2026 all-time high of US$5,595. Hormuz-linked oil inflation held US Consumer Price Index growth at 3.3% year-on-year in March 2026, keeping the Federal Reserve on hold at 3.50% to 3.75% and sustaining elevated real Treasury yields. The World Gold Council's Q1 2026 Gold Demand Trends report shows quarterly gold demand value reached a record US$193 billion on a 74% year-on-year price increase while supply grew only 2%, creating conditions for sustained margin expansion in producer equities and net present value re-rating across the developer segment.
The Demand-Supply Imbalance Is Value-Driven, Not Volume-Driven
Total gold demand, including over-the-counter transactions, reached 1,231 tonnes in Q1 2026, a 2% year-on-year increase, while total supply also reached 1,231 tonnes. On a volume basis, the market appears balanced. On a value basis, demand reached US$193 billion against a London Bullion Market Association average gold price of US$4,873 per ounce, with the same physical tonnage absorbed at prices 74% higher than Q1 2025.
Why Price-Insensitive Buying Signals a Structural Floor
Central banks net purchased 244 tonnes in Q1 2026, 3% above Q1 2025, extending seventeen consecutive quarters of net accumulation. The People's Bank of China made its seventeenth consecutive monthly gold purchase in March 2026, adding 7 tonnes to reach 2,313 tonnes, equivalent to 9% of total reserves. Bar and coin demand reached 474 tonnes, the second-highest quarterly total on record.
Mine Supply Cannot Grow Fast Enough to Close the Gap
The average time from exploration discovery to commercial production is 15 to 20 years for large-scale deposits, and permitting timelines in tier-one jurisdictions add 3 to 10 years. Total gold supply grew 2% year-on-year in Q1 2026, with recycling contributing a 5% uptick.
The Permitting Bottleneck & the Long-Cycle Development Constraint
Nevada, ranked first globally for mining investment attractiveness in the 2025 Fraser Institute Annual Survey, applies Environmental Impact Statement processes for underground projects estimated at three years each. In British Columbia's Golden Triangle, comparable timelines govern large-scale underground development. The duration of gold's price support at current levels is secured by the mining industry's 15-to-20-year development cycle, which prevents supply from absorbing the 74% value-based demand expansion within any near-term planning window.
Operating Leverage Expands Across Gold Producers
Gold producers in established jurisdictions broadly report all-in sustaining costs between US$1,200 and US$2,000 per ounce. At US$4,500 per ounce spot gold, operators at the top of that range generate margins exceeding US$2,500 per ounce, sufficient to fund organic exploration, retire debt, and initiate shareholder returns without accessing equity markets.
Cash Flow at US$4,500 per Ounce & the Dividend Inflection
Serabi Gold reported a full-year 2025 AISC of US$1,816 per ounce against an average realized gold price of US$3,481 per ounce, generating EBITDA of US$77.9 million, a 117% year-on-year increase. That cash flow funded 38,400 meters of brownfield exploration, full debt repayment, and an inaugural annual dividend of 5 pence per share without additional equity issuance. With gold prices approximately US$1,000 per ounce above Serabi's 2025 average, the 2026 margin profile has expanded beyond what the company's equity valuation currently reflects.
Mike Hodgson, Chief Executive Officer of Serabi Gold, describes the capital allocation outcome:
"I don't want to sound arrogant but we're generating so much cash at the moment we can fund it all out of cash flow comfortably. We're not going out looking for more money from investors or raising debt or anything. We've actually just paid off what little bit of debt we had left, which is about $7 million. We just retired that in January."
The Processing Economics Multiplier
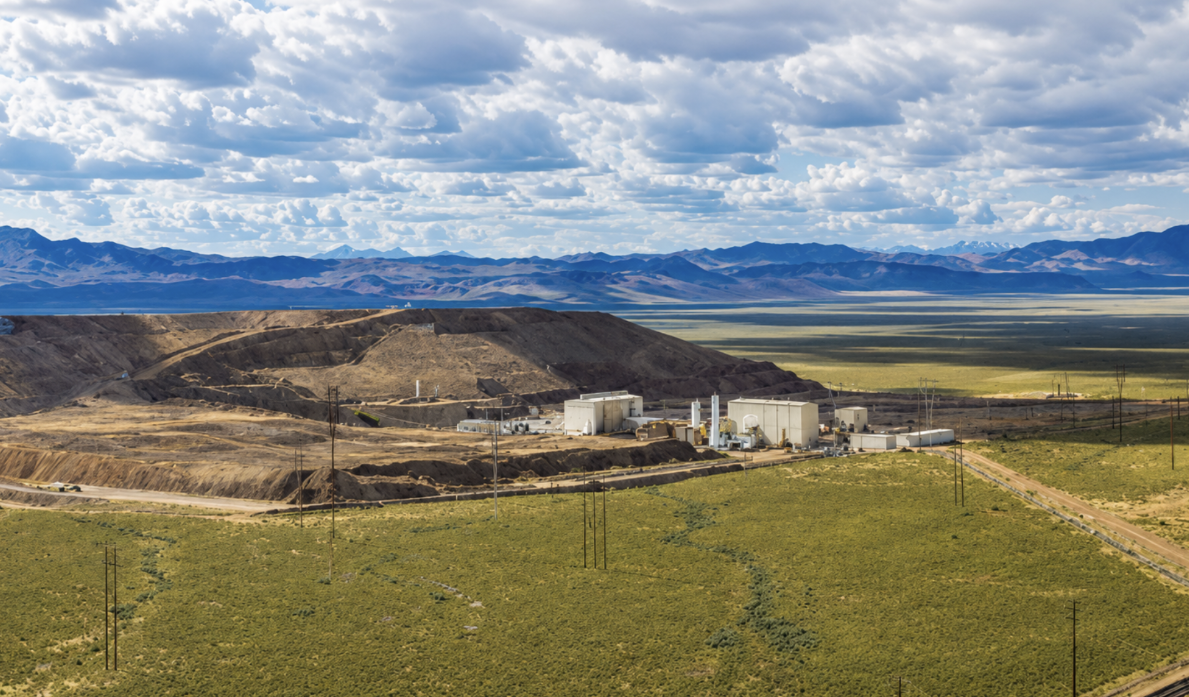
i-80 Gold is advancing the Lone Tree processing plant, an autoclave facility targeting commissioning in late 2027, replacing third-party toll milling at a 55% to 60% payability factor with owner-operated leaching at approximately 92% gold recovery. Its five-asset Nevada portfolio carries an after-tax NPV at a 5% discount rate of US$4.9 billion at US$3,000 per ounce gold.
Paul Chawrun, Chief Operating Officer of i-80 Gold, quantifies the cash flow implication at current gold prices:
"We'll have the Lone Tree plant producing gold by the end of 2027 with a bit of a ramp up in 2028. And in the range of about 150,000, depending on the grade, to maybe 160,000 ounces per year at good margins. So if you take a look at the gold price now, I think we estimated somewhere around 150 to 200 million net cash flow per year once it operates at somewhere in the range of $3,000 gold. And if you take a look at the numbers now, of course, it's much higher than that."
The processing economics argument is independent of the gold price assumption: 92% recovery on the same refractory ore generates more recoverable gold per tonne at any price level. At sustained high gold prices, that processing upgrade and the NPV price sensitivity operate simultaneously, two value levers opening at once.
Higher Gold Prices & Fixed Capital Costs Expand Project NPVs
The net present value (NPV) sensitivity of a development-stage gold project to the gold price is not linear. A US$500 per ounce increase in the long-run gold price assumption can, depending on strip ratio, mine life, and AISC structure, double or triple the after-tax NPV of a project whose capital cost is fixed. This dynamic defines the developer segment when institutional year-end 2026 price targets range from Goldman Sachs's US$5,400 to JPMorgan Global Research's US$6,300 per ounce.
The Valuation Gap & Dual-Commodity Exposure
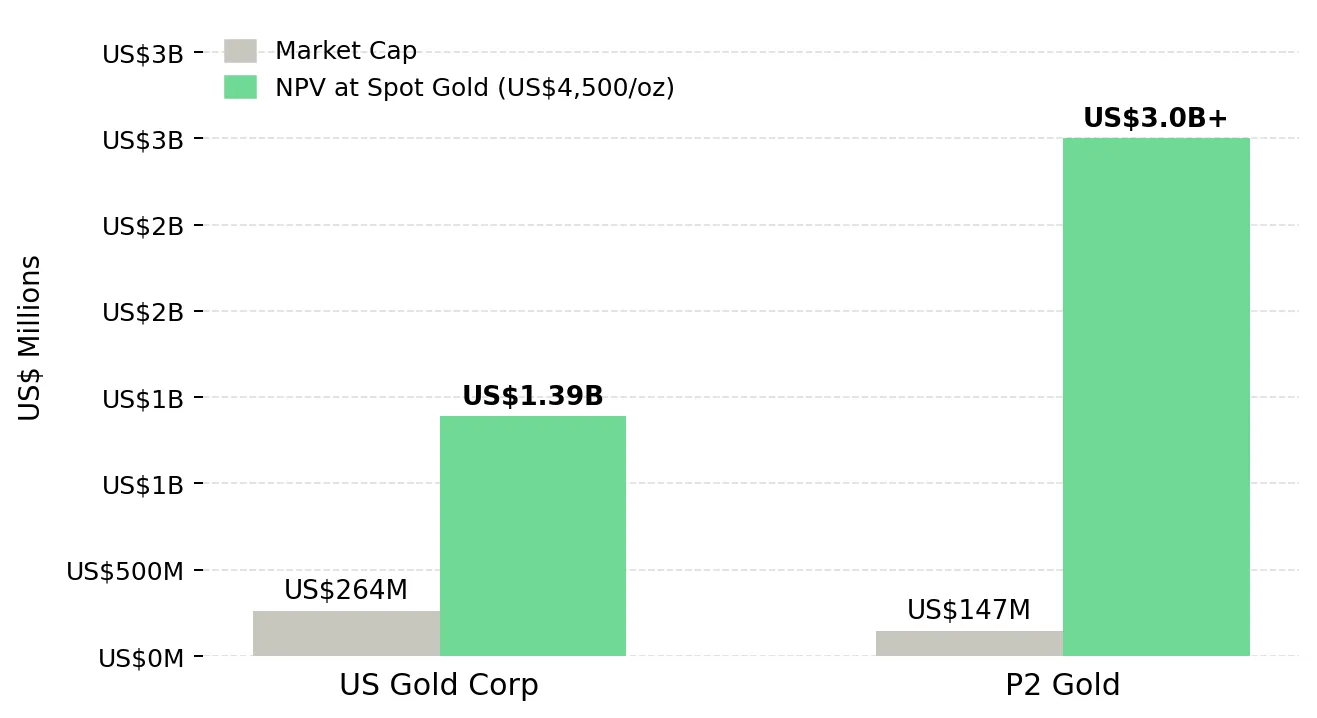
U.S. Gold Corp published a Feasibility Study in March 2026 returning an after-tax NPV at a 5% discount rate of US$632 million at US$3,250 per ounce gold, rising to US$1.39 billion at US$4,500 per ounce, against a market capitalization of US$263.6 million at publication.
Luke Norman, Executive Chairman of U.S. Gold Corp, identifies the condition already attracting acquisition interest:
"When you do go to project financing at this juncture, when you've got a positive definitive feasibility study out, clearly the hawks start circling. They're looking. There are companies interested in M&A activity or pure takeouts on the project."
P2 Gold adds dual-commodity exposure to the NPV leverage argument. The company's October 2025 Preliminary Economic Assessment outlines 109,000 ounces of gold and 15,000 tonnes of copper annually over a 14.2-year mine life, with a Feasibility Study targeting Q4 2026. Copper by-product credits compress AISC below the headline gold figure, increasing margin resilience relative to single-commodity peers.
Joseph Ovsenek, President and Chief Executive Officer of P2 Gold, contextualizes the project's economics at current spot conditions:
"If you look at spot prices right now, our rate of return is over 100%. Our NPV5 is 3 billion plus. Our NPV15 is around 1.5 billion. So, very robust."
Tier-1 Scale Deposits & the Preliminary Economic Assessment as a Value Anchor
Tudor Gold Corp hosts the Goldstorm Deposit with Indicated Mineral Resources of 24.9 million ounces of gold at 0.85 grams per tonne, 148.7 million ounces of silver, and 3.048 billion pounds of copper (Treaty Creek NI 43-101 Technical Report, 2025). A Preliminary Economic Assessment targeting 8,000 to 10,000 tonnes per day underground is advancing toward completion in summer 2026.
Joseph Ovsenek, President and Chief Executive Officer of Tudor Gold, outlines the parallel exploration track:
"This summer, we have a big program, 10 to 15,000 meters of drilling, where we're going to focus on these other potential deposits. We want to come up with a maiden resource from this summer's work for another deposit on our ground, just to show the potential that hey, we've got room for multiple deposits on our Treaty Creek project as well. So lots of upside potential. I don't think that's baked into our share price yet either."
The Investment Thesis for Gold
- Gold demand value grew 74% year-on-year to US$193 billion in Q1 2026 while mine supply grew 2%, establishing an imbalance that the mining industry's 15-to-20-year development cycle cannot close within any near-term supply response window, providing price support across the producer, developer, and explorer segments of the gold equity complex.
- Central bank net purchasing of 244 tonnes in Q1 2026, the seventeenth consecutive quarter of net accumulation at progressively higher prices, establishes a price-insensitive institutional buyer base that reduces the downside sensitivity of gold equities relative to prior cycles when official-sector demand was absent or in net-sale territory.
- Producers with AISC below US$2,000 per ounce are generating operating margins exceeding US$2,500 per ounce at current gold prices, funding exploration, capacity expansion, and inaugural shareholder returns simultaneously without equity dilution, removing the capital risk premium that historically constrained producer equity valuations at this stage of the gold price cycle.
- Developers with permitted projects in Nevada and British Columbia's Golden Triangle are advancing toward first production events in 2027 to 2029, a timeline aligned with the sustained demand-supply imbalance that secures Net Present Value multiples of 2x to 5x current market capitalization at spot gold.
- Explorers advancing large-scale polymetallic deposits toward Preliminary Economic Assessments in stable jurisdictions are approaching the value-definition milestones that convert geological resources into economic mine plans, narrowing the discount at which undeveloped ounces trade relative to producing equivalents at a moment when the replacement cost of future production is rising.
- Development-stage projects with completed feasibility studies, funded construction plans, and no royalty obligations are eliminating the principal risk premiums that justify discounts to net present value, creating conditions where project finance capital and strategic acquirers are positioned to determine value before public equity markets fully reflect it.
The gold price correction of early 2026, driven by Hormuz-linked oil inflation, Federal Reserve rate holds, and Western exchange-traded fund outflows, has concentrated investor attention on the near-term factors suppressing gold's price. That focus is accurate in the short term, but it does not account for is the supply constraint that the demand of US$193 billion per quarter is running against: a mine production pipeline growing at 2% annually, subject to permitting timelines of 3 to 10 years and development cycles averaging 15 to 20 years. Producers generating margins exceeding US$2,500 per ounce, developers building toward first production events with funded capital stacks, and explorers advancing large-scale deposits toward formal economic assessment all operate within the same condition. Equity markets have priced the near-term factors suppressing gold's price precisely. The supply constraint that underpins the gold price at current levels is priced considerably less and that is where the fundamental investment case for gold equities resides in 2026.
TL;DR
The World Gold Council's Q1 2026 Gold Demand Trends report confirms that quarterly gold demand value reached a record US$193 billion while total mine supply grew just 2%, a structural imbalance that no near-term supply response can close given the 15-to-20-year development cycle governing new large-scale production. Producers with all-in sustaining costs below US$2,000 per ounce are generating margins exceeding US$2,500 per ounce at current gold prices, funding organic growth, debt repayment, and inaugural dividends simultaneously without equity dilution. Developers with permitted and funded projects in Nevada and British Columbia's Golden Triangle carry net present value multiples of 2x to 5x current market capitalization at spot gold. Equity markets have priced the near-term headwinds from elevated real yields and Western exchange-traded fund outflows. The structural supply constraint remains the market's least-priced variable.
FAQs (AI-Generated)
Analyst's Notes


Subscribe to Our Channel


Stay Informed