

Gold’s Selloff Puts Low-Cost Producers in Focus Amid Oil-Driven Fed Hike Bets


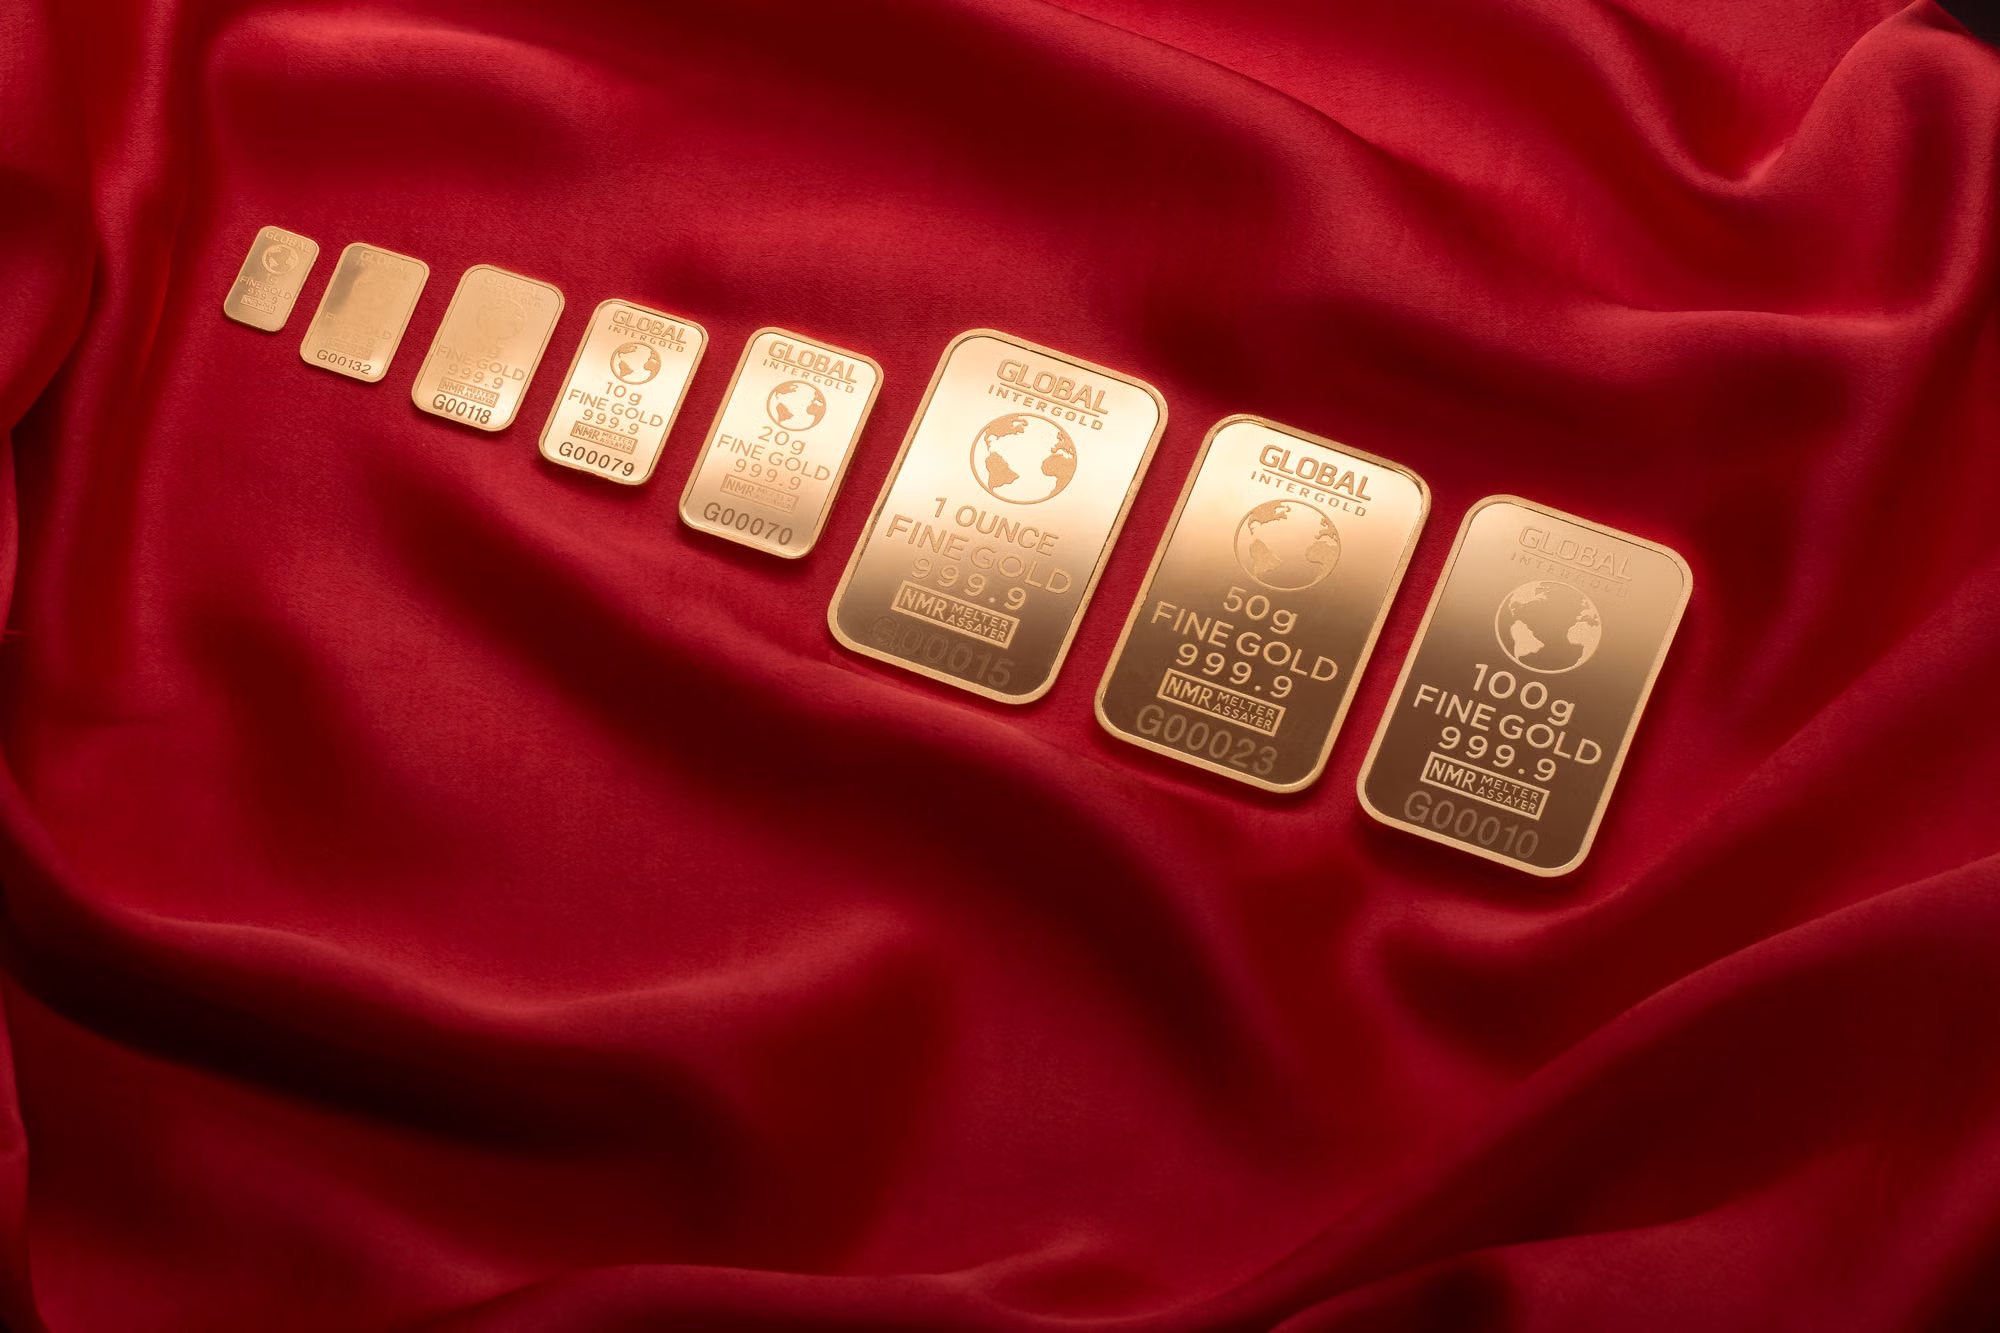
Cash generation at US$3,800 gold tests whether miners can cover debt and capital needs without relying on an immediate price rebound.
- Spot gold rose 0.6% to US$3,899.29/oz on November 2, following a 3.6% fall to its lowest level since October 2025.
- Iran war supply disruptions raise oil and inflation pressures, supporting bets on further Fed hikes through Q1 2027 after September’s increase.
- An Iran agreement that lowers oil prices could support gold above US$4,000/oz; a December Fed hike could renew pressure toward US$3,800/oz.
- Iran talks, the November 3 midterms and the December 8-9 Fed decision could change oil and rate expectations, exposing positions concentrated on one outcome to losses.
- A weekly close above US$4,000/oz, lost on October 30, would strengthen the revenue recovery case for producers selling gold without price hedges.
Forced Selling Lowers Gold’s Entry Price Below Its Q3 Range
Spot gold rebounded 0.6% to US$3,899.29 per ounce after the previous session’s 3.6% fall to its lowest level since October 2025. Oil fell more than 4% as Iranian and Qatari officials discussed ending the US-Israeli war on Iran, while the dollar index dropped 0.5% to 101.45, making gold cheaper for buyers using other currencies.
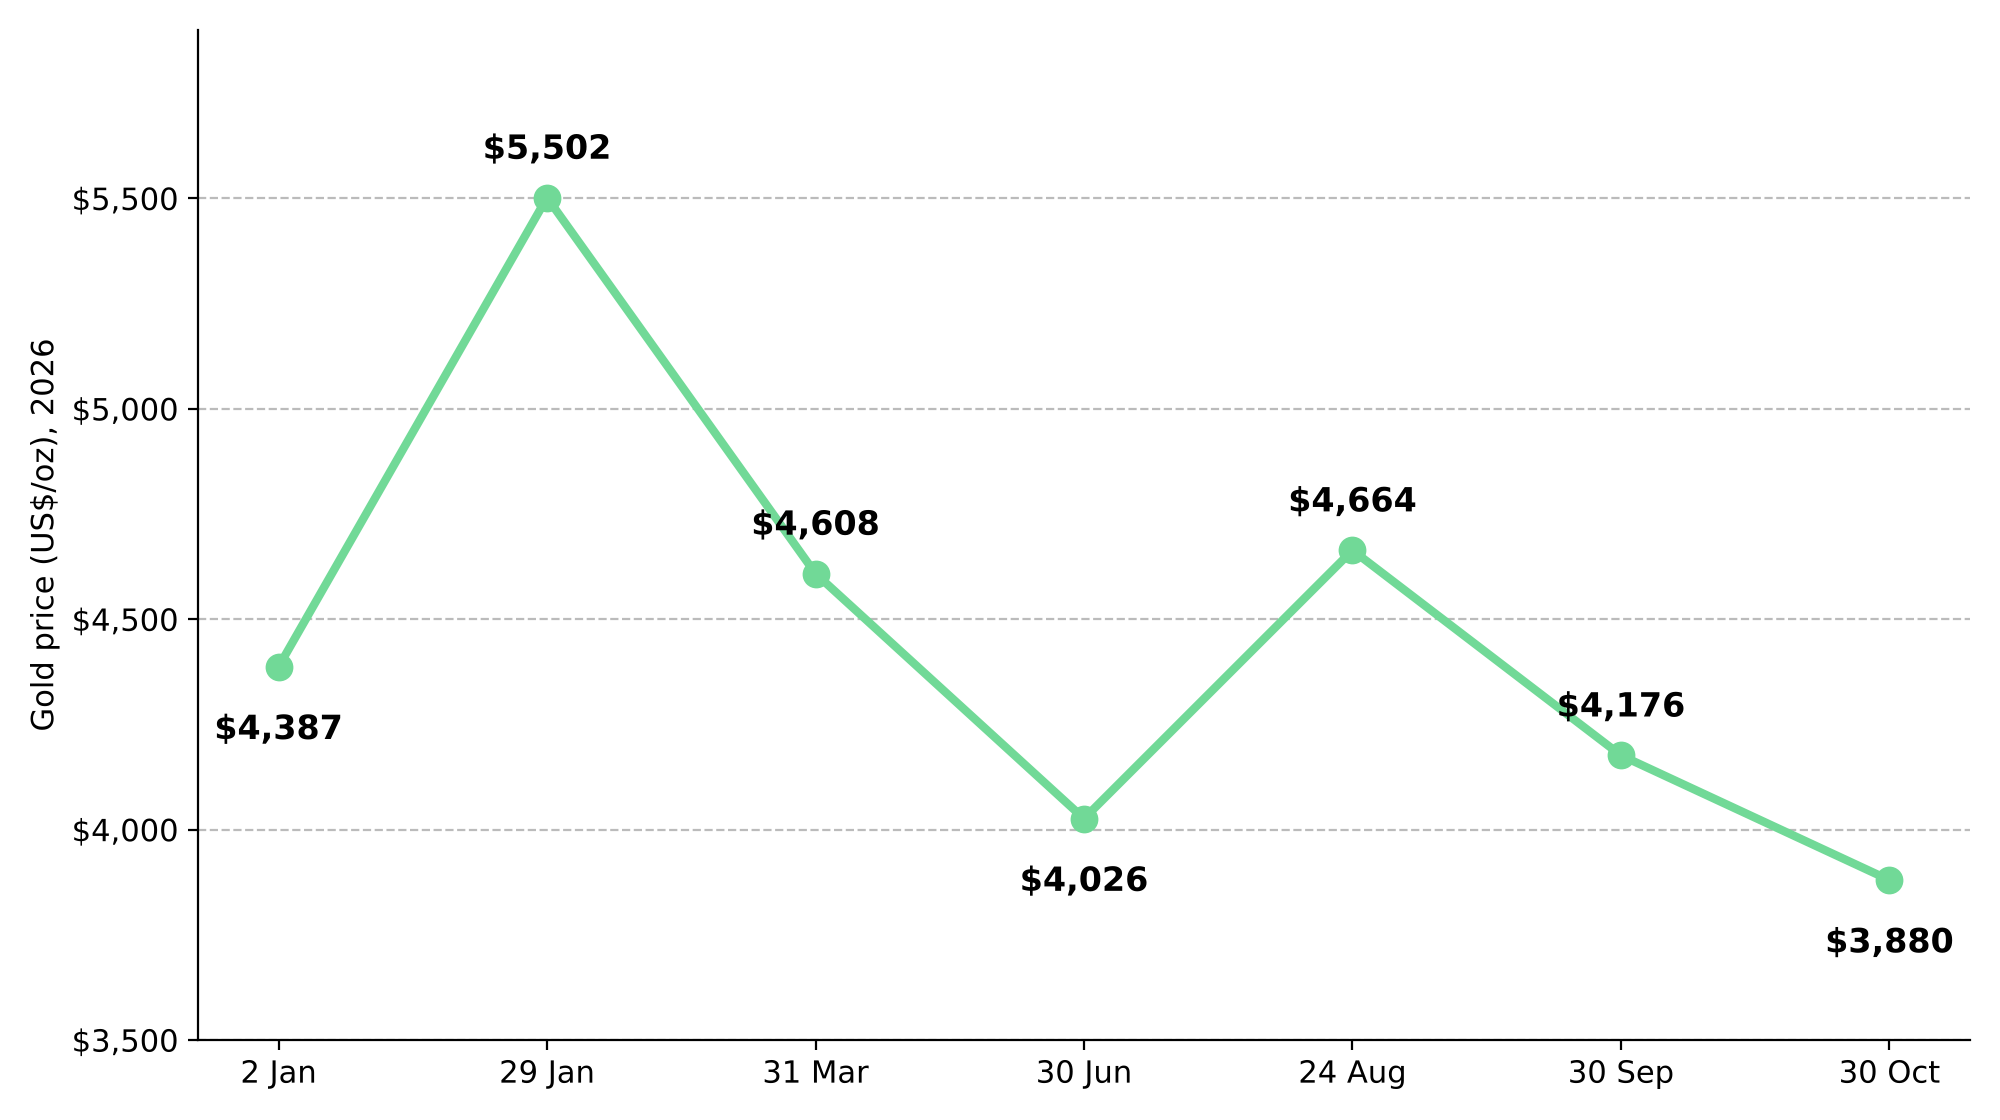
Spot gold trades about 2% below the Q3 LBMA low of US$3,978.55 and 6.6% below the quarter-end price of US$4,176.30. A recovery to that closing benchmark would add approximately US$277 in revenue per unhedged ounce sold, assuming sales prices track spot.
Oil-Driven Inflation Reinforces Fed Hike Pressure on Gold
Hormuz tanker attacks and the Iran war kept oil prices elevated, adding to US inflation pressure. The Fed held rates at 3.75%-4.00% after September’s 25-basis-point increase, while annualized Q3 GDP growth of 3.4% reduced pressure to cut. Further hikes would make interest-paying assets more competitive with gold, which pays no income.
Gold also fell during the technology and AI stock selloff despite lower Treasury yields and a weaker dollar, as holders raised cash to cover losses elsewhere. Waleed Said, Technical Analyst at GivTrade, explained that gold’s ready availability for sale made it an early source of cash for meeting margin calls, or demands for additional funds against trading positions.
An Iran Deal Could Support Gold Above US$4,000
Gold’s rebound reflected hopes of an Iran agreement, leaving it vulnerable if talks fail to reduce oil supply risks. Nikos Tzabouras, Independent Financial Markets Analyst, cautioned that the recovery could be short-lived.
For producers selling without price hedges, an agreement that lowers oil prices could reduce Fed hike pressure and support gold above US$4,000 per ounce. If talks stall and oil rises, renewed hike expectations could pressure gold. A test of Said’s US$3,800 support level would reduce revenue by approximately US$99 per unhedged ounce sold from the quoted spot price, assuming sales track spot.
Upcoming US jobs and inflation reports could reshape rate expectations before the December 8-9 Fed decision. A weekly spot close above US$4,000 would strengthen the revenue recovery case for unhedged producers, particularly if accompanied by lower oil prices and reduced rate-hike expectations.
Lower Bullion Prices Favor Producers That Can Preserve Cash
The quoted spot price is US$277 per ounce, or 6.6%, below the LBMA Q3 close, implying lower unhedged revenue if sales track those benchmarks. If costs remain unchanged, higher-cost producers lose a larger share of their margin.
At US$3,800 gold, stronger producers retain cash after sustaining costs, taxes, debt payments and committed growth spending. Deferring discretionary projects can preserve cash where output remains unaffected. This assessment requires current cost estimates, since Q3 figures may not capture changes in fuel costs or production.
Gold-mining shares can fall alongside technology stocks when both face forced selling, while fixed costs can amplify miners’ earnings declines. The World Gold Council and Boston Consulting Group’s digital-gold report models 27% annual market growth through 2031, assuming unchanged gold prices, stronger protections, wider access and competitive costs. That could expand gold’s buyer base over time, while low costs and manageable debt help producers withstand near-term price weakness.
Selloff Could Reveal Undervalued Low-Cost Producers
Oil-driven Fed hike bets and forced selling have pressured gold, making producer costs, debt and share valuations central to the opportunity. Lower oil prices could support a recovery above US$4,000, improving unhedged revenue.
The stronger contrarian case lies in shares priced for prolonged weakness where US$3,800 gold still leaves cash after operating costs, debt payments and essential capital spending. Wider digital access could add longer-term demand as protections improve and costs become competitive, while financial resilience reduces reliance on an immediate price rebound.
Analyst's Notes





Subscribe to Our Channel







Stay Informed