




Treasury Buybacks Support $68 Silver as Sixth Straight Deficit Tightens Supply



Silver nears $68 as Treasury buybacks support prices, while a sixth straight deficit and supply risks keep the physical market tight.
- Spot silver traded near $68 per ounce this week, extending a third consecutive weekly gain after the US Treasury announced it would raise its long-bond buyback ceiling from $2 billion to at least $4 billion per operation, a move that can lower long-end yields and reduce the opportunity cost of holding non-yielding silver.
- The Fed’s July 28 to 29 meeting minutes, released August 19, 2026, showed a 9 to 3 vote to hold rates steady, with three regional bank presidents favoring a hike, making the August 28 Jackson Hole symposium a near-term test because firmer rate expectations could pressure non-yielding silver.
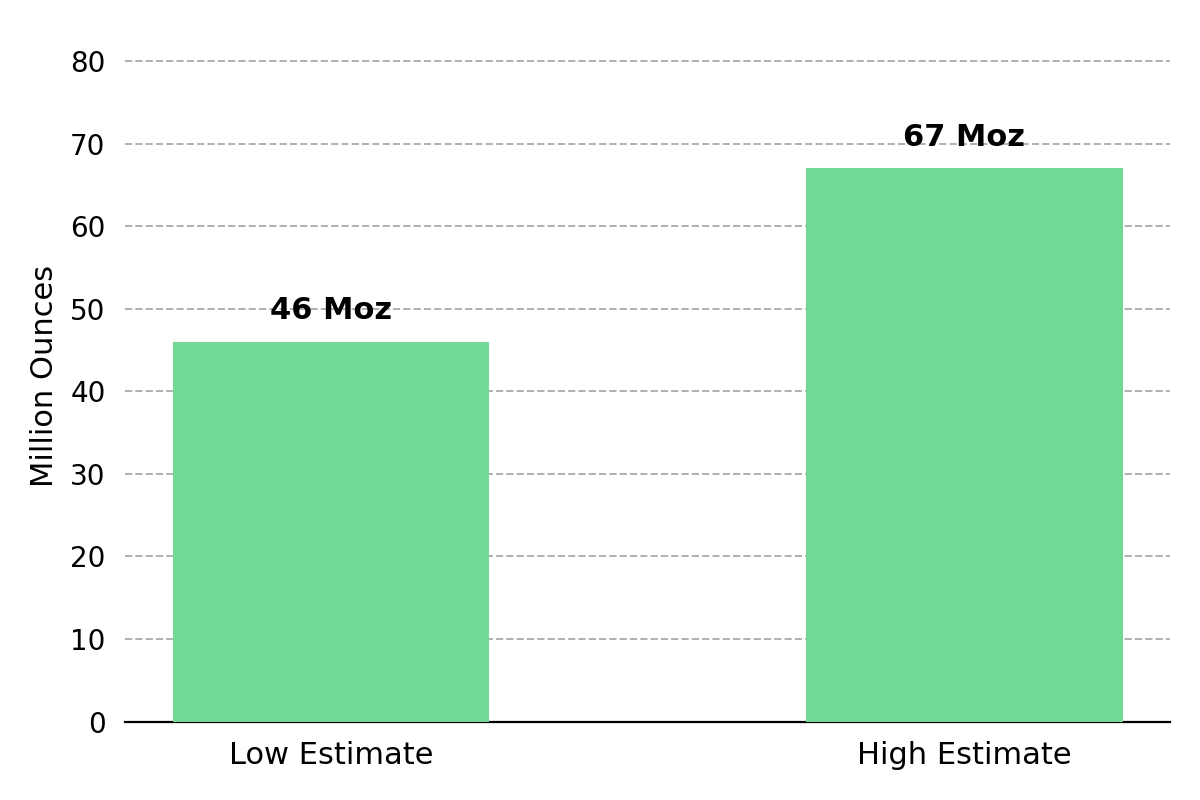
- The Silver Institute and Metals Focus project a sixth consecutive annual silver deficit in 2026, with published estimates ranging from roughly 46 to 67 million ounces, while COMEX registered stocks stood at 99.5 million ounces on August 19, leaving a limited delivery-ready buffer if physical demand rises.
- China’s January 1 silver export licensing regime restricts the pool of exporters, an August blockade suspended operations at Endeavour Silver’s Terronera mine in Mexico, and Peru’s energy crisis threatens roughly 130 million ounces of annual domestic output, creating supply risks independent of Fed policy.
- Producers remain constrained by operating costs, developers depend on permitting and construction milestones to convert resources into production, and explorers depend on discovery efficiency to justify additional capital.
Treasury Buybacks Support $68 Silver as Hawkish Fed Signals Test Rally
Silver moved above $68 per ounce this week after the US Treasury expanded its planned long-duration bond buybacks, linking the near-term rally to interest-rate conditions rather than a new mining-sector development. On August 19, 2026, the US Department of the Treasury announced it would at least double the ceiling for liquidity-support buybacks of 10-to-20-year and 20-to-30-year securities from $2 billion to at least $4 billion per operation, effective September 9 through the November 4, 2026 refunding. The announcement followed a rise in the 30-year Treasury yield to 5.33% on August 18, its highest level since June 2007, which increased the relative appeal of interest-bearing government debt over non-yielding silver.
Lower long-end Treasury yields reduce the opportunity cost of holding non-yielding silver relative to government bonds, so any decline in yields following the buyback announcement can support silver prices by narrowing the return advantage of fixed-income assets.
The Fed’s July meeting minutes introduced a counterweight to the Treasury-driven support for silver by showing greater support for tighter monetary policy. The Fed’s July 28 to 29 meeting minutes, released August 19, 2026, showed a 9 to 3 vote to hold rates steady, with three regional bank presidents favoring a hike, indicating greater support for tighter policy than a unanimous hold would have signaled. The minutes also stated that many participants viewed additional tightening as necessary if inflation failed to decline, reinforcing the risk of higher-for-longer rates that would increase the opportunity cost of holding non-yielding silver. A more hawkish Fed signal at the August 28 Jackson Hole symposium could lift rate expectations and pressure non-yielding silver, making the event the nearest test of whether the rally can hold against tighter monetary-policy expectations.
Sixth Silver Deficit & Supply Risks Keep Physical Market Tight
Silver’s physical deficit predates the Treasury announcement, so the current rally cannot be assessed from bond-market conditions alone. The Silver Institute and Metals Focus project a sixth consecutive annual silver deficit in 2026, with estimates published during the year ranging from roughly 46 to 67 million ounces as supply-and-demand assumptions were updated. Although the projected deficit size has changed across updates, each cited estimate still leaves silver demand above supply for a sixth consecutive year.
As of August 19, 2026, COMEX-approved warehouses held 337.3 million ounces of silver, including 99.5 million ounces registered for delivery against futures contracts, an increase of 1.1 million ounces from the prior report. Because registered inventory represents metal available for futures delivery, a decline from the current 99.5 million ounces would reduce the buffer available to meet higher delivery demand and could increase sensitivity to physical buying.
Supply restrictions in China and operating risks in Mexico and Peru add pressures that are independent of US interest-rate policy. China’s silver export licensing regime, effective January 1, 2026, limits exports to approved companies, reducing the number of firms able to ship silver abroad and creating a supply constraint independent of mine output or US monetary policy. Endeavour Silver disclosed on August 16, 2026, that operations at its Terronera mine in Jalisco, Mexico, had been suspended since August 12 after a community blockade, temporarily removing production from a newly operating silver mine. Peru’s energy constraints and extended informal-mining formalization process add separate operating risks in a country producing roughly 130 million ounces of silver annually, meaning disruptions there could affect a meaningful source of global mine supply.
Silver Deficit Highlights Different Value Drivers Across Mining Stages
A six-year silver deficit has different implications across the value chain. Producers must convert higher prices into margins, developers depend on feasibility, financing, and permitting milestones, and explorers rely on drill results and capital efficiency.
Higher Output Cuts Site Costs, but AISC & By-Product Supply Limit Growth
Americas Gold and Silver reported second quarter 2026 revenue of $46 million, up 71% year over year, while Cosalá silver production rose 26% to approximately 337,000 ounces. Higher grades and recoveries from the EC120 orebody, which entered commercial production effective January 1, 2026, supported the increase. Cash costs at Cosalá fell to $16.91 per ounce from $30.61 per ounce in the prior-year period, aided by higher copper by-product credits. Yet consolidated all-in sustaining cost (AISC) averaged $36.92 per ounce in the first half of 2026, above the company’s full-year guidance range of $30 to $35 per ounce. Despite higher Cosalá production and lower site-level cash costs, first-half AISC remained above guidance, limiting how much higher silver prices translated into improved consolidated margins.
Oliver Turner, Executive Vice President of Corporate Development at Americas Gold and Silver, highlighted how rising industrial demand and supply constraints are contributing to the silver deficit:
"As everybody's heard in the silver space, we've had six years now of a structural deficit, about 150 to 200 million ounces a year. But even if we have this additional demand, where's the additional silver going to come from? Seventy percent of silver is a byproduct from other mines, a significant portion of that being copper mines. Copper mines are now constrained because of sulfuric acid supply due to the Strait of Hormuz."
Strong Project Economics Still Depend on Financing & Permitting
Vizsla Silver, advancing its 100%-owned Panuco silver-gold project in Sinaloa, Mexico, illustrates how development-stage value depends on project economics, financing, and permitting rather than current production. The November 2025 feasibility study estimated a post-tax NPV at a 5% discount rate of $1.8 billion, an IRR of 111%, and a seven-month payback period using a $35.50 per ounce silver price. The company reports $457 million in total financing capacity against initial capital expenditure of $238.7 million, providing funding coverage of roughly 1.9 times the feasibility-study requirement.
The company submitted its Manifestación de Impacto Ambiental (MIA) in February 2025 and is targeting approval in the second half of 2026. Vizsla has said a construction decision would follow permit receipt, with first silver production targeted for the second half of 2027.
High-Grade Drilling & Existing Workings Support 80% Prospective Perimeter
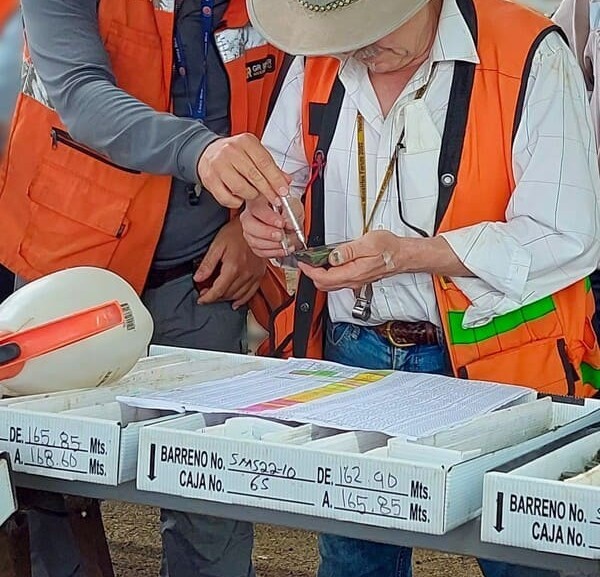
GR Silver Mining represents the earliest stage of the value chain, where the deficit is rewarding discovery efficiency over gross resource inventory. At the company's San Marcial target, adjacent to the past-producing Plomosas Mine on the Sinaloa-Durango border in Mexico, a step-out drill hole released May 19, 2026 intersected 45.1 meters true width grading 1,623 grams per tonne silver, including a high-grade core of 8.25 meters true width grading 8,579 grams per tonne silver. The company is currently executing a 20,000 meter drill program with three rigs active, funded by C$27.5 million in cash and zero debt as of March 31, 2026. A mineral resource estimate update and preliminary economic assessment (PEA) are both targeted for the first half of 2027.
Part of that timeline compression comes from reusing Plomosas' existing 7.4 kilometers of permitted underground workings, after Mexico's environmental regulator, SEMARNAT, ruled on May 21, 2026 that no new environmental permit was required for a planned pilot plant, a decision that removes a permitting variable that would otherwise apply to a greenfield concession.
Eric Zaunscherb, President and Chief Executive Officer of GR Silver Mining, put the scale of the remaining exploration target in context:
"We've only covered about 20% of the perimeter of that intrusive, so the other 80% of the perimeter of the intrusive is prospective."
Fed Signals & Physical Supply Data Test Silver’s Deficit Thesis
The rate-driven rally and the longer-running physical deficit can be tested separately through Fed policy signals and physical-market data. If falling long-end yields drove most of this week’s gains, a more hawkish Fed signal should raise rate expectations and increase near-term pressure on silver. The August 28 Jackson Hole keynote is the nearest policy test: a hawkish signal consistent with the three July dissenters could lift rate and dollar expectations, pressuring non-yielding silver, while a neutral or dovish signal would reduce that near-term headwind.
The physical-deficit thesis can be tested separately through COMEX inventories and supply developments outside US monetary policy. COMEX registered stocks stood at 99.5 million ounces against 337.3 million ounces of total inventory on August 19, and a sustained decline in registered metal would reduce the inventory available for futures delivery, strengthening evidence of physical-market tightness independent of interest rates. Chinese silver export volumes under the licensing regime and the duration of Peru’s energy constraints provide two additional supply indicators, since lower exports or prolonged disruptions would tighten availability independently of Fed policy.
The Investment Thesis for Silver
- A sixth consecutive annual deficit and 99.5 million ounces of COMEX registered inventory show that physical-market tightness predates this month’s rate-driven rally and cannot be explained by Fed policy alone.
- China’s export licensing regime, the Terronera suspension in Mexico, and operating risks in Peru add supply pressures outside monetary policy, helping distinguish physical-market constraints from the effects of interest rates.
- Producer-stage economics show that higher grades and by-product credits can reduce site-level costs without guaranteeing lower consolidated AISC, limiting how fully higher silver prices translate into margins.
- Developer-stage economics show that strong feasibility metrics must still be converted into permits, financing, and construction before a project can reach production.
- Explorer-stage economics show why drill results and capital efficiency matter before a resource update or economic study can establish project value.
- Jackson Hole on August 28 is the nearest test of the rally’s rate-driven component, while COMEX registered stocks at 99.5 million ounces, Chinese silver exports, and Peru’s supply risks provide separate indicators of physical-market tightness.
Falling long-end yields and the six-year physical deficit can support silver prices at the same time. A hawkish Jackson Hole signal could pressure silver in the near term even if the physical deficit remains, helping separate the rate-sensitive portion of the rally from longer-term supply tightness. Fed signals, COMEX registered stocks, Chinese silver exports, and supply conditions in Peru will provide clearer evidence than price alone of whether silver’s next move is being driven by rates or a deficit now in its sixth consecutive year.
TL;DR
Silver moved near $68 after the US Treasury expanded long-bond buybacks, but the rally faces a near-term test from the Fed’s hawkish July minutes and August 28 Jackson Hole remarks. The physical market remains tight, with a sixth consecutive annual deficit projected at roughly 46 to 67 million ounces and COMEX registered stocks at 99.5 million ounces. China’s export licensing regime, Mexico’s Terronera suspension, and operating risks in Peru add supply pressure outside monetary policy. Across the value chain, producers still face cost pressure, developers depend on financing and permitting, and explorers rely on drill results and capital efficiency. Fed signals and physical supply data will help determine whether silver’s next move is rate-driven or deficit-led.
FAQs (AI-Generated)
Analyst's Notes





Subscribe to Our Channel






%20(1)%20(1).jpg)


Stay Informed






