TRX Gold at 0.39x Price to Net Asset Value: What Closes the Gap


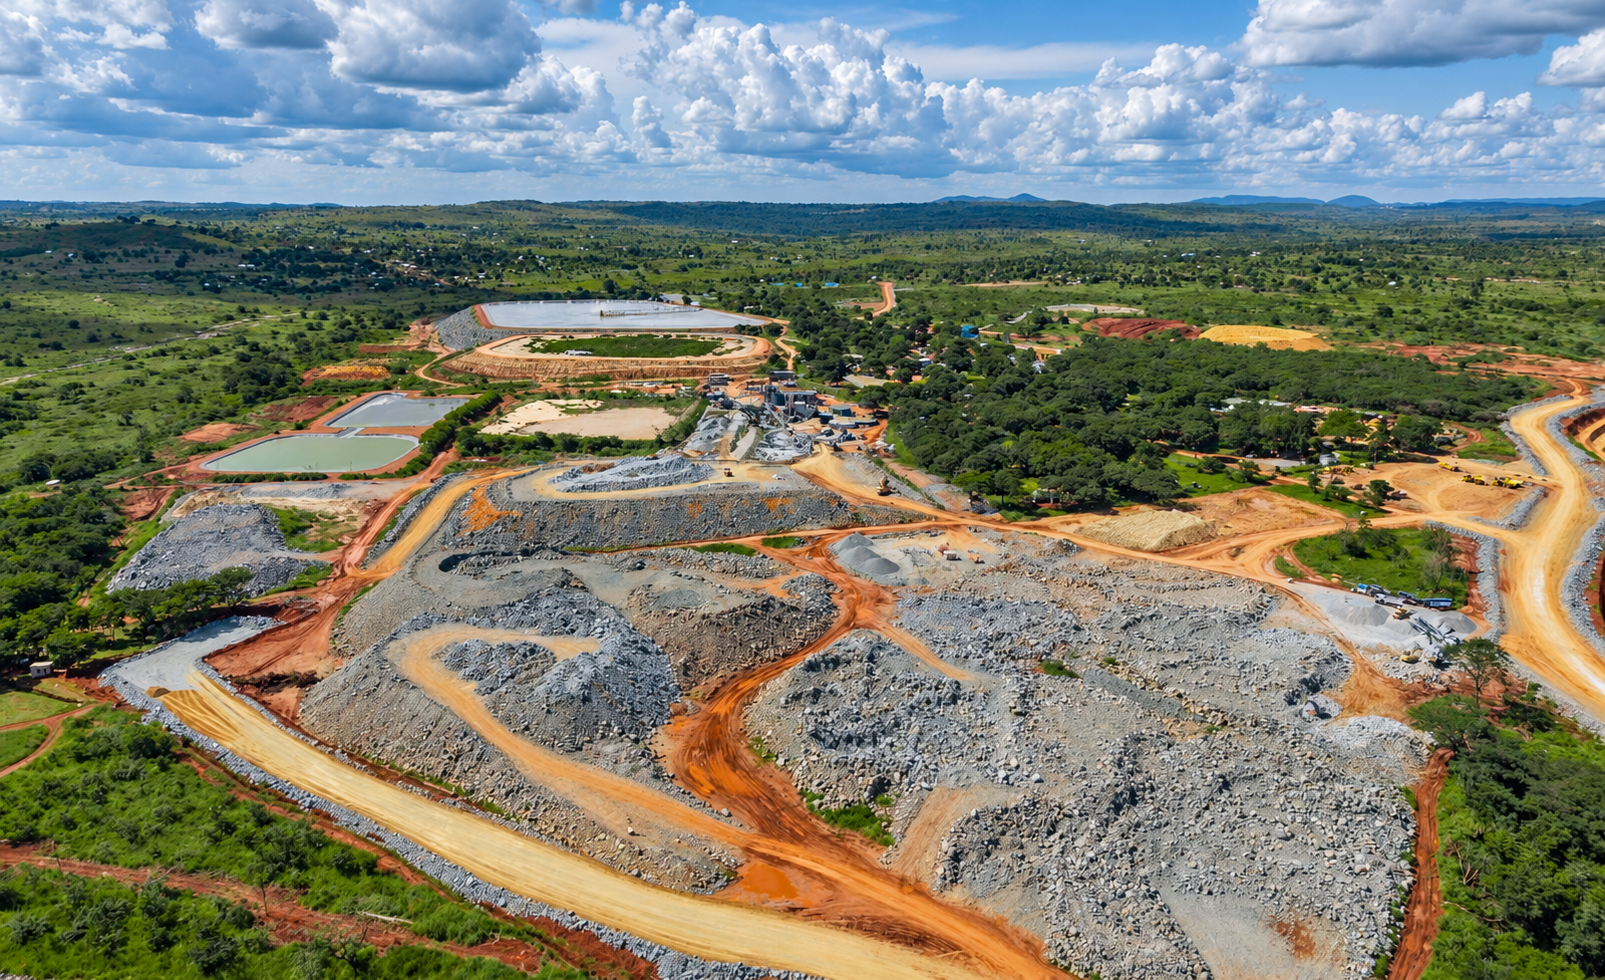
TRX Gold screened at 0.39x price to NAV versus a 0.50x peer average while self-funding a 5,500 tonnes per day expansion. The fourth-quarter PEA update is the test.
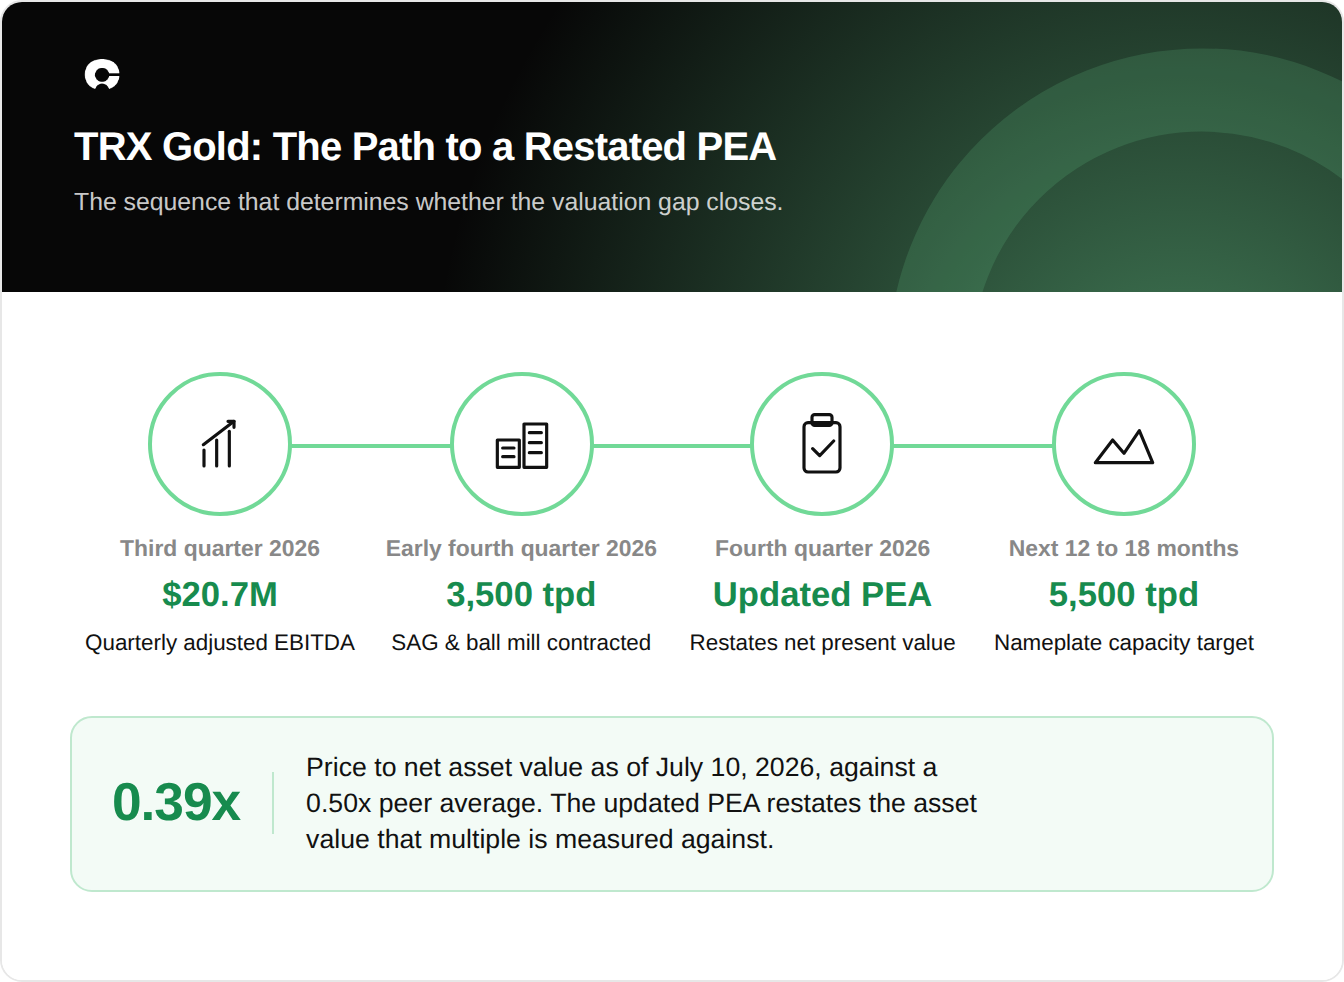
- TRX Gold reported third-quarter adjusted earnings before interest, taxes, depreciation, and amortization (EBITDA) of $20.7 million on revenue of $32.8 million, a 59% gross margin.
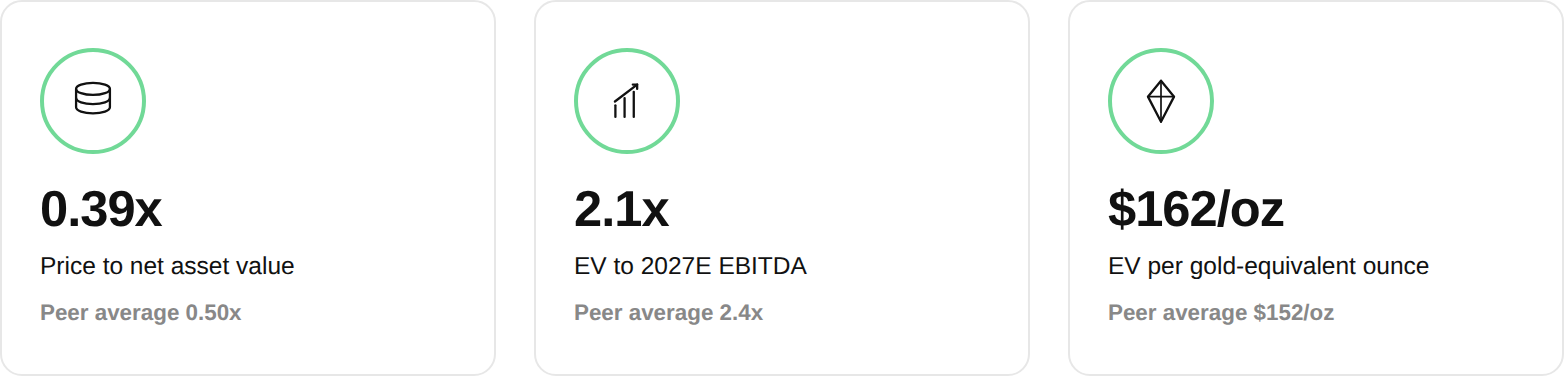
- The stock traded at 0.39x price to net asset value (NAV) and 2.1x enterprise value (EV) to 2027 estimated EBITDA on July 10, 2026, against peer averages of 0.50x and 2.4x.
- The company held $26.8 million in cash against $2.9 million of borrowings, with no warrants outstanding and $40 million of supplemental liquidity.
- A contracted 3,500 tonnes per day semi-autogenous grinding (SAG) and ball mill circuit is targeting 5,500 tonnes per day nameplate capacity, against 3,000 tonnes per day in the 2025 preliminary economic assessment (PEA).
- The updated PEA targeted for the fourth quarter of 2026 restates a NPV5% now at $1.9 billion pre-tax on $4,000 per ounce gold.
A Cash-Generative Producer Priced Below Its Own Peer Benchmarks
TRX Gold Corporation (TSX: TRX | NYSE American: TRX) operates the Buckreef Gold Project in the Geita District of Tanzania, through a joint venture (JV) owned 55% by TRX Gold and 45% by STAMICO, the government of Tanzania's mining entity. The question for an allocator is not whether the asset generates cash. It is why an operation producing $66.8 million of adjusted earnings before interest, taxes, depreciation, and amortization (EBITDA) over the last twelve months, nearly debt-free and funding its own expansion, traded below its producer peer group on two of the three multiples its own disclosure uses.
Third Quarter Earnings Establish a Measurable Cash Flow Base
For the three months ended May 31, 2026, TRX Gold poured 7,426 ounces of gold and sold 6,983, increases of 58% and 75%. Revenue of $32.8 million converted to gross profit of $19.5 million, a 59% margin, adjusted net income of $10.1 million against reported net income of $8.4 million, operating cash flow of $8.8 million, and adjusted EBITDA of $20.7 million.
The quarter reads as a run rate, not an isolated result. Across the last twelve months (LTM) to May 31, 2026, revenue was $115.5 million, adjusted EBITDA $66.8 million at a 58% margin, and operating cash flow $28.9 million on 27,880 ounces produced. The current run rate exceeds that period. Nine-month revenue was $92.0 million, gross profit $54.7 million, and adjusted EBITDA $54.1 million.
The nine-month period reports a net loss of $5.9 million despite that gross profit, because it absorbs a $30.5 million change in the fair value of derivative financial instruments and $19.1 million of income tax, both added back in the release's adjusted EBITDA reconciliation. All outstanding warrants were exercised or expired in the second quarter of fiscal 2026.
Throughput & Recovery Gains Carry Offsetting Cost Increases
The case for margin durability sits in two variables the company controls. Plant throughput reached a record 1,690 tonnes per day in the third quarter against 1,461 tonnes per day a year earlier, up 16%, while gold recovery improved to 84.9% from 67%. Plant utilization ran at 93% and head grade at 1.96 grams per tonne against 1.72. The release attributes the gains to newly installed plant equipment, including a pre-leach thickener and an oxygen plant.
Costs moved against the company in the same quarter. Processing cost rose from $14.60 to $25.66 per tonne and the strip ratio from 8.1 to 12.4 waste to ore, while mining cost per tonne fell to $3.02 from $3.63. Cash cost per ounce of gold sold still declined to $1,648 from $1,819, and the nine-month $1,555 sits within full-year guidance of $1,400 to $1,600.
Metallurgical testwork during the quarter returned recovery of 89% to 92%, above the 88% assumed in the 2025 preliminary economic assessment (PEA), and it specified the semi-autogenous grinding (SAG) and ball mill combination now under contract. The recovery assumption behind the forthcoming study therefore rests on bench work, not one quarter of plant data.
A Balance Sheet That No Longer Constrains the Capital Program
At May 31, 2026, TRX Gold held $26.8 million in cash against $2.9 million of borrowings, working capital of $36.3 million and a current ratio of approximately 2.2. Net cash rose by approximately $19.1 million from fiscal year end, helped by roughly $21.0 million of warrant exercise proceeds. Basic shares outstanding stood at 327,474,009, and $40 million of supplemental liquidity remained in place, split between an at-the-market facility and credit and gold pre-payment facilities the release describes as significant and undrawn.
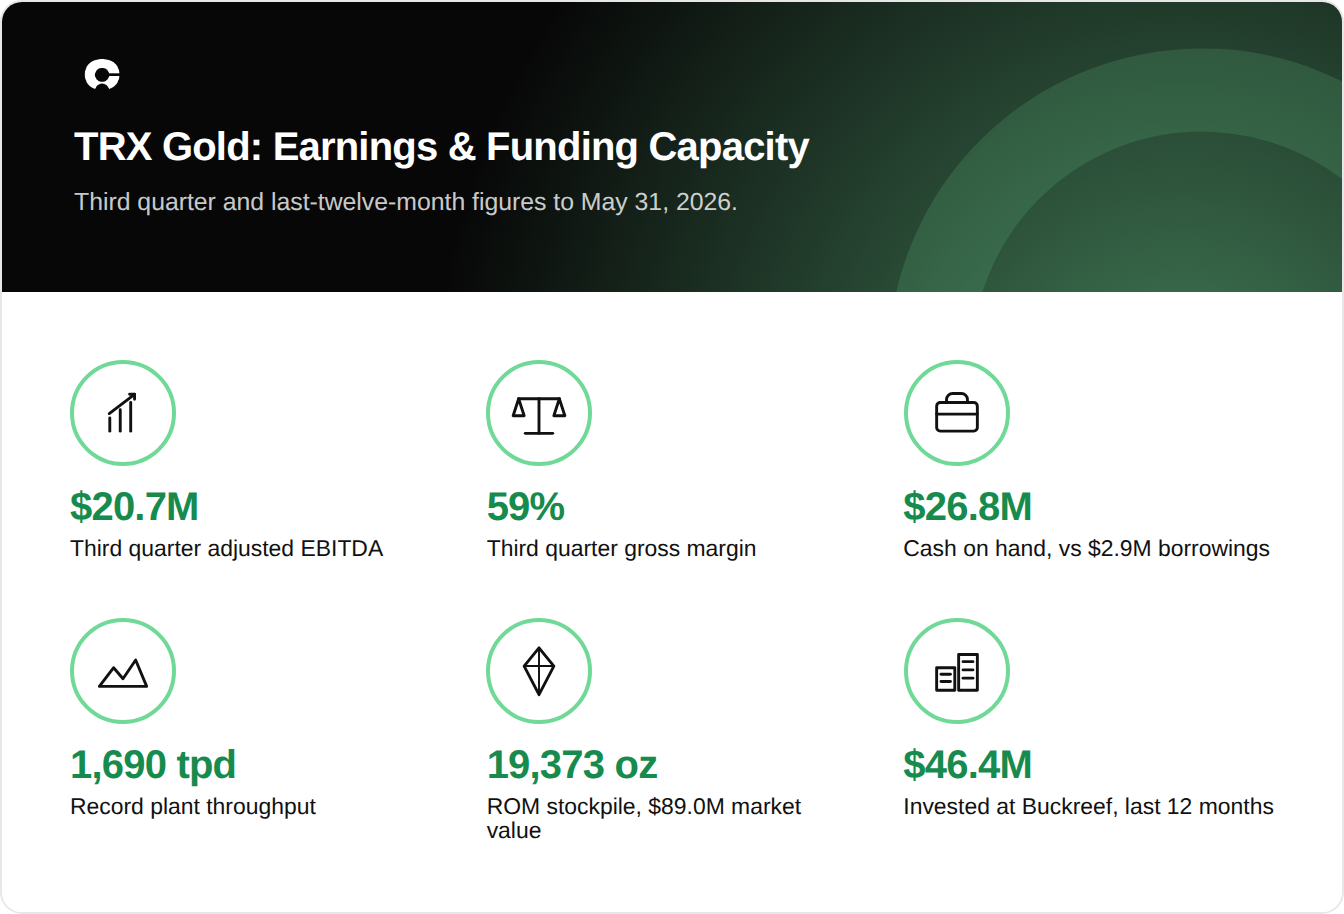
A second funding source sits in inventory. Run-of-mine stockpile inventory grew to an estimated 19,373 contained ounces of gold, worth approximately $89.0 million at then-current prices, built from higher grade ore blocks. The company is targeting a drawdown to benefit fourth quarter production, funded by the $19.3 million of working capital invested over the last twelve months.
Chief Executive Officer of TRX Gold, Stephen Mullowney, set out the funding position:
"With a current adjusted EBITDA run rate higher than the LTM period, cash on hand of $26.8 million, working capital investment having already been made, significant undrawn credit lines, and essentially being debt free, we are currently well positioned to fund our capital program over time."
Capacity Beyond PEA Scope, Funded From Operations
The expansion has moved from study to contract. The 3,500 tonnes per day SAG and ball mill was awarded in the third quarter, contract execution completed in early fourth quarter of fiscal 2026, downpayments made, and completion estimated over 12 to 18 months. The existing 2,000 tonnes per day plant, itself being upgraded, will be available to run alongside it, taking nameplate capacity from 3,000 tonnes per day to 5,500 tonnes per day. The company is targeting average annual production above the PEA level, which the company puts at 62,000 ounces and the presentation at 61,700.
The capital has been sourced from operations rather than equity. Over the last twelve months the company invested $46.4 million at Buckreef Gold, $27.1 million in capital assets and $19.3 million in working capital, against $19.1 million of original net capital raised since 2021 excluding warrant proceeds. The track record is three completed mill expansions since 2021, from a 120 tonnes per day test plant through 360 tonnes per day and 1,000 tonnes per day to 2,000 tonnes per day, each delivered on time and on budget, with the contracted circuit the fourth.
Mullowney tied that scope to the value question:
"Our accelerated plant expansion is laying the foundation for the next stage of growth, which will include both a 3,500 tonnes per day SAG mill circuit and significant upgrades to our existing 2,000 tonnes per day plant - with a combined processing capacity which is well beyond the 3,000 tonnes per day plant capacity as outlined in our PEA last year, unlocking significant value."
Where the Multiples Sit Against the Peer Set
The company benchmarks TRX Gold on three measures, against producers on enterprise value to EBITDA and producers and developers on the other two, using FactSet, broker research and company disclosure at July 10, 2026 share prices. TRX Gold's own figures come from the PEA at June 2026 consensus gold prices, $4,782 per ounce in 2026 down to $3,609 long term, adjusted for Buckreef JV ownership.
On that basis the stock traded at 2.1x enterprise value (EV) to 2027 estimated EBITDA against a 2.4x peer average, and 0.39x price to net asset value (NAV) against 0.50x. On EV per gold-equivalent ounce the position inverts: $162 against a $152 average. The discount therefore sits in cash flow and asset value, not in ounces. The equity was priced at $0.79, a basic market capitalization of US$259 million, against four published broker targets from $1.80 to $2.50.
What the discount is not is a funding or delivery discount. The full-year guidance of 25,000 to 30,000 ounces had already been achieved, with over 25,000 ounces poured year to date, and cash cost guidance was reaffirmed. Institutional holders hold approximately 15% of the register, against approximately 70% retail.
What Restates the Valuation & What Constrains It
The mechanism that revalues the asset is a document, not a quarter. The PEA supports a pre-tax net present value (NPV5%) of $1,878.5 million and an after-tax NPV5% of $1,238.6 million at $4,000 per ounce gold, on 61,700 ounces a year over 17.6 years at 3,000 tonnes per day, with $88.7 million of growth capital in the first four years. The updated PEA targeted for the fourth quarter of 2026 is built on the larger plant and a revised life-of-mine (LOM) plan that could expand the open pit, defer Main Zone underground mining, and raise recoverable ounces.
Exploration feeds the same document, targeting growth against a Measured and Indicated Mineral Resource of 10.8 million tonnes at 2.57 grams per tonnes of gold for 893,000 ounces, plus 726,000 inferred ounces. A geophysical survey identified 13 drill holes over 1,850 meters for the fourth quarter, and half the 14 kilometer Eastern Porphyry program is done.
The constraints are quantified in the same sources. That $88.7 million of growth capital must come from $26.8 million of cash plus operating cash flow, which makes the $89.0 million stockpile and $40 million of supplemental liquidity load-bearing, and the 45% STAMICO interest is deducted before cash flow reaches the equity. The PEA shows pre-tax NPV5% of $1,180.5 million at $3,000 per ounce gold and $2,576.5 million at $5,000, against $482.4 million at $2,000, so NPV moves with the price deck the update adopts. The new circuit is also larger than any prior expansion step, the largest being 1,000 tonnes per day to 2,000 tonnes per day.
The Investment Thesis for TRX Gold
- TRX Gold generated adjusted earnings before interest, taxes, depreciation, and amortization of $66.8 million over the twelve months to May 31, 2026 at a 58% margin, which is what lets the expansion be funded from operating cash flow rather than dilutive equity.
- The company held $26.8 million of cash against $2.9 million of borrowings with no warrants outstanding, leaving 327,474,009 basic shares and 17,138,770 options and restricted share units as the only dilution.
- A contracted 3,500 tonnes per day semi-autogenous grinding and ball mill circuit, running alongside the upgraded 2,000 tonnes per day plant, targets 5,500 tonnes per day of capacity against the 3,000 assumed in the 2025 preliminary economic assessment.
- The equity screened at 0.39 times price to net asset value against a 0.50 times peer average, while enterprise value per gold-equivalent ounce sat above that average, locating the discount in cash flow and asset value rather than the resource.
- Metallurgical testwork returning recovery of 89% to 92% exceeds the 88% assumed in the existing study, and a stockpile of 19,373 contained ounces was worth approximately $89.0 million at May 31, 2026.
The updated PEA targeted for the fourth quarter of 2026 restates asset value on the larger plant and revised mine plan. That, not quarterly production already at full-year guidance, is the input against which the current 0.39 times multiple should be reassessed.
TL;DR
TRX Gold produced $20.7 million of adjusted EBITDA in the third quarter of fiscal 2026 at a 59% gross margin, holds $26.8 million of cash against $2.9 million of borrowings, and has contracted a 3,500 tonnes per day SAG and ball mill targeting 5,500 tonnes per day against 3,000 tonnes per day in its 2025 PEA. The equity screened at 0.39x price to NAV and 2.1x EV to 2027 estimated EBITDA on July 10, 2026, both below peer averages. The updated PEA due in the fourth quarter, not the next production print, is what restates that asset value.
FAQs (AI-Generated)
Analyst's Notes





Subscribe to Our Channel




.png)



Stay Informed