US$185.5M H1 Profit & 100% Dividend Increase Perseus Mining's Self-Funded Growth in a High Gold Price Environment


Perseus Mining posts US$185.5M H1 FY26 profit, doubles dividend, holds US$755M net cash, and advances Nyanzaga toward 200Koz annual output from FY28.
- Perseus Mining reported net profit after tax of US$185.5M and EBITDA of US$315.5M for the first half of FY26, supported by a realized gold price of US$3,241 per ounce, a 38% increase over the prior year period.
- The board declared an interim dividend of AUD 5.0 cents per share, representing a 100% year-on-year increase and a distribution of US$47.3M, signaling confidence in the sustainability of operating cash flows.
- Net cash and bullion of US$755M as at 31 December 2025, combined with US$400M in undrawn credit facilities, provides more than US$1.15B in available liquidity, funding Nyanzaga in Tanzania and CMA Underground in Cote d'Ivoire without equity issuance.
- Full-year FY26 guidance was reaffirmed at 400,000 to 440,000 ounces at an all-in sustaining cost (AISC) of US$1,600 to US$1,760 per ounce, implying cash margins above US$1,400 per ounce at current spot prices.
- Perseus presents a combination of yield, balance sheet strength, and organic production growth that is relatively uncommon among mid-tier gold producers across its operating jurisdictions.
Capital Allocation & Shareholder Returns
Perseus's approach to capital distribution reflects a structured hierarchy: maintain balance sheet strength, fund committed growth capital, and return surplus cash to shareholders. The H1 FY26 results demonstrate execution against all three priorities simultaneously within the same reporting period.
Dividend Increase as a Capital Signal
The board approved an interim dividend of AUD 5.0 cents per share, equivalent to US$47.3M in aggregate, representing a 100% increase over the prior year period. Based on the volume-weighted average share price of A$5.499 on 31 December 2025, the implied dividend yield is approximately 0.91%. While modest in absolute terms, the rate of increase carries analytical significance. In dividend signaling theory, a material increase in distributions communicates management's confidence in the sustainability of underlying cash flows - a deliberate contrast to producers that direct all free cash flow into capital expenditure at the expense of per-share shareholder returns.
Craig Jones, Chief Executive Officer of Perseus Mining, addressed the company's capital return framework in the context of gold price assumptions:
"Based on a relatively conservative gold price, that puts us in a good position to be able to continue to return capital to shareholders as we have been doing, and the board is committed to another $100 million buyback program this year."
Buyback Program & Return Hierarchy
The A$100M share buyback program, authorized for FY26 and disclosed in the 20 February 2026 half-year results presentation, supplements the dividend as a mechanism for capital return. The simultaneous authorization of both a dividend increase and a buyback program, while funding material growth capital expenditure internally, is an unusual and analytically favorable configuration for a mid-tier miner. For investors evaluating weighted average cost of capital and dilution exposure, the absence of equity issuance in a development-phase year is a material positive.
Balance Sheet Position & Liquidity
The strength of Perseus's balance sheet determines what the company can do next and at what cost, and is the primary mechanism by which development-stage capital intensity is insulated from equity market conditions.
Net Cash & Available Liquidity
Perseus reported net cash and bullion of US$755M as at 31 December 2025, comprising US$683.1M in cash and 16,450 ounces of bullion at a mark-to-market value of US$71.8M. Separately, the company held US$228.7M in marketable securities. Combined with US$400M in undrawn debt facilities, total available liquidity exceeds US$1.15B. In the context of a cyclical industry where commodity price corrections can rapidly impair access to capital markets, this liquidity position provides a buffer against both operational disruption and forced shareholder dilution.
Craig Jones quantified the balance sheet's capacity relative to the company's committed capital program:
"Our current cash position says no. We can pay for all of our aspirations within our current cash flows. It just depends on whatever else we do in the future. But at this stage, there is no need for us to take any debt on. We can fund all of our aspirations through the cash that we have on the balance sheet."
Self-Funding Growth Without Equity Issuance
Investing cash flows in H1 FY26 were US$166.9M, an increase of 127% year-on-year, reflecting the ramp-up of development expenditure at Nyanzaga and CMA Underground. Funding these projects internally substantially reduces equity dilution risk, which is the primary mechanism by which development-stage capital intensity erodes per-share value in the mining sector. For investors calculating net asset value per share, the absence of share count expansion during a period of material capital investment is a structural differentiator.
Production Profile, Mine Transitions & Cost Dynamics
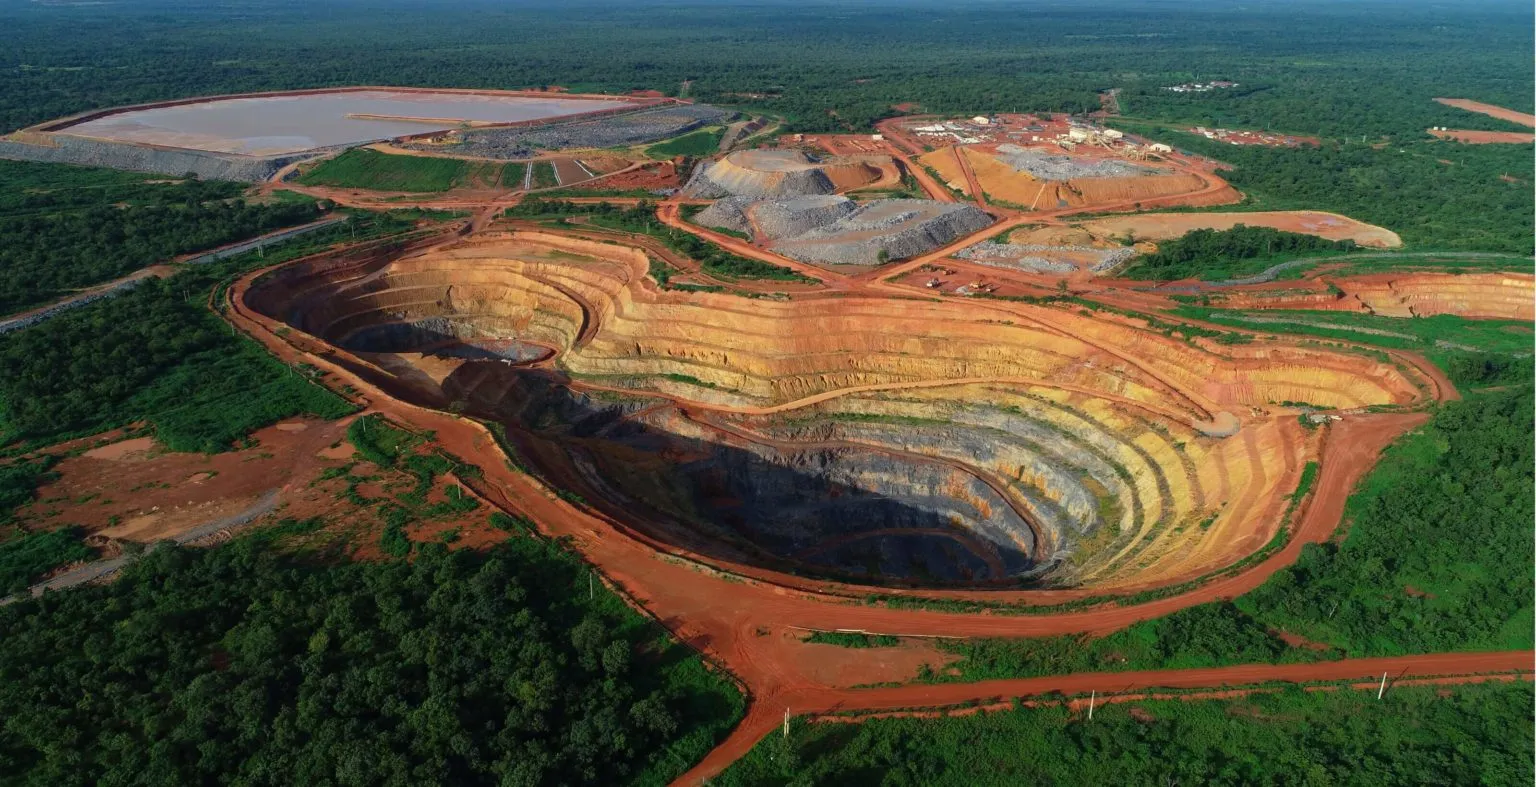
Perseus's operational footprint spans three producing assets in Africa: Yaoure and Sissingue in Cote d'Ivoire, and Edikan in Ghana. A fourth asset, Nyanzaga, is under development in Tanzania. The production profile across the producing assets is, as of the H1 FY26 reporting period, in transition, with near-term implications for unit costs and output volumes that investors should assess independently of the longer-term earnings trajectory.
Transition-Phase Cost & Volume Dynamics
Yaoure completed mining in the CMA open pit and shifted full operational focus to the Yaoure pit, which carries a lower average grade than its predecessor. Edikan is similarly transitioning between open pit phases. Grade, expressed in grams per tonne of gold (g/t Au), is the primary driver of unit cost in an open-pit operation: lower-grade ore requires processing a greater volume of material to produce an equivalent quantity of gold, increasing cost per ounce even when underlying cash costs remain stable. Strip ratio, the volume of waste rock removed per tonne of ore processed, also increases during pit transitions. Sissingue continues to contribute actively to group output, with FY26 production guidance of 78,000 to 87,000 ounces.
Craig Jones was direct in characterizing the nature of current cost pressures:
"The cost performance of this organization and the cost commitment of this organization is very strong. Whilst we have seen some increase in all-in sustaining costs in recent times, that is more driven by grades and stripping activity and so forth rather than the underlying costs."
He also acknowledged the inherent risk embedded in pit transitions:
"Changing from one ore body to another is always a time of risk and variability, and we are making that transition well and starting to see the positive signs of that work."
Royalty Adjustment in Cote d'Ivoire & Sovereign Relationship Management
Perseus paid an additional 2% royalty in Cote d'Ivoire during H1 FY26, equivalent to approximately US$20M, as part of ongoing discussions between the mining industry and the Government of Cote d'Ivoire regarding a revised fiscal arrangement. Management characterized this payment as a good-faith engagement within a broader industry process. The payment was formally disclosed in the ASX news release dated 20 February 2026. Investors applying a jurisdiction risk discount to Perseus's valuation should note that proactive engagement in these processes, while carrying uncertainty while negotiations continue, is generally associated with lower long-term sovereign disruption risk than adversarial postures toward resource taxation reform.
Nyanzaga Project Development & Reserve Base
The Nyanzaga gold project in Tanzania is the primary growth asset in Perseus's development and will materially expand the company's annual production capacity beyond the current operational base.
Reserve Expansion & Development Timeline
In a market announcement dated 20 February 2026, Perseus confirmed a 73% increase in the Nyanzaga Ore Reserve, bringing the total to 4.0 million ounces. Ore Reserves, as defined under JORC or equivalent internationally recognized standards, represent the portion of a mineral deposit assessed as economically mineable under specified conditions, distinguishing them from the broader Mineral Resources category, which carries greater geological and economic uncertainty. The expanded reserve supports a mine life of 16 years, with projected annual production of approximately 200,000 ounces from FY28 through FY41.
Craig Jones confirmed the project's development trajectory:
"The Nyanzaga project is progressing very well, on time, and on budget. We are looking at ramping gold projection in January 2027, and everything is heading on track for that at the moment."
Production Runway & Valuation Relevance
Nyanzaga's 16-year mine life significantly extends Perseus's production. Long-duration assets are valued differently in net present value modeling: extended mine lives reduce the sensitivity of NPV to the discount rate applied, which is a meaningful consideration when evaluating development-stage assets. The enterprise value per ounce of annual production, a widely used comparative metric for mid-tier producers, is expected to improve as Nyanzaga approaches production and forward estimates incorporate its output profile.
Gold Price Environment & Producer Margin Dynamics
The current gold price cycle is placing significant pressure on producers to demonstrate cost discipline and capital allocation rigor. Perseus Mining's first-half FY26 results illustrate how a mid-tier operator can convert a favorable pricing environment into durable financial outcomes across revenue, margins, and cash generation.
Price Realization & Cost Structure
Perseus realized an average gold price of US$3,241 per ounce during H1 FY26, a 38% increase year-on-year. Against an AISC of US$1,649 per ounce, the resulting cash margin of approximately US$1,592 per ounce represents the spread available to fund capital projects, service obligations, and return capital to shareholders. AISC is an industry-standard metric encompassing direct operating costs, sustaining capital expenditure, royalties, and corporate overhead, and is the most widely used benchmark for comparing unit economics across producers.
Group revenue reached US$608.5M, a 5% increase year-on-year, while EBITDA of US$315.5M reflects the operating leverage embedded in Perseus's cost structure at current pricing. Operating cash flow was US$193.4M. Net profit after tax of US$185.5M reflected a modest year-on-year decline in absolute terms due to a US$26.9M foreign exchange loss and an additional royalty payment in Cote d'Ivoire, both addressed in detail below.
Operating Leverage in a High Gold Price Environment
Gold equities exhibit significant operating leverage to the underlying commodity price. With cost structures that include both fixed and variable components, incremental increases in realized price above AISC flow directly to operating cash flow, amplifying returns during periods of commodity strength. This dynamic is central to the investment case for well-capitalized producers with disciplined cost management cultures, and it is a primary reason investors assess AISC positioning relative to spot gold when evaluating mid-tier producers.
Risk Considerations for Investors
West African jurisdiction exposure remains a structural feature of the portfolio in Cote d'Ivoire and Ghana, where political and regulatory risk cannot be fully eliminated and is typically reflected in an EV/EBITDA discount relative to producers in OECD jurisdictions. The Nyanzaga project in Tanzania represents a distinct East African jurisdiction with its own regulatory and political risk profile, and should be assessed separately from the West African operations. Ongoing fiscal discussions in Cote d'Ivoire regarding a revised royalty regime introduce near-term policy uncertainty that remains unresolved as of the H1 FY26 reporting date.
Currency volatility contributed a US$26.9M foreign exchange loss in H1 FY26. As a USD-reporting company with operating costs partially denominated in local currencies, Perseus carries exposure to movements in the CFA franc, Ghanaian cedi, and Tanzanian shilling. Gold price sensitivity is symmetric: the operating leverage that amplifies returns at elevated spot prices equally compresses margins at lower price points. Transition-related grade variability at Yaoure and Edikan may produce quarterly production and cost figures that diverge from the annualized FY26 guidance range.
The Investment Thesis for Perseus Mining
Perseus Mining presents a case study in mid-tier producer discipline during a period of elevated gold prices. The following factors constitute the analytical basis for investor consideration.
- Margin durability is supported by a cash margin of approximately US$1,592 per ounce in H1 FY26, providing a substantial buffer against cost inflation or moderate gold price corrections without impairing the operating thesis.
- Capital return discipline is demonstrated by a 100% increase in the interim dividend and an A$100M share buyback program authorized for FY26, both executed while funding material growth capital expenditure from existing cash resources.
- Balance sheet strength, with US$755M in net cash and bullion as at 31 December 2025 and US$400M in undrawn credit facilities, substantially reduces financing execution risk for the Nyanzaga and CMA Underground development programs.
- Production growth visibility is anchored by the Nyanzaga project, now carrying a 4.0Moz Ore Reserve and a 16-year mine life, with first gold targeting January 2027 and annual production of approximately 200,000 ounces from FY28 through FY41.
- Management credibility is reinforced by the reaffirmation of FY26 production and cost guidance despite an acknowledged period of operational transition at Yaoure and Edikan, a measurable input into equity risk premium assessments.
- Jurisdictional engagement, as demonstrated by the disclosed royalty payment in Cote d'Ivoire within an ongoing industry-government fiscal process, reflects a consistent operating philosophy across multiple African jurisdictions where maintaining constructive sovereign relationships is a prerequisite for long-term operational continuity.
- Re-rating potential exists if Perseus successfully delivers Nyanzaga on schedule, given that the combined yield, organic growth, and balance sheet profile is underrepresented among globally listed mid-tier gold producers at current valuation multiples.
Perseus Mining's US$185.5M net profit for H1 FY26 is a significant result. Its analytical significance lies not in the absolute figure, however, but in what it reveals about the operational and financial architecture that generated it: margins sustained through an acknowledged transition period, capital returned to shareholders without constraining growth investment, and a balance sheet that substantially reduces reliance on external financing for committed development projects.
Elevated gold prices have expanded cash margins; disciplined cost management has preserved them through a period of operational transition; and a structured capital allocation framework has converted those margins into dividends, buybacks, and self-funded development. Investors evaluating mid-tier gold producer exposure will find Perseus's H1 FY26 results a relevant case study in how balance sheet strength and operational discipline interact when commodity pricing is favorable.
TL;DR
Perseus Mining delivered US$185.5M net profit and US$315.5M EBITDA in H1 FY26, driven by a realized gold price of US$3,241 per ounce — 38% above the prior year. The company doubled its interim dividend to AUD 5.0 cents per share and authorized an A$100M buyback, while simultaneously funding the Nyanzaga project in Tanzania and CMA Underground in Cote d'Ivoire from a US$755M net cash and bullion position. Nyanzaga's Ore Reserve expanded 73% to 4.0 million ounces, supporting 16 years of approximately 200,000 ounces per year from FY28. Full-year FY26 guidance of 400,000–440,000 ounces at AISC of US$1,600–US$1,760 per ounce was reaffirmed, implying cash margins above US$1,400 per ounce at current spot prices.
FAQs (AI-Generated)
Perseus reported net profit after tax of US$185.5M and EBITDA of US$315.5M for the first half of FY26. Group revenue reached US$608.5M, supported by a realized gold price of US$3,241 per ounce — a 38% increase year-on-year. Operating cash flow was US$193.4M. A modest year-on-year decline in net profit reflected a US$26.9M foreign exchange loss and an additional royalty payment in Cote d'Ivoire.
The board approved an interim dividend of AUD 5.0 cents per share — a 100% increase over the prior year - reflecting management's confidence in the sustainability of operating cash flows at elevated gold prices. CEO Craig Jones confirmed the company's commitment to continued capital returns, including a further A$100M share buyback program for FY26, while simultaneously funding growth projects internally.
Nyanzaga is Perseus's primary growth asset, located in Tanzania. The project's Ore Reserve was expanded 73% to 4.0 million ounces in February 2026, supporting a 16-year mine life and annual production of approximately 200,000 ounces from FY28 through FY41. First gold is targeted for January 2027. The project is fully funded from existing cash resources, eliminating equity issuance risk during the development phase.
Key risks include West African jurisdictional exposure across Cote d'Ivoire and Ghana, ongoing fiscal negotiations with the Cote d'Ivoire government regarding a revised royalty regime, currency volatility across the CFA franc, Ghanaian cedi, and Tanzanian shilling, and grade-related cost variability during pit transitions at Yaoure and Edikan. Gold price sensitivity is symmetric — the operating leverage that amplifies margins at current prices equally compresses them if spot prices decline.
Perseus held US$755M in net cash and bullion as at 31 December 2025, supplemented by US$400M in undrawn credit facilities, providing over US$1.15B in available liquidity. CEO Craig Jones stated that the company can fund all committed development programs — including Nyanzaga and CMA Underground — from existing cash flows without taking on debt or issuing equity, which protects per-share value during a capital-intensive development period.
Analyst's Notes


Subscribe to Our Channel


Stay Informed