Why Gold Is Holding Above $4,000 Despite Fed Pressure


Gold remains above $4,000 as record central bank buying outpaces mine supply despite Fed rate pressure and exchange traded fund outflows.
- Central banks bought 289 tonnes of gold in the second quarter of 2026, up 74% year over year, while global mine production increased just 2%, widening the gap between official-sector demand and new physical supply.
- Gold-backed exchange traded funds recorded a net outflow of 45 tonnes in the second quarter, including $8.9 billion withdrawn in June alone, even as gold held above $4,000 per ounce, showing that rate-sensitive paper demand weakened despite elevated prices.
- The Fed held its policy rate at 3.50% to 3.75% on July 29, with three officials dissenting in favor of a rate hike, and the market is now pricing roughly a 77% probability of a September increase, maintaining pressure on rate-sensitive gold demand.
- Friday's US jobs report for July is the next major test of the market's roughly 77% implied probability of a September rate increase, with the outcome likely to determine whether rate-sensitive pressure on gold strengthens or eases.
Central Bank Buying Outpaces Mine Supply, Testing Gold's Rally
Gold traded between roughly $4,020 and $4,080 per ounce for most of the first week of August 2026, well below its January peak above $5,590 but above the sub-$4,000 low reached in June as the market balanced competing demand and interest-rate signals. The World Gold Council's second-quarter 2026 Gold Demand Trends report shows why: central banks added a net 289 tonnes to official reserves, up 74% year over year and the fastest quarterly pace on record, while global mine production grew just 2%, leaving new supply well behind official-sector demand.
That gap matters because central banks and exchange traded fund holders respond differently to the same market conditions. Central banks build reserves over multi-decade horizons and are largely insensitive to short-term price swings, while exchange traded fund holders adjust demand as the Fed's policy outlook changes. The key question is whether record official-sector buying reflects a lasting shift in reserve management or a temporary imbalance that fades as the Fed's policy path becomes clearer.
Reserve Diversification Supports Gold Demand Beyond Fed Policy
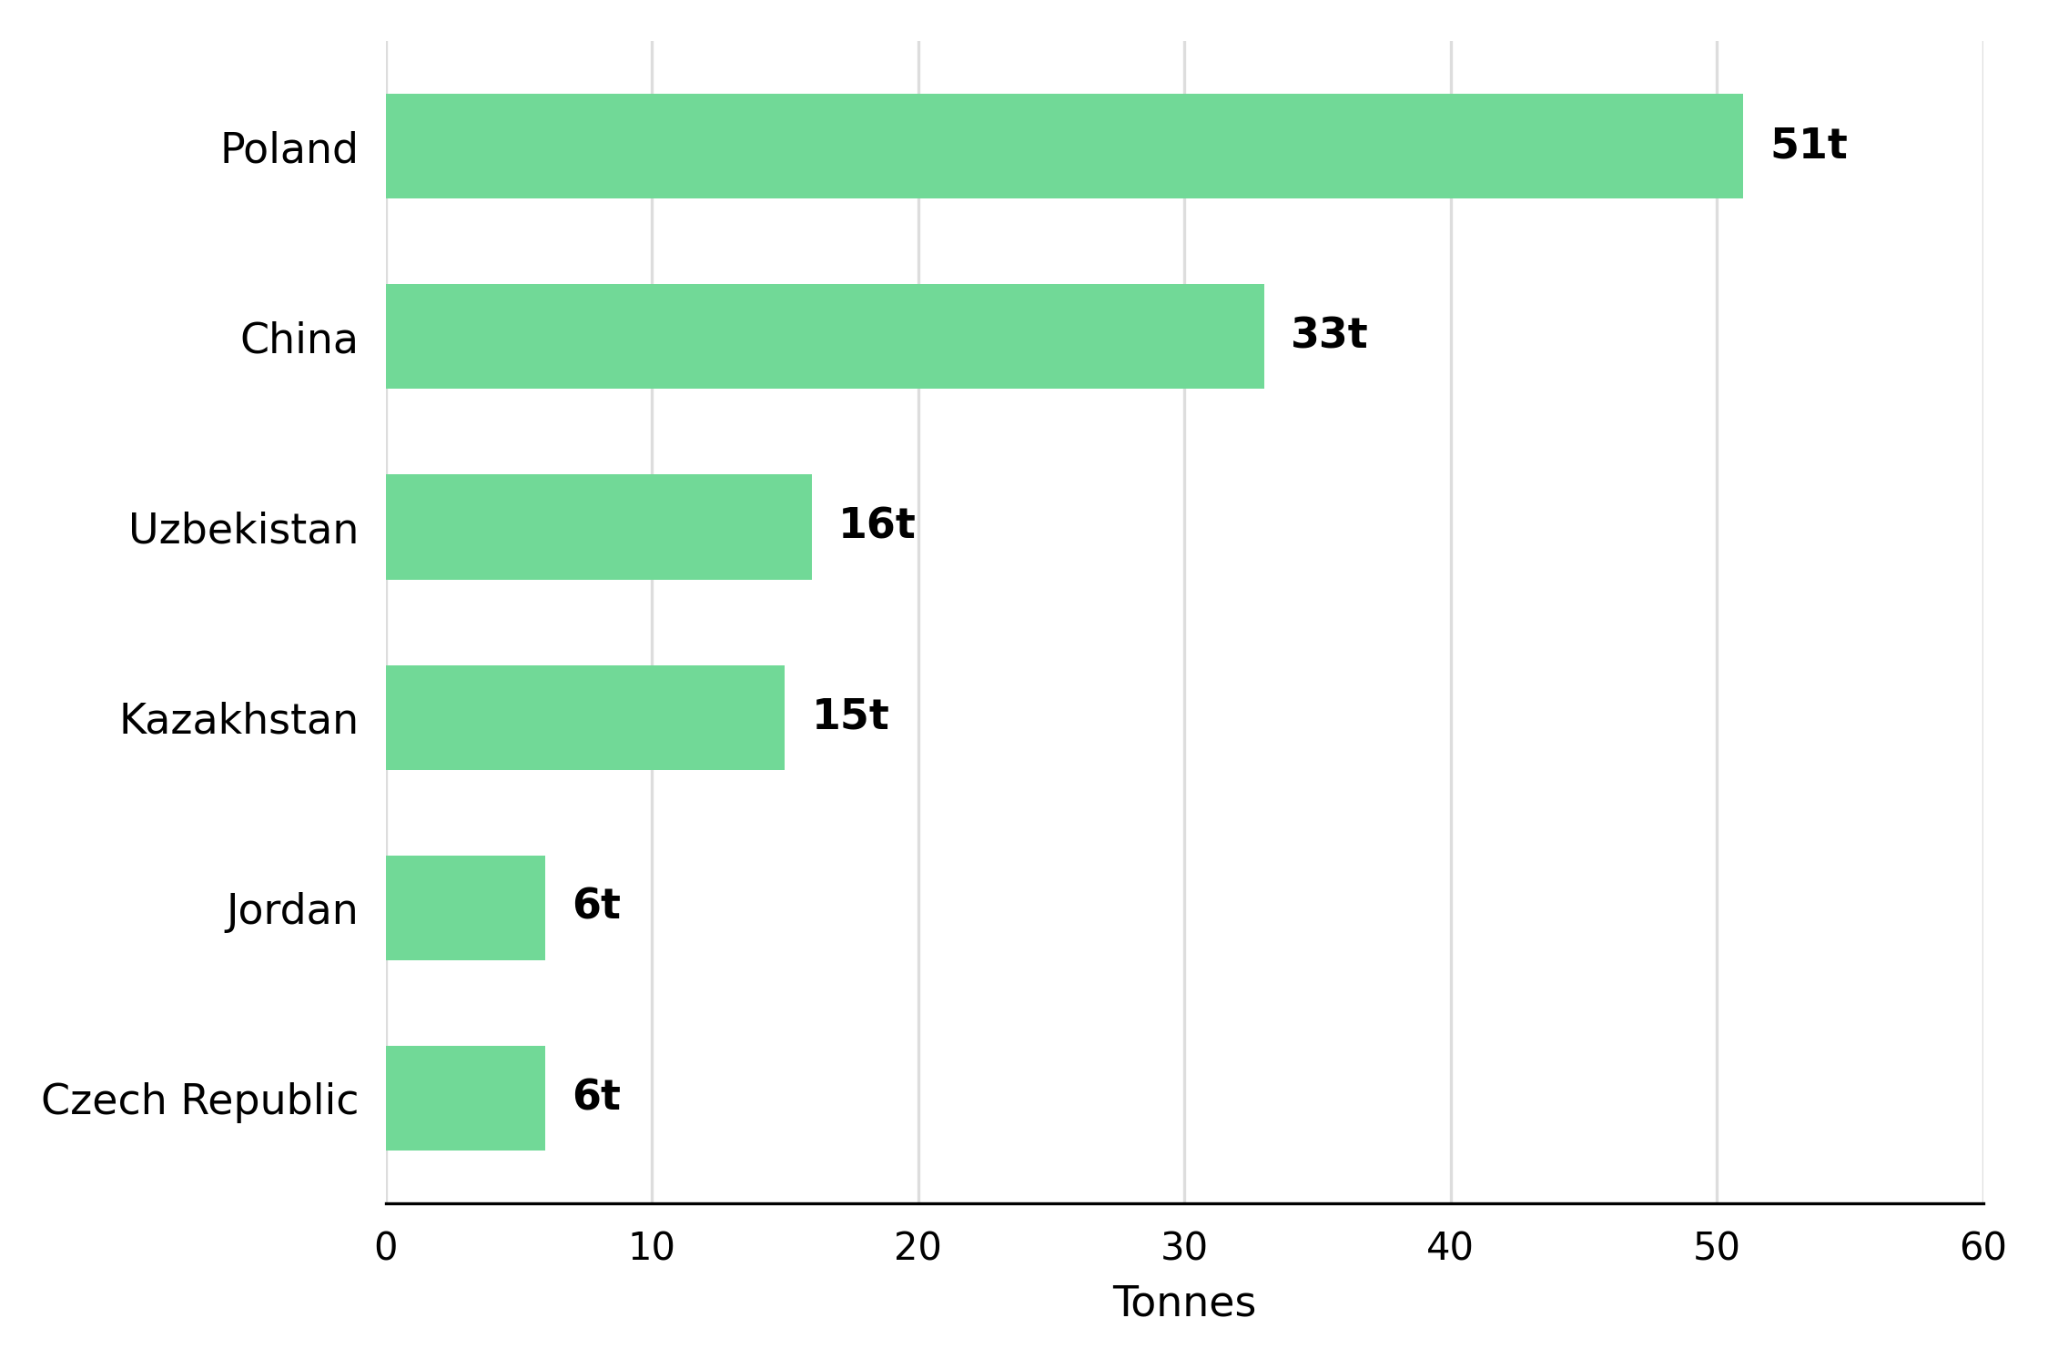
The 289 tonnes of gold purchased by central banks in the second quarter came primarily from a handful of countries, reinforcing continued reserve accumulation among major buyers. Poland added 51 tonnes, taking its reserves to 632 tonnes, while China added 33 tonnes, its largest quarterly addition since the fourth quarter of 2023, lifting its holdings to 2,346 tonnes. Uzbekistan added 16 tonnes, Kazakhstan 15 tonnes, while Jordan and the Czech Republic each added 6 tonnes. These purchases continued even as gold fell roughly 3% over the trailing month, showing that reserve accumulation was driven by strategic allocation rather than short-term price momentum.
The World Gold Council's Central Banks Gold Reserves Survey reinforces that trend: 89% of responding reserve managers expect official gold holdings to increase over the next 12 months, the highest reading in the survey's history. The European Central Bank reached the same conclusion in its June 2026 International Role of the Euro report, stating that gold has overtaken US Treasuries as the world's largest reserve asset. Unlike exchange-traded fund flows, central bank purchases follow long-term reserve management objectives and are rarely reversed when interest-rate expectations change, providing a more stable source of support for the physical gold market.
Fed Rate Expectations Pressure Gold Demand Ahead of the Jobs Report
On July 29, the Fed held its policy rate at 3.50% to 3.75% for a fifth consecutive meeting, although three policymakers dissented in favor of a 25 basis point increase. Interest-rate futures now imply roughly a 77% probability of a September rate increase. Gold's immediate reaction showed how sensitive the metal remains to changing Fed expectations, rising as much as 2% intraday to $4,116.26, its highest level since July 23, before surrendering most of those gains as September hike expectations strengthened.
The same pricing is reflected in exchange-traded fund flows. Gold-backed exchange traded funds recorded a net outflow of 45 tonnes in the second quarter, including $8.9 billion withdrawn in June alone, led by North America, as higher rate expectations reduced demand for non-yielding assets. A weaker US dollar following intervention to support the yen partially offset that pressure. The July US jobs report, due Friday, August 7, is the next major catalyst because it will either reinforce or weaken current expectations for a September rate increase.
Central Bank Buying or Fed Policy: What Drives Gold Next?
The second-quarter data supports two competing explanations for gold's resilience near $4,000 per ounce, and distinguishing between them will determine whether current prices reflect a lasting change in demand or a temporary response to Fed policy expectations. One interpretation is that record central bank buying reflects a lasting shift in reserve management that continues providing a demand floor regardless of the Fed's next policy decision. The alternative is that central bank buying remains only one source of demand, while rate-sensitive exchange-traded fund flows continue to determine gold's near-term price direction.
Official-Sector Buying and Limited Supply Support Gold
The strongest evidence for this view comes from reserve managers themselves. The World Gold Council's survey found that 89% of responding reserve managers expect official gold holdings to increase over the next 12 months, while the European Central Bank's June 2026 International Role of the Euro report concluded that gold has overtaken US Treasuries as the world's largest reserve asset.
Mine production grew just 2% year over year in the quarter, while disruptions at Freeport-McMoRan's Grasberg complex in Indonesia and a 4.5% year-over-year decline in South African mine output further constrained new supply, prompting Goldman Sachs to lower its global mine-supply forecast. Despite recent target reductions, 2027 gold price forecasts from J.P. Morgan, UBS, Goldman Sachs and Bank of America still range between $5,000 and $6,300 per ounce, supporting the long-term case for gold.
Fed Rate Expectations Continue to Pressure Gold
Standard Chartered estimates that roughly 298 tonnes of exchange-traded fund gold is held at a loss near $4,000 per ounce, creating a pool of potential sellers that could limit any near-term rally. Goldman Sachs lowered its 2026 year-end gold price target to $4,900 in June and outlined a $4,400 scenario if the Fed raises rates, highlighting downside risk through year-end despite its constructive long-term view. If the Fed raises rates in September, exchange-traded fund outflows are likely to deepen before continued central bank buying supports gold prices. If weaker economic data, beginning with Friday's US jobs report, reduces expectations for a September rate increase, exchange-traded fund demand could recover and provide a more supportive backdrop for gold.
High Gold Prices Drive Cash Flow & Reserve Growth Across Producers
Gold has held a $4,000 to $4,150 per ounce range through the first week of August, allowing producing miners to generate strong margins over their all-in sustaining costs despite uncertainty over the Fed's policy path. Unlike exchange-traded funds, whose returns remain tied to Fed rate expectations, producing miners continue generating operating cash flow. The following four producers show how current gold prices are translating into reserve growth, cash generation and processing capacity.
High Gold Prices Support Reserve Growth, Cash Flow & Debt Reduction
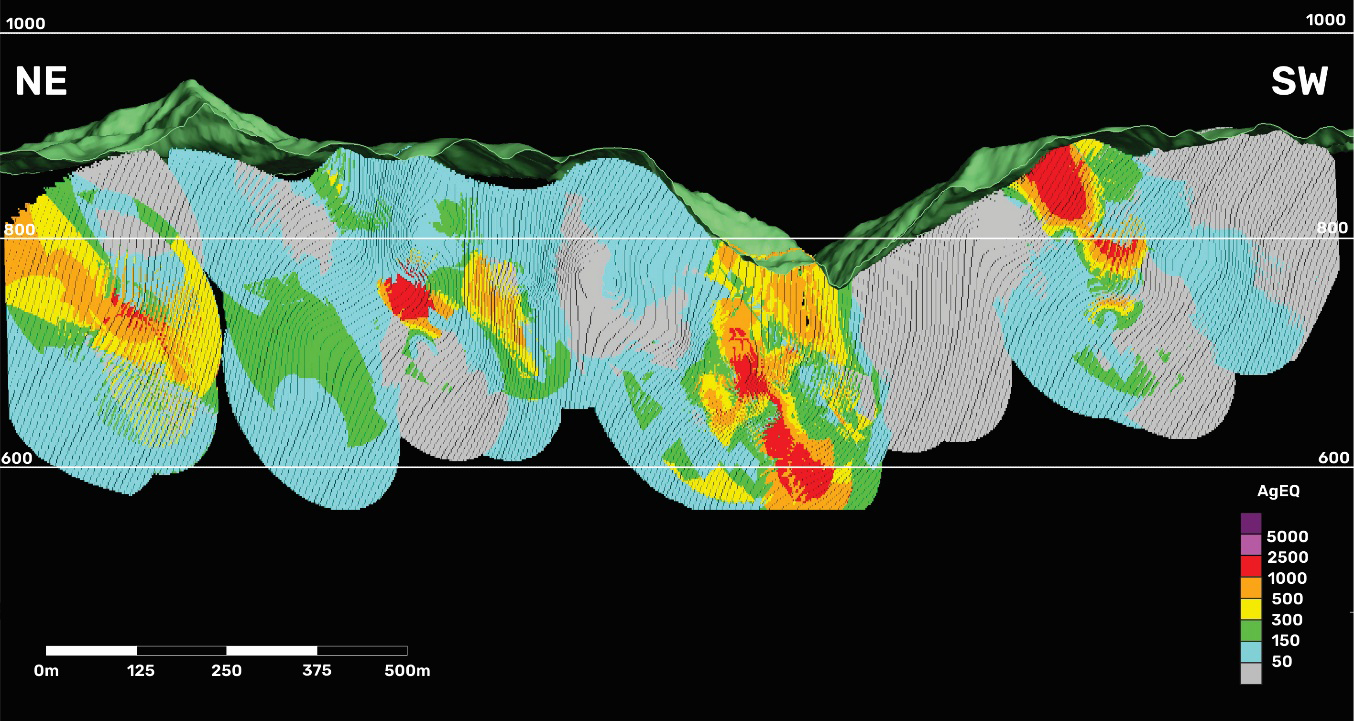
Integra Resources guided 2026 site-level all-in sustaining costs (AISC) of $3,300 to $3,500 per ounce in its June 2026 technical report, reflecting a front-loaded waste-stripping campaign rather than a permanent increase in operating costs. Those costs remain well above the project's life-of-mine estimate of $2,331 per ounce. The technical report also increased reserves by 74% to 1.19 million ounces of gold and estimated an after-tax NPV5% of $601 million using base-case prices, rising to $723 million at spot prices.
George Salamis, President and Chief Executive Officer of Integra Resources, ties the reserve growth directly to price:
"A lot of the material at Florida Canyon was low-grade waste. It wasn't economic at lower gold prices, and now it's economic."
Higher Gold Prices Drive Cash Flow, Debt Reduction & Margin Expansion
West Red Lake Gold Mines moved from cash breakeven in the first quarter of 2026 to positive free cash flow and voluntary debt repayment in the second quarter as production increased 51% quarter over quarter to 8,576 ounces and mined grades improved 23% to 4.3 grams per tonne at the Madsen mine in Ontario. The improvement also illustrates how higher gold prices lower a mine's economic cutoff grade, allowing material that was previously uneconomic to contribute to production and cash flow.
Serabi Gold ended the second quarter of 2026 with $65.7 million in cash and no debt despite absorbing roughly $4 million in one-time charges and lower realized gold prices during the quarter. The company also maintained full-year production guidance of 53,000 to 57,000 ounces, indicating that temporary headwinds did not alter its operating outlook.
Mike Hodgson, Chief Executive Officer of Serabi Gold, explains the margin math behind that resilience:
"Our AISC has probably crept up a little bit; we're probably going to be in the 2000s in 2026. But even with those things on top of the AISC, wherever we want to put the gold price, we're probably looking at a $2,000 margin."
Higher Gold Prices Increase the Value of Processing Capacity
i-80 Gold terminated its gold offtake agreement with Vox Royalty Corp in June 2026, removing the obligation to deliver up to 40,000 ounces annually at a 55% to 60% toll-milling payability. The termination allows the company to sell future production at prevailing spot prices instead of under discounted offtake terms. The company also plans to process refractory ore through its Lone Tree autoclave, targeting gold recoveries of approximately 92% once operational.
Higher Gold Prices Prompt a Producer to Treat Bullion as a Treasury Asset
Mineros S.A., a Colombia-based producer with mines in Colombia and Nicaragua, adopted a Strategic Gold Reserve Policy in July 2026 that formally makes physical gold bullion a core treasury asset, with the company now retaining a portion of its own output in bullion form rather than converting all production to cash; an Investment Committee oversees custody and risk limits, and gold is carried as inventory at the lower of cost and net realisable value under IAS 2.
Starting with the quarter ended June 30, 2026, Mineros will also report a new cash-flow subtotal that isolates operating cash flow from strategic gold purchases, alongside a "Strategic Liquidity Position" measure combining cash with the value of its bullion holdings. The policy arrived alongside stronger operating results: Mineros raised its full-year 2026 guidance to 220,000-240,000 gold equivalent ounces after first-half sales rose 12% year over year, with gold sold climbing 11% and silver sold more than doubling at the Hemco property in Nicaragua.
Fed Policy & Official-Sector Buying Will Determine Gold's Next Direction
The company examples show that current gold prices are already supporting reserve growth, debt repayment and contract restructuring across multiple producers, but they do not determine whether record central bank buying or Fed policy will dominate gold prices over the coming quarters. That question depends on the Fed's rate path and whether official-sector buying remains strong after its September decision. Friday's July US jobs report is the next major catalyst: a weaker-than-expected result would likely slow exchange traded fund outflows, while a stronger report would reinforce current expectations for a September rate increase and increase the likelihood of Goldman Sachs' $4,400 downside scenario. The World Gold Council's third-quarter 2026 Gold Demand Trends report, targeted for late October, will confirm whether central bank buying held through the Fed's decision or began to slow.
The Investment Thesis for Gold
- Central banks added 289 tonnes of gold to official reserves in Q2 2026, while 89% of reserve managers expect holdings to keep rising, supporting demand that is less sensitive to the Fed's policy outlook.
- Global mine production grew just 2% in Q2 2026, while disruptions in Indonesia and a 4.5% decline in South African mine output further constrained new supply.
- Current gold prices remain well above producers' all-in sustaining costs, supporting operating cash flow even during stripping or expansion phases, unlike exchange traded funds that remain exposed to Fed-driven price swings.
- Reserve growth, debt reduction and contract restructuring show that current gold prices are already driving measurable operational and financial improvements across producing gold assets.
- Friday's July US jobs report is the next major test of whether Fed policy or official-sector demand will drive gold prices, making the market's reaction more important than the headline price.
The gap between record official-sector buying and rate-sensitive exchange traded fund demand remains unresolved, with this week's US jobs report the next major catalyst. Regardless of which side prevails, the four producers highlighted here are already converting current gold prices into cash flow, reserve growth and stronger commercial terms, unlike exchange traded funds that remain tied to Fed rate expectations. The Fed's September meeting and the World Gold Council's third-quarter 2026 Gold Demand Trends report, targeted for late October, will show whether official-sector buying remained strong after the rate decision. Until then, the balance between official-sector buying and exchange traded fund demand will provide a clearer guide to gold's outlook than the headline price alone.
TL;DR
Gold has held above $4,000 per ounce because record central bank purchases continue to offset weaker exchange traded fund demand driven by expectations of higher US interest rates. Official buyers added 289 tonnes in the second quarter while mine supply grew just 2%, creating a supply-demand imbalance that supports prices. The next key catalyst is the July US jobs report, which could shift expectations for a September Fed rate increase. Meanwhile, producing gold companies continue to benefit from strong margins, reserve growth, debt reduction and improved commercial terms even as near-term price direction depends on the balance between official-sector buying and rate-sensitive investment flows.
FAQs (AI-Generated)
Analyst's Notes





Subscribe to Our Channel






Stay Informed