




77% Surge on Dry-Bulk Freight Gives Regional Salt a Delivered-Cost Advantage


Higher freight rates, 31% US import reliance and canal limits raise imported salt costs, strengthening nearby North American supply.
- The Baltic Dry Index reached 3,331 on September 2, 2026, its highest level since December 2023, after rising 77% year to date, raising freight-cost pressure on salt imported over long maritime routes.
- US salt imports increased 37%, from 13.9 million metric tons in 2024 to an estimated 19 million metric tons in 2025, while net import reliance rose from 23% to 31%, increasing exposure to ocean-freight costs.
- Mexico and Chile supplied 49% of average US salt imports from 2021 through 2024, concentrating nearly half of imported supply in two sources and increasing sensitivity to vessel availability, route disruptions and freight costs.
- The Panama Canal Authority allocated a minimum of three weekly slots collectively to vehicle carriers, roll-on/roll-off vessels, bulkers and other segments beginning September 13, raising scheduling risk for bulk cargoes and increasing the relative value of Atlantic salt supply near eastern markets.
- Developers near import-dependent markets with credible financing and construction plans can convert shorter routes into lower delivered costs, while delays and cost overruns would reduce that advantage.
Dry-Bulk Freight Inflation Raises Salt’s Delivered Cost
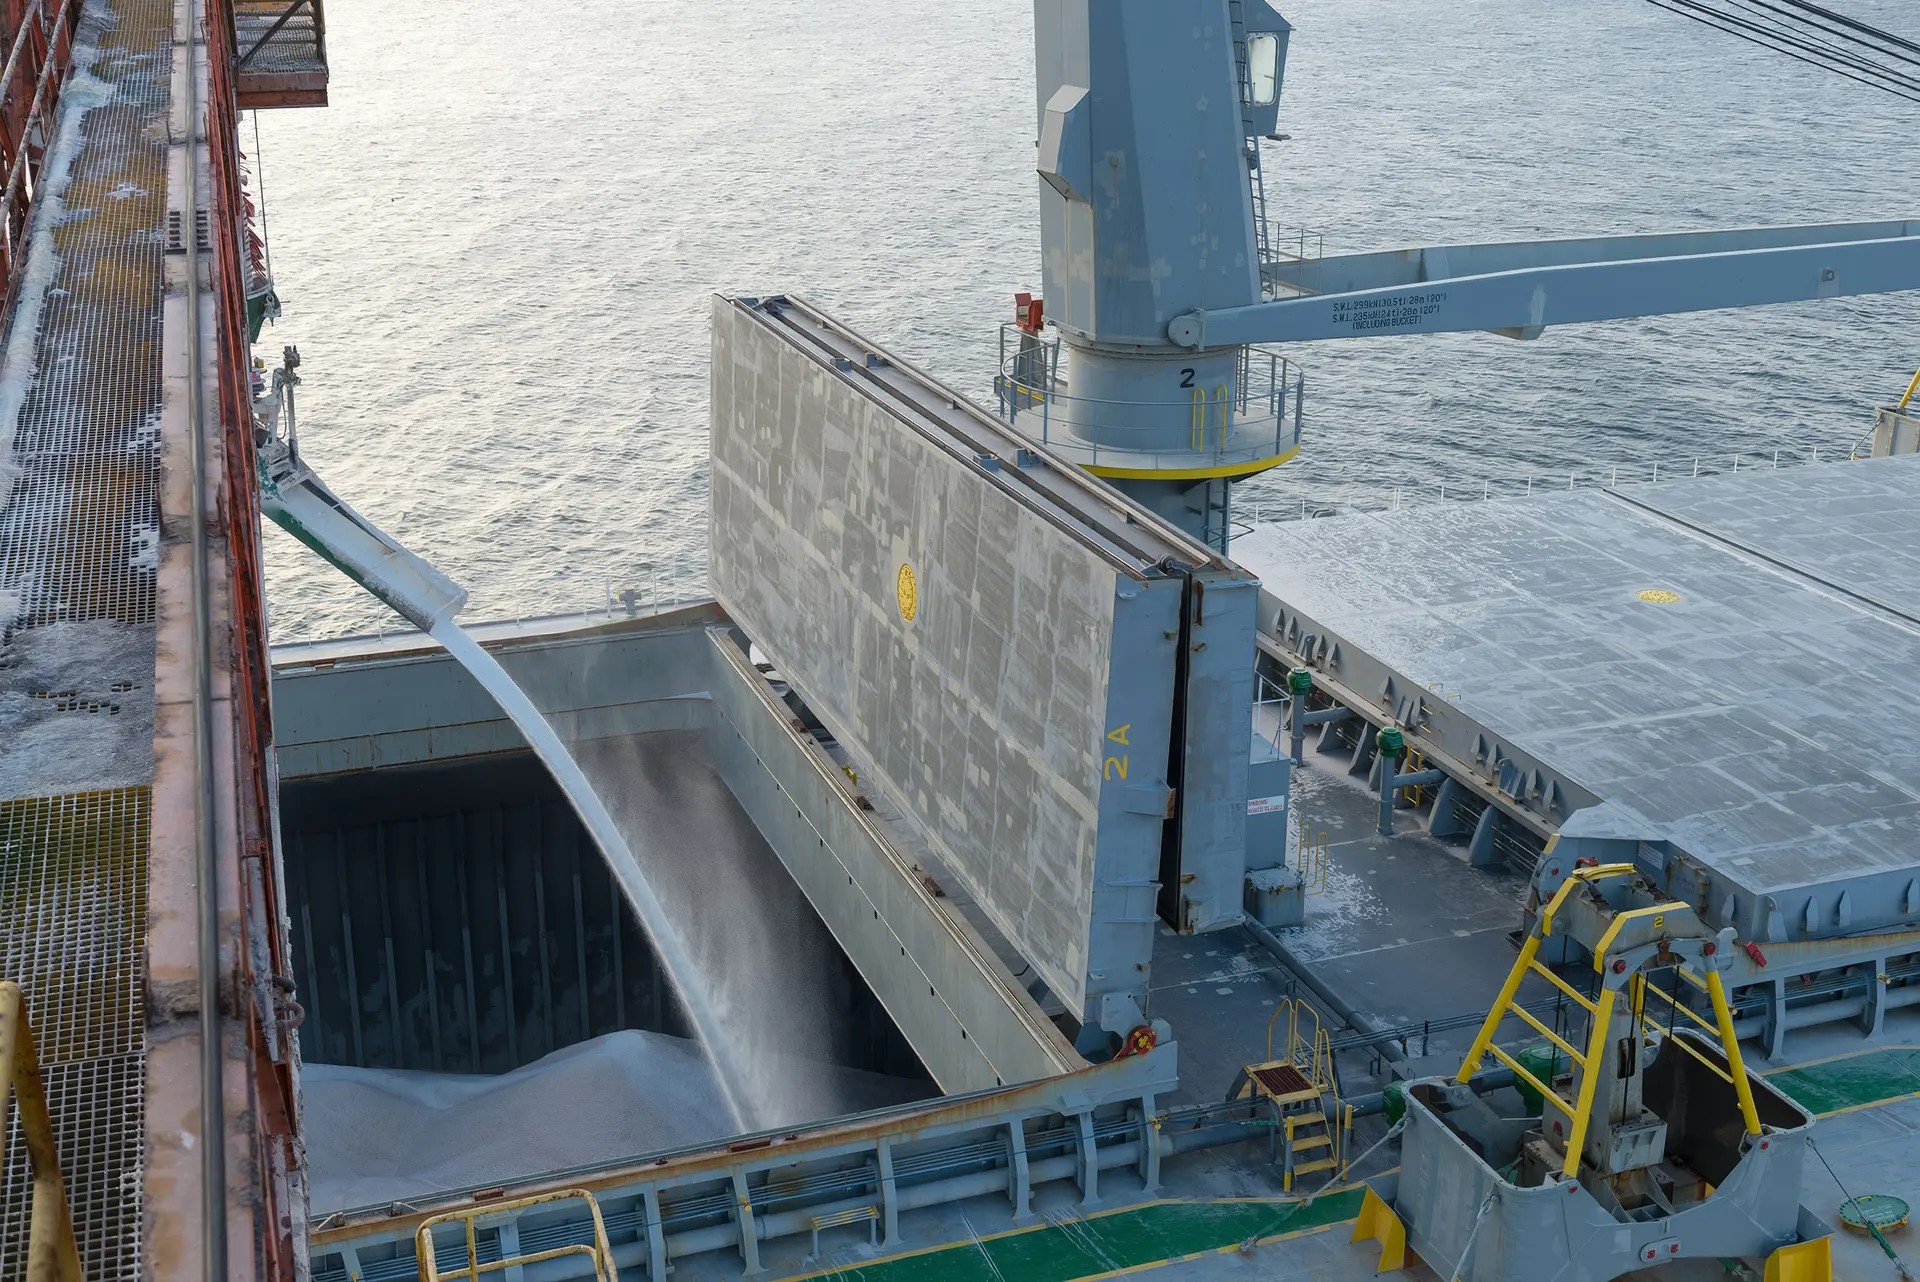
Salt is abundant globally, but its low value relative to its weight makes location a major determinant of delivered cost. Municipal and industrial buyers require large volumes within fixed procurement periods, so late or unavailable shipments can require higher-cost spot purchases. When dry-bulk freight rates rise, shorter routes reduce transportation and handling exposure, giving regional supply a delivered-cost advantage over distant imports even when mine-gate prices remain unchanged.
Bloomberg reports that the Baltic Dry Index (BDI) rose 5.5% to 3,331 on September 2, 2026, its highest level since December 2023 and 77% above its level at the start of the year. Capesize rates gained 8% as typhoons, stronger export flows and Middle East shipping disruptions reduced vessel availability. Although the BDI does not quote salt freight directly, it tracks dry-bulk transportation costs that influence the delivered price of high-volume salt cargoes.
The BDI does not translate one-for-one into salt freight rates because charter costs vary by vessel class, route length, cargo size, port charges and contract terms. Higher dry-bulk rates can still raise the charter cost of long-distance salt imports, increasing landed costs unless suppliers absorb the difference. Shorter regional routes reduce shipping distance and exposure to port or scheduling constraints, supporting lower delivered costs and more predictable supply.
US$54/Tonne Rock Salt Value Gives Nearby Mines a Freight Advantage
In its 2026 Mineral Commodity Summaries, the United States Geological Survey (USGS) estimated the average 2025 free on board (FOB) value of rock salt at US$54 per metric ton. That figure excludes freight, port handling, storage and inland transportation, so increases in those costs raise the delivered price paid by municipalities, distributors and industrial consumers even when mine-gate values remain unchanged.
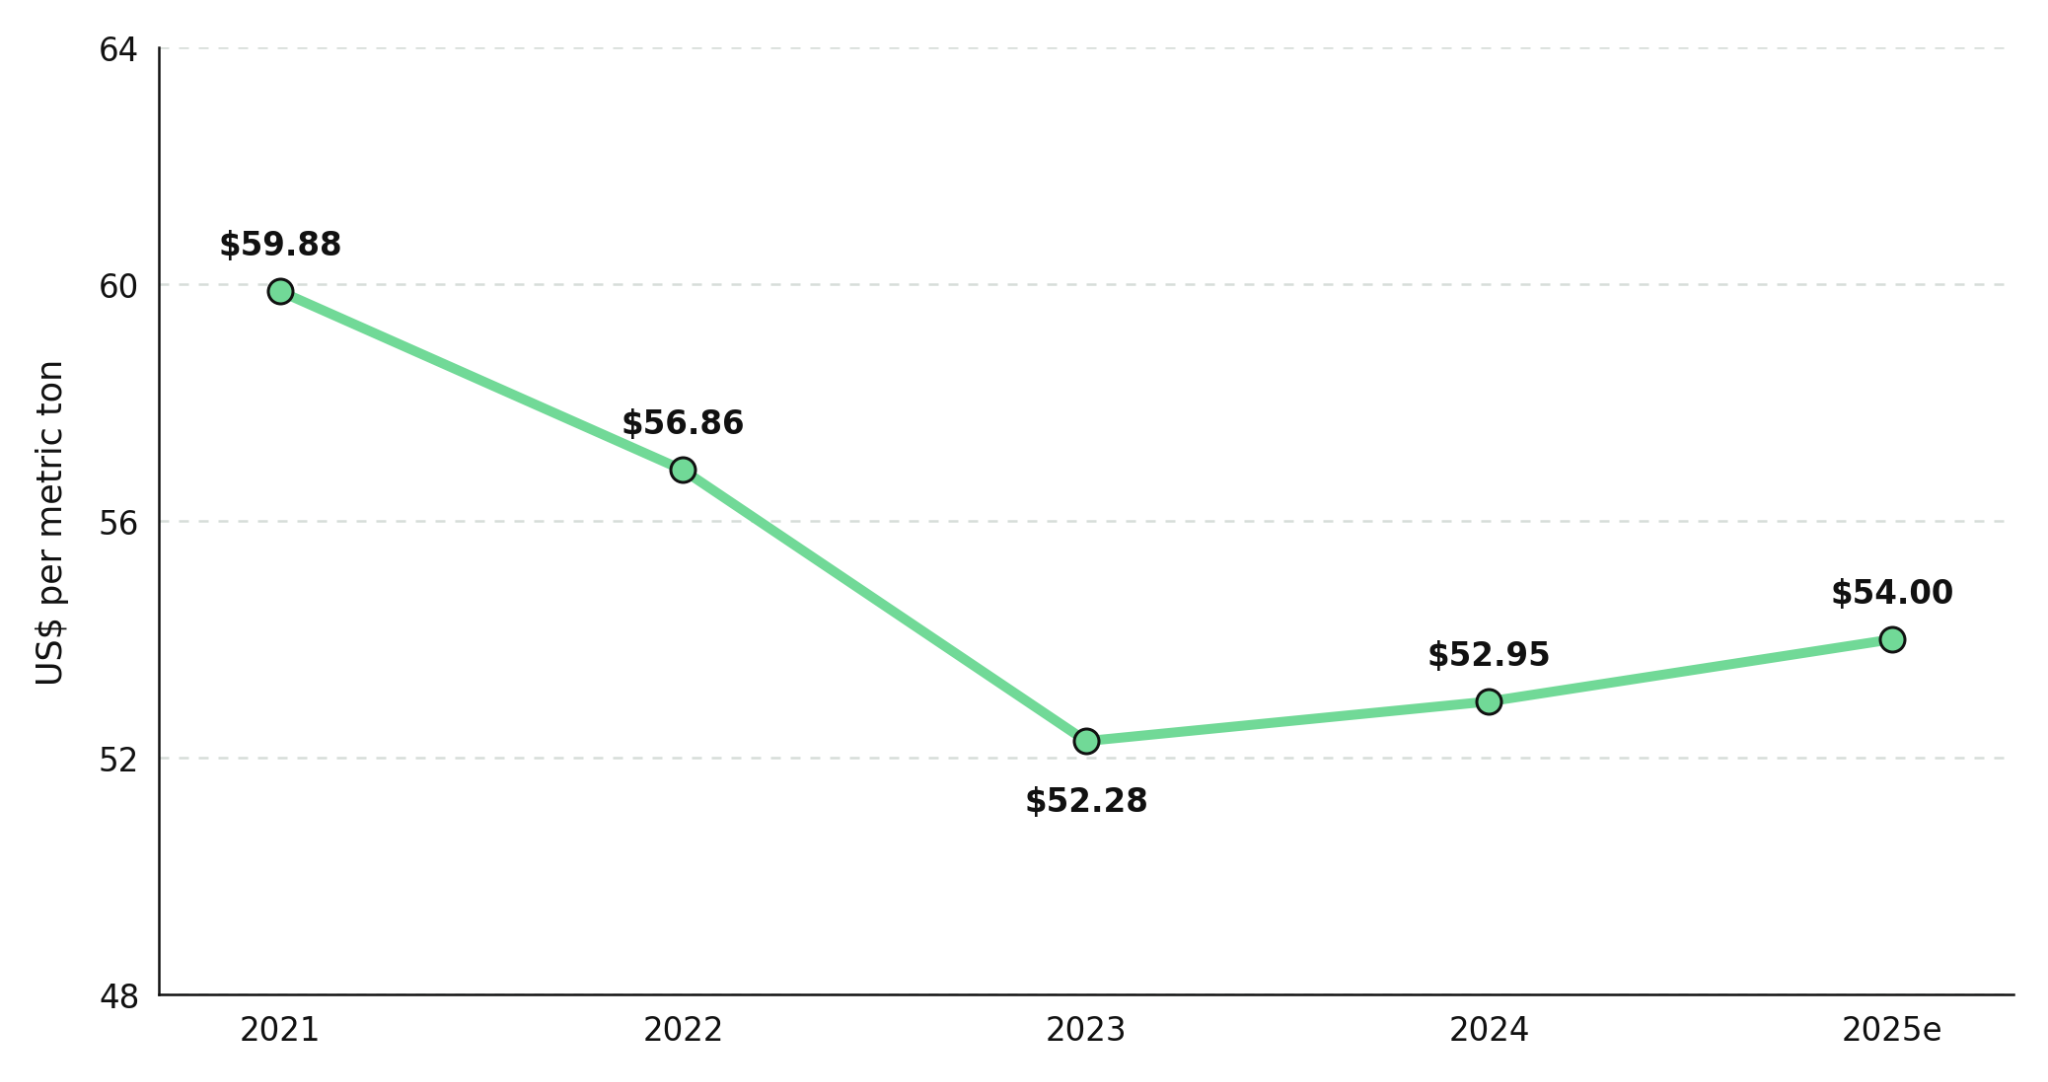
Salt’s low value-to-weight ratio means transportation can represent a larger share of delivered cost than it does for higher-value commodities. A nearby mine gains a delivered-cost advantage when its freight savings exceed any difference in extraction, processing or capital costs, even if global salt prices remain unchanged.
US Salt Import Surge Raises North America’s Freight Exposure
USGS estimates show US salt production remained near 40 million metric tons in 2025 while apparent consumption increased 11%, from 51.3 million metric tons in 2024 to 57 million metric tons. Imports rose 37%, from 13.9 million metric tons to 19 million metric tons, lifting net import reliance from 23% to 31% and accounting for 5.1 million metric tons of the 5.7 million metric ton increase in apparent consumption.
USGS attributed 2025 consumption growth mainly to road salt and chloralkali production, which uses salt to manufacture chlorine and caustic soda. Highway deicing accounted for about 37% of consumption and the chemical industry about 42%, placing approximately 79% of demand in uses that require dependable bulk supply. Greater import reliance increases the volume exposed to ocean freight, so higher shipping rates either compress distributor margins or raise municipal bid prices and industrial procurement costs.
Longer Import Routes Strengthen Regional Salt’s Delivered-Cost Advantage
USGS data show Mexico supplied 26%, Chile 23% and Canada 21% of average US salt imports from 2021 through 2024, concentrating 70% among three countries. The data do not identify each cargo’s destination or route, so these shares measure source concentration rather than exposure to a specific shipping corridor. Large, low-cost operations can offset longer routes through scale, but higher vessel rates and tighter transit capacity raise delivered costs for distant imports, improving the delivered-cost position of supply located closer to buyers.
Atlas Salt gained recognition after the Great Atlantic Salt Project was included in the Canada Investment Summit Prospectus. The recognition comes as the company advances toward a full construction financing package, supported by more than C$300 million in non-binding financing interest. The project is designed to produce four million tonnes of road salt annually for Eastern Canada and the northeastern United States, with a 25-year mine life.
Nolan Peterson, Chief Executive Officer of Atlas Salt, explains the project’s role in underserved salt markets:
“We’re developing the Great Atlantic Salt Project on the west coast of Newfoundland, aiming to supply de-icing road salt to critically underserved markets in the northeast US and eastern Canada and the Atlantic provinces.”
Panama Canal Slot Limits Raise Imported Salt Costs & Delivery Risk
Panama Canal Authority (ACP) Advisory A-31-2026 introduced temporary changes to Neopanamax bookings for transit dates beginning September 13, 2026. The revised system offers 63 slots per week, while vehicle carriers, roll-on/roll-off vessels, bulkers and other segments collectively receive a minimum allocation of three weekly slots. This three-slot floor is not a cap, but it limits guaranteed capacity for the combined segment and leaves additional bulk-carrier access dependent on availability.
Not all salt imports use the Panama Canal. The ACP reported that canal-transiting salt cargoes in early fiscal 2015 originated in Chile and Pacific Mexico and were bound for the United States. Current USGS data do not identify routes, so the volume exposed to canal delays cannot be quantified. Such delays can increase freight and inventory costs for affected shipments.
Canal Water Deficits Raise Delivery Costs & Favor Shorter Routes
The ACP states that while the canal watershed’s water deficit continues, the booking system remains the only way to guarantee a transit date, and vessels without reservations may face indefinite delays. This links route reliability to watershed conditions, so low water levels can extend delivery times and increase charter and inventory costs.
The lowest freight quote may not produce the lowest total delivered cost if canal delays require larger inventories or replacement purchases. A nearer Atlantic source can reduce canal exposure, shorten lead times and lower working capital tied up in transit for eastern buyers. Higher rainfall or changes to canal operating policies could restore capacity, but routes with fewer constrained links provide more predictable delivery during fixed procurement periods.
Logistics Constraints Limit Salt Bids & Raise Municipal Prices
Municipal tenders show that salt can remain available at the mine while limited transport capacity or supplier participation restricts delivery. These local cases are not national price benchmarks, but they show that suppliers may decline to bid when contract prices do not cover freight, inventory and delivery risk.
In September 2026, the Weirton Daily Times reported that Weirton received no bids for its road-salt contract and authorized spot purchases of up to US$175 per short ton, nearly double the prior season’s US$88.38 and 125% above the US$77.69 paid two years earlier. TribLive reported that a Pennsylvania regional purchasing group also received no initial bids and obtained one offer at US$160 per short ton after retendering, approximately 81% above the previous price of US$88.
The municipal prices are not directly comparable with the USGS US$54-per-metric-ton FOB value because a short ton equals 2,000 pounds, compared with approximately 2,204.6 pounds for a metric ton, and the contracts include delivery obligations. The comparison nevertheless shows how freight, inventory and contract-fulfillment costs can push municipal prices above mine-gate values.
High Freight Costs & Import Reliance Favor Nearby Salt Supply
Salt is abundant, but its low value relative to its weight makes transportation a major part of delivered cost. Municipal and industrial buyers require large volumes within fixed procurement periods, so delays can force higher-priced spot purchases. Shorter routes reduce freight, handling and scheduling exposure, strengthening regional supply’s cost and reliability advantages over distant imports.
The Investment Thesis for Salt
- Producers with low-cost mines, port access and established distribution networks can protect margins when vessel and inland transportation costs rise.
- Developers near major demand centers can reduce freight exposure, but their projects must remain viable if charter rates decline.
- Large, long-life resources can serve regional supply gaps across multiple freight cycles, but they require larger financing commitments, construction programs and production ramp-ups.
- Projects with coordinated local and provincial permitting face lower risk of delays that reduce the value of their logistics advantage.
- Visible permitting schedules and permanent early works can improve lender confidence, but nonbinding financing interest is not committed capital.
- Capital discipline remains essential because construction cost overruns or slow underground development can offset freight savings.
- Geological resources become deliverable supply only when product quality, stockpiling capacity, port infrastructure and inland distribution support the required volumes and schedules.
- Lower shipping rates would narrow the delivered-cost advantage of nearby supply, but 31% net import reliance and annual procurement cycles would continue to support demand for reliable regional delivery.
- Projects are more robust when their base-case economics do not require permanent freight inflation, allowing higher logistics costs to improve cash flow rather than determine project viability.
Salt is abundant globally, but its value depends on delivering dependable tons to specific markets at a competitive cost. Higher dry-bulk rates, 31% US net import reliance and constrained maritime capacity have increased the delivered-cost advantage of supply near eastern North American markets. Shorter routes can improve delivery reliability and margins, but developers still need financing, engineering and disciplined construction to convert location into cash flow. Salt projects therefore function as logistics-linked infrastructure as much as mineral deposits, with scale and transport reliability determining which resources can compete across freight cycles.
TL;DR
Dry-bulk shipping costs have become a larger part of salt’s delivered price because rock salt is heavy and relatively low value. The Baltic Dry Index rose 77% in 2026, while US salt imports increased 37% and net import reliance reached 31%. Panama Canal booking limits add delivery and inventory risk for some routes, while municipal no-bid tenders show how logistics constraints can lift local prices. Regional supply near Eastern Canadian and northeastern US buyers can reduce freight exposure, shorten delivery times and improve reliability, but project value still depends on competitive operating costs, financing, permitting and disciplined construction.
FAQs (AI-Generated)
Analyst's Notes





Subscribe to Our Channel

.jpg)


Stay Informed


