




A Sixth Consecutive Silver Deficit: Has Fed Policy Delayed the Market's Repricing?


Silver's sixth consecutive annual deficit persists despite weaker prices as Fed policy, supply constraints, and jurisdictional risks shape the market outlook.
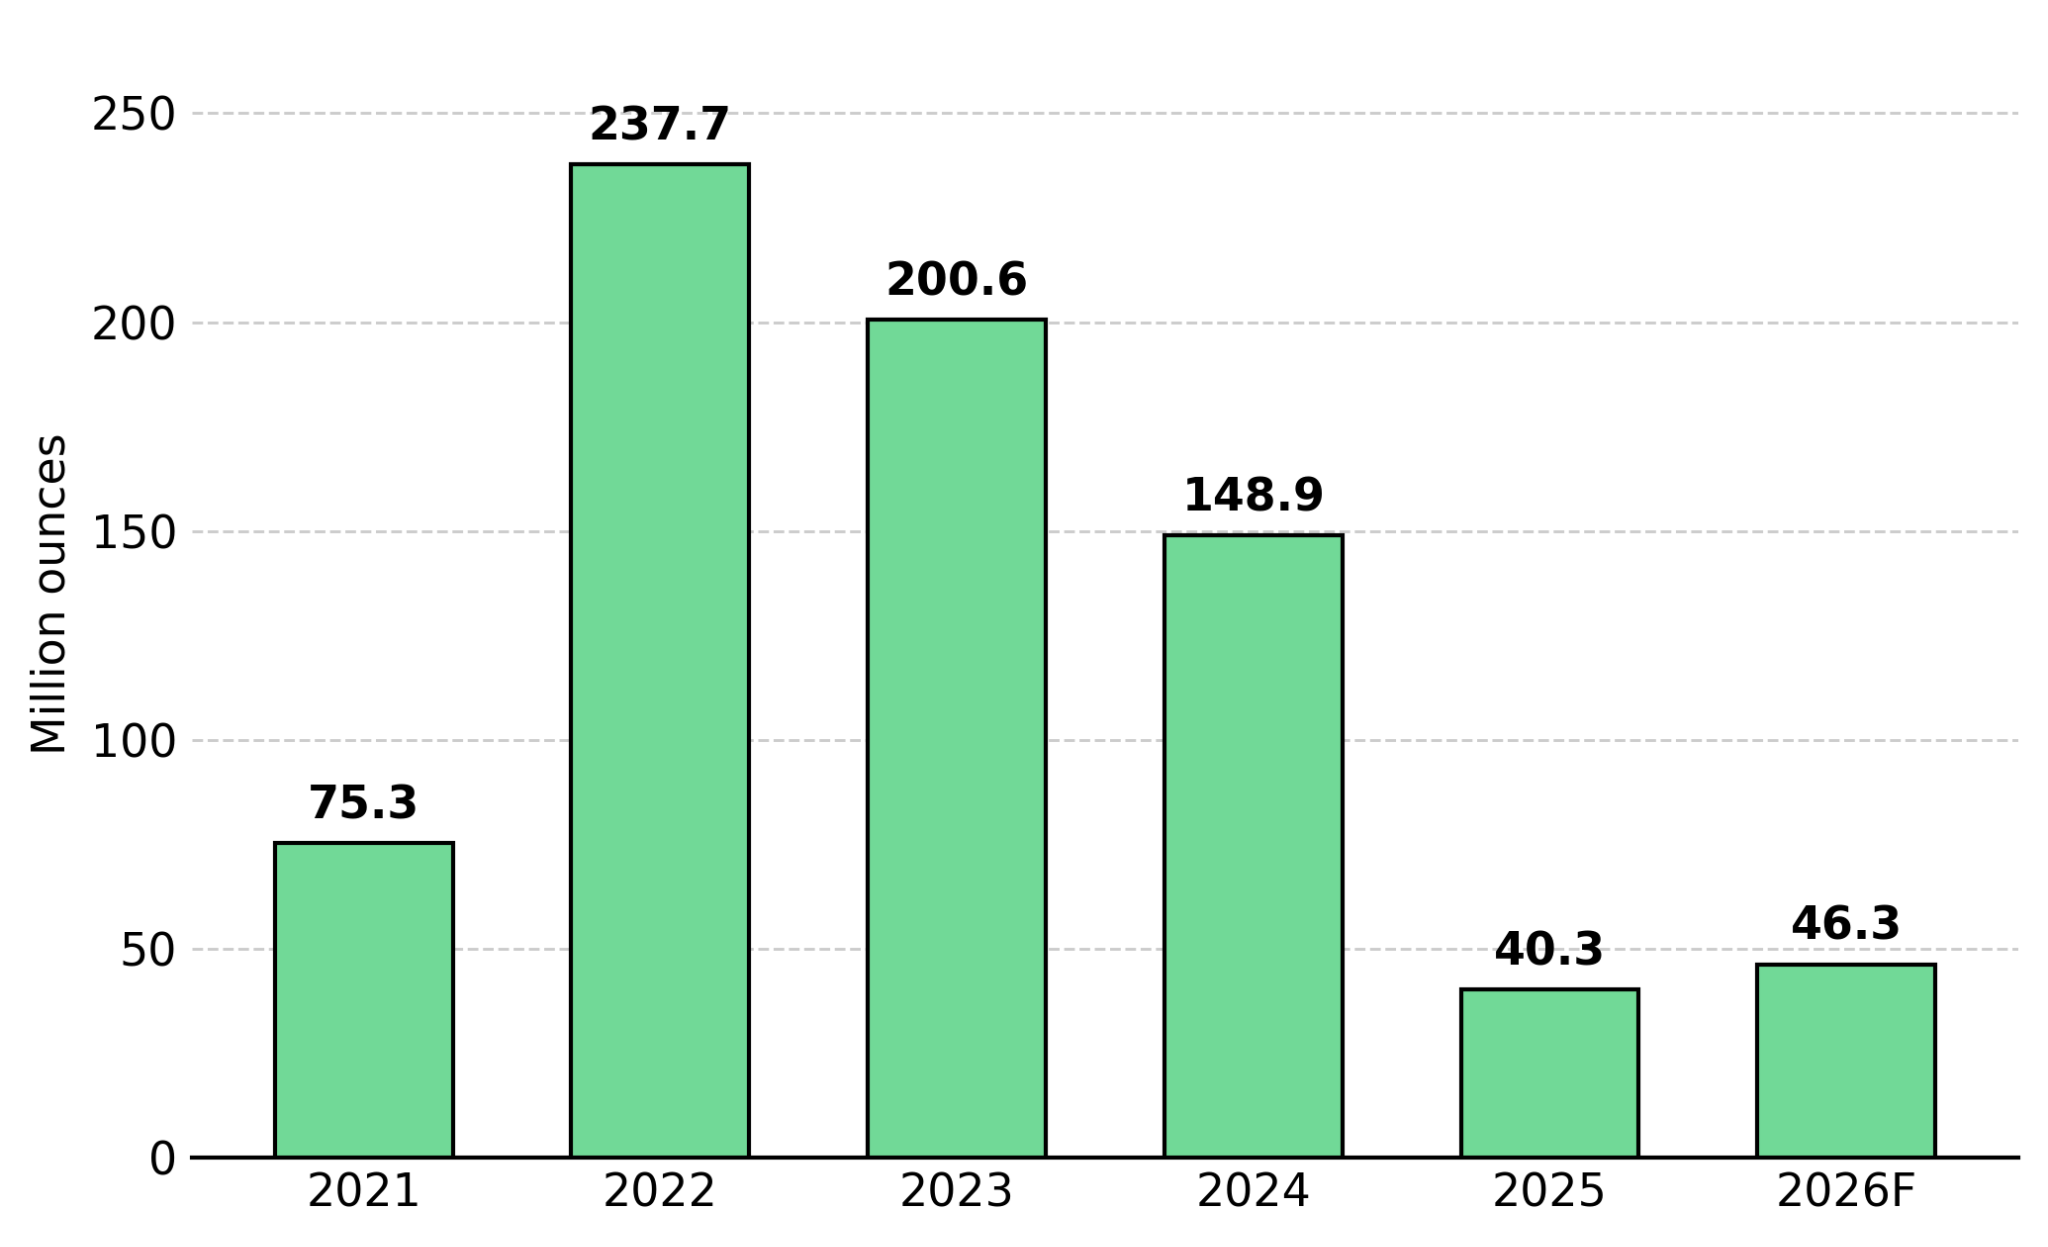
- Silver has traded between $58 and $60 per ounce, down roughly 51% from its January 29, 2026 high of $121.58, even as the Silver Institute's World Silver Survey 2026 reports a sixth consecutive annual deficit of 46.3 million ounces.
- Roughly 70% of mined silver comes as a byproduct of copper, lead, and zinc production, limiting how quickly supply can respond to higher prices, a constraint reinforced by China's new export licensing regime.
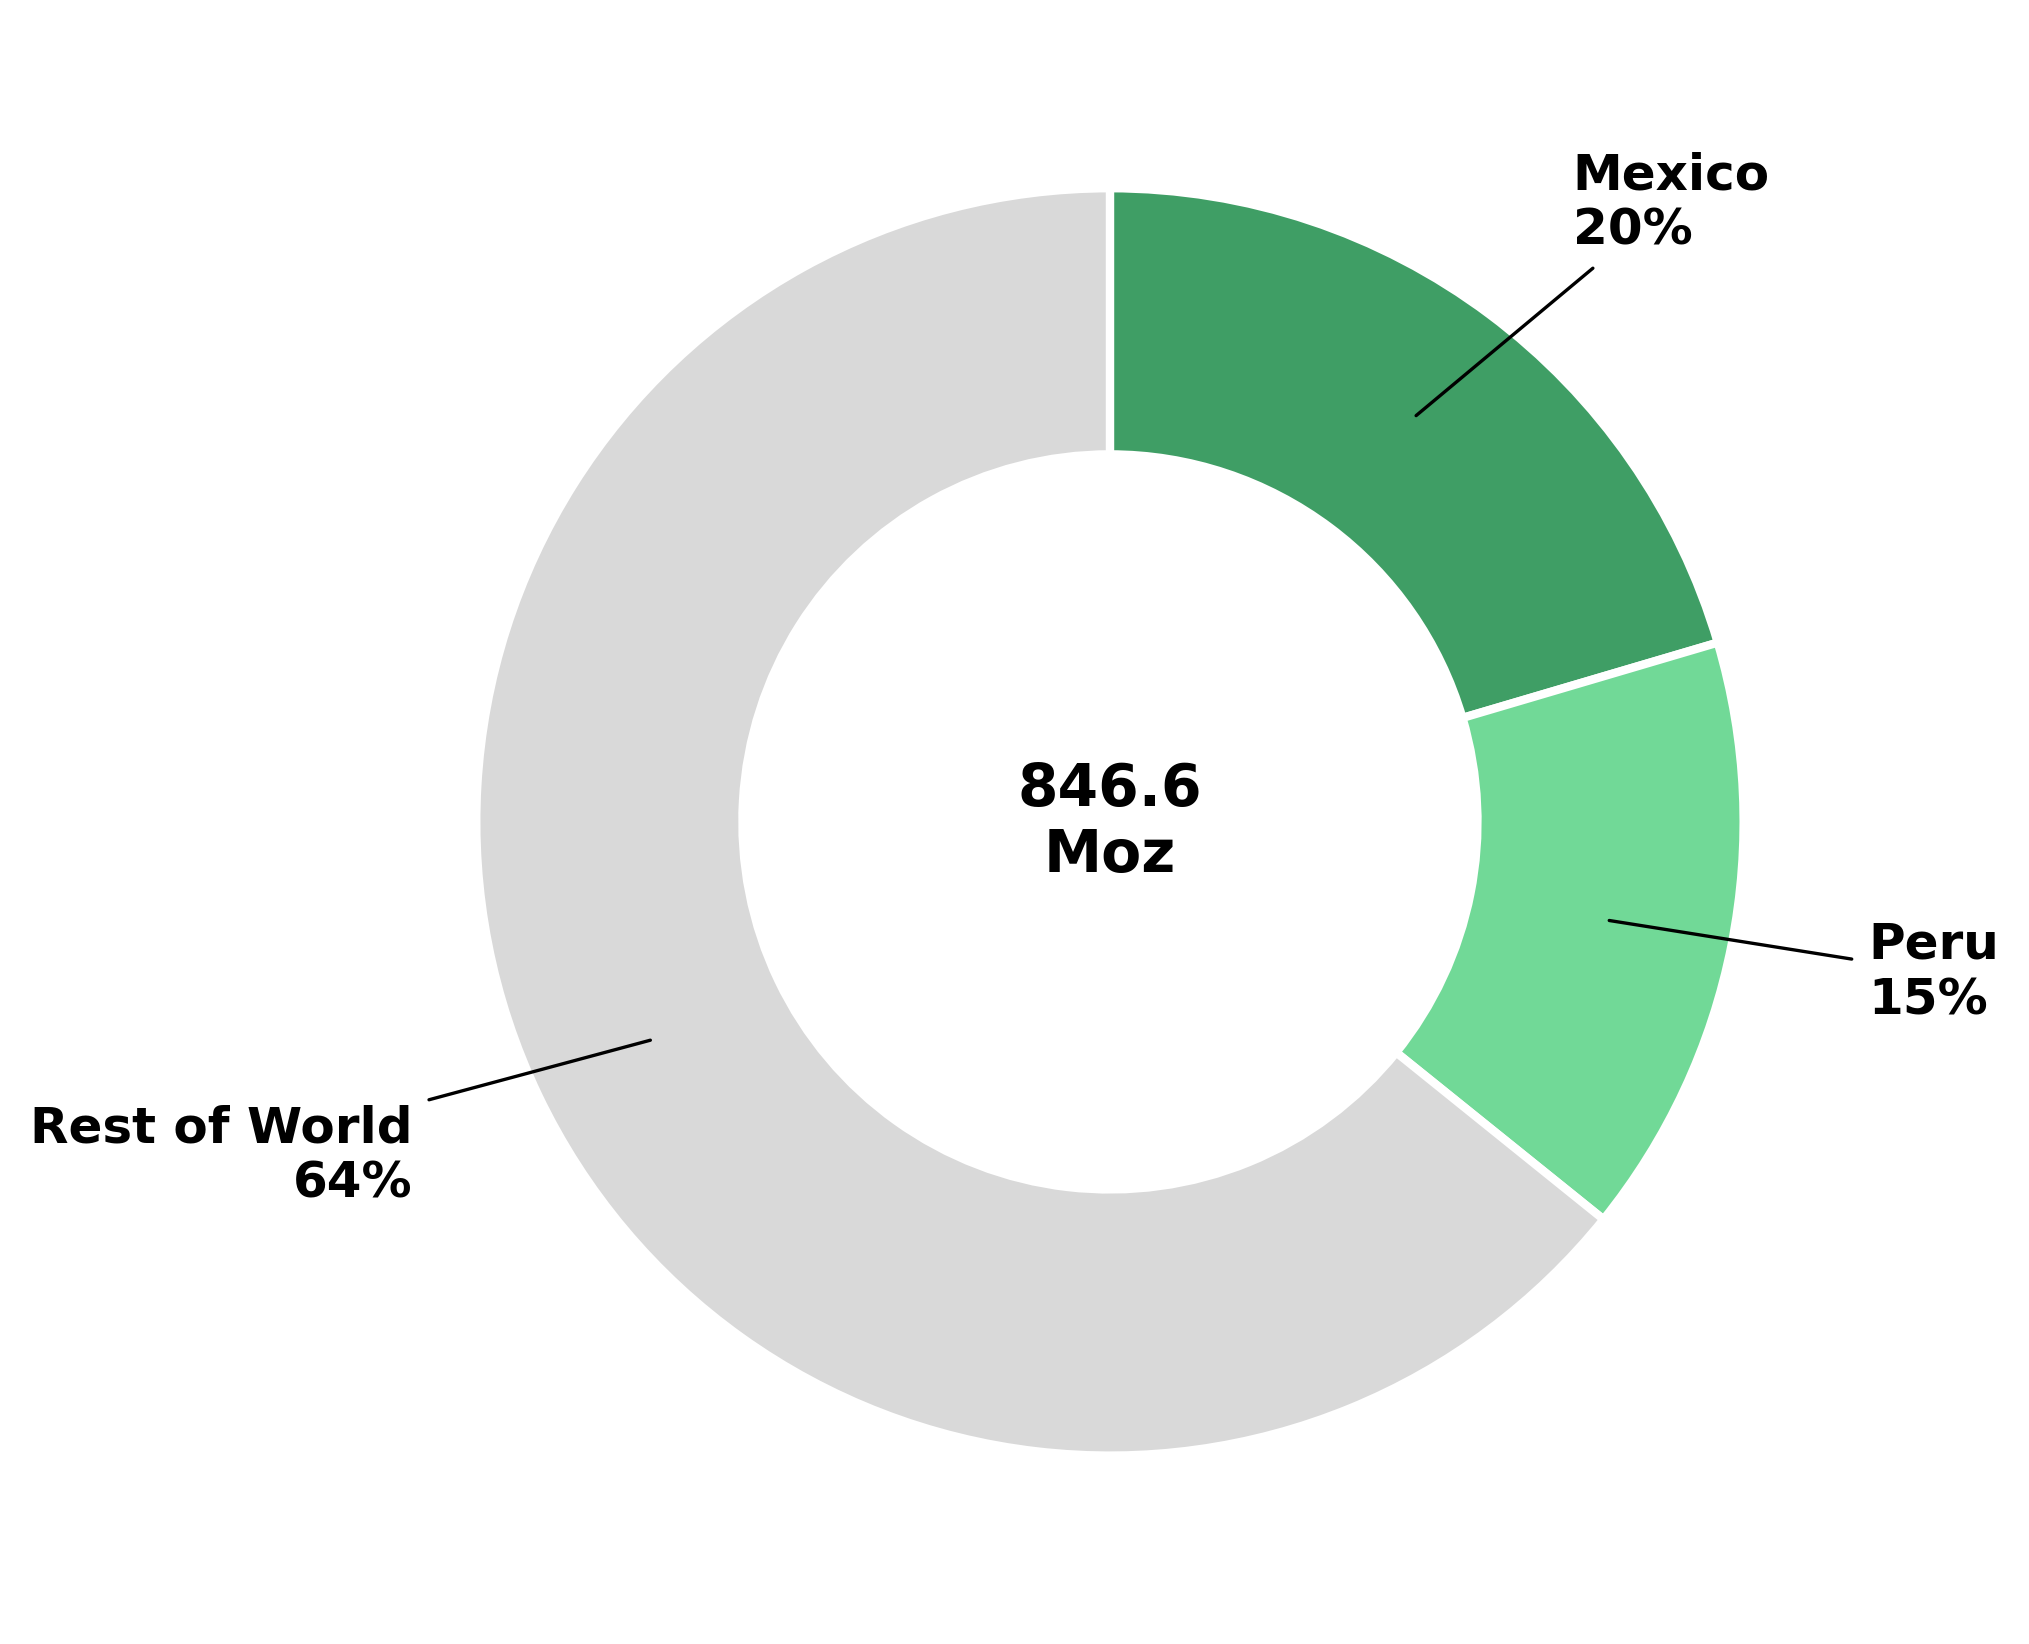
- Mexico and Peru together account for roughly one-third of global mine supply, with Mexico facing annual USMCA trade policy reviews and Peru operating under an energy emergency decree that could increase supply risk.
- A hawkish Fed and a stronger dollar have pressured silver lower even as the market deficit has widened, showing that macroeconomic conditions continue to outweigh physical supply fundamentals.
- Production, development, and exploration companies represent different stages of the mine supply pipeline, showing how new supply could emerge over time as the market responds to the deficit.
Macroeconomic Headwinds & a Widening Silver Deficit: Why Prices Have Lagged
Silver has traded between $58 and $60 per ounce through late July 2026, down about 51% from its January 29 record of $121.58. The Silver Institute's World Silver Survey 2026 confirmed a sixth consecutive annual market deficit of 46.3 million ounces, the largest on record, while J.P. Morgan forecasts an average 2026 silver price of about $81 per ounce, well above recent spot prices.
The lag is monetary, not physical: because silver carries no yield, a hawkish Fed and a stronger dollar have raised its opportunity cost relative to income-bearing assets, pressuring prices even as the physical shortage widens.
Inelastic Mine Supply & Export Licensing: Why the Silver Deficit Keeps Widening
Global mined silver supply rose about 3% in 2025 to roughly 846.6 million ounces, even as silver later reached a record price in January 2026, according to Silver Institute production data. Demand grew faster than mine supply, and understanding why production could not respond even with silver above $120 per ounce is central to assessing whether the deficit reflects a structural supply constraint.
Byproduct Mining Limits How Quickly Silver Supply Can Respond
Approximately 70% of global silver production comes as a byproduct of copper, lead, and zinc mining, making silver output largely a function of base metal investment decisions rather than the silver price itself. A copper mine does not expand production because silver prices rise; expansion depends on copper economics, with silver generated as a byproduct regardless of its standalone price.
Oliver Turner, Executive Vice President of Corporate Development at Americas Gold & Silver, a primary producer where silver represents approximately 80% of revenue, explained why that byproduct structure changes how the market should be read:
"70% of silver is a byproduct from other mines, a significant portion of that being copper mines. You can't just turn on more silver supply when the world needs it."
The distinction is important because primary silver producers such as Americas Gold & Silver are more directly exposed to silver market fundamentals. Its mine plan is driven primarily by silver economics rather than copper or zinc markets, allowing production decisions to respond more directly to changes in silver prices than those of a byproduct-weighted operation.
China's Export Licensing Reinforces Structural Silver Supply Constraints
Export policy has introduced a second supply constraint alongside mine-level inelasticity. Beginning with the 2026–2027 licensing cycle, China replaced its quota system with an export licensing regime covering 44 authorized silver exporters, up from 42 previously. Exporters must produce at least 80 tonnes annually and maintain $30 million in available credit, effectively excluding smaller refiners from direct export licenses.
An estimated 60 to 70% of global silver supply is now subject to China's export licensing regime, limiting material reaching international markets without regulatory approval. Unlike mine-level production constraints, which higher prices can eventually encourage producers to address, export licensing remains in place regardless of silver prices. This suggests part of the current market deficit reflects structural rather than cyclical constraints.
Mexico & Peru Concentration Risk: Jurisdictional Exposure Reinforces Structural Supply Risks
Mexico and Peru together account for roughly one-third of global mined silver supply, according to Silver Institute country-level production data, increasing the market's exposure to supply disruptions in those two jurisdictions. Both face policy-related pressures this year that are unrelated to ore grade or mine planning.
Mexico's Declining Silver Output Faces Trade Policy Uncertainty
Mexico's silver output fell about 5% in 2025 to roughly 173 million ounces, marking a third consecutive annual decline even as it remained the world's largest source of mined silver. Separately, Washington's decision against a 16-year USMCA extension leaves the agreement subject to annual reviews, reducing long-term policy certainty for cross-border investment. Despite this, development-stage company Vizsla Silver secured a MXN$173 million (about $10 million) working capital facility from Mexico's government-backed Fideicomiso de Fomento Minero to support its wholly owned Panuco project, showing that project-level financing remains available despite broader policy uncertainty.
Michael Konnert, Chief Executive Officer of Vizsla Silver, framed the facility as more than a routine financing transaction:
"This agreement with FIFOMI represents another important step in the continued endorsement and validation of the Panuco Project as an economically important development project for both Sinaloa and Mexico."
A state-level mining finance institution's willingness to extend an unsecured facility does not offset federal trade policy risk, but it suggests that federal trade uncertainty and domestic support for mining investment can coexist.
Peru's Energy Crisis Threatens One of Silver's Few Growing Supply Sources
Peru's Emergency Decree No. 003-2026, introduced in response to the Petroperú energy crisis, increases operational risk for a country producing about 130 million ounces of silver annually and supplying roughly half of China's silver-bearing concentrate imports. Unlike Mexico, where silver output has declined for three consecutive years, Peru's production rose about 7% in 2025, meaning the decree introduces risk to a growing supply source.
Why Silver Prices Have Not Caught Up to the Deficit
Silver carries no coupon or dividend, so higher expected policy rates increase its opportunity cost relative to yield-bearing assets. June CPI slowed to 3.5% year over year, below the 3.8% consensus estimate, making the July 28-29 Fed meeting the next key catalyst. With markets pricing an 89% probability that rates remain unchanged and no Summary of Economic Projections scheduled, attention will center on Chair Kevin Warsh's press conference and policy statement. A neutral or dovish tone could support a rebound toward the mid-$60s, while a repeat of Warsh's earlier view that "prices are too high" could increase the likelihood of silver retesting support in the low $50s.
The COMEX Squeeze Falls to 6.3:1
COMEX registered silver inventories have rebuilt to about 87.4 million ounces, while the paper-to-physical ratio has fallen from roughly 28:1 to 6.3:1, indicating that near-term delivery stress has eased without resolving the broader annual market deficit. Exploration capital, by contrast, targets long-term supply growth. GR Silver Mining is advancing a 20,000-meter step-out drill program at its San Marcial discovery to expand a resource currently estimated at 46 million ounces of indicated silver and 14 million ounces inferred, ahead of a resource update expected in late 2026.
Eric Zaunscherb, President and Chief Executive Officer of GR Silver Mining, described the scale of what remains untested:
"We've only covered about 20% of the perimeter of that intrusive, so that other 80% of the perimeter of the intrusive is prospective."
Discovery economics operate on a multi-year timeline that is largely independent of this week's COMEX delivery activity. Exploration-stage resource growth and near-term silver price movements therefore provide different market signals and should not be interpreted as contradictory.
Production, Development & Exploration: How Each Stage Addresses the Deficit
At the production stage, Americas Gold & Silver is targeting 3.2 to 3.6 million ounces in 2026, about 30% above 2025, after a $1.1 million shaft upgrade more than doubled hoisting capacity at its Galena Complex. The planned increase shows a primary producer expanding output even as the broader silver market remains in deficit.
Further along the development pipeline, Vizsla Silver's November 2025 feasibility study for Panuco outlines an after-tax net present value of $1.8 billion and a 111% internal rate of return based on a silver price of $35.50 per ounce, about 40% below prevailing market prices. A recently awarded equipment supply agreement indicates the project is advancing beyond the feasibility stage despite conservative price assumptions.
At the exploration stage, GR Silver Mining's 150-meter step-out extension at San Marcial intersected 21.9 meters grading 168 grams per tonne silver, including 6.15 meters at 447 grams per tonne, supporting further resource growth. A resource update is targeted for late 2026, followed by a preliminary economic assessment in the first half of 2027, advancing the project toward potential future mine development.
Macro Headwinds vs. Structural Deficits: Which Ultimately Drives Silver Prices?
The deficit data supports the view that supply constraints remain durable. Price action over the past six months has been more consistent with a tactical, Fed-driven correction. Whether the recent correction reflects a temporary disconnect from physical fundamentals or a reassessment of the structural deficit will become clearer as new market and policy data emerge over the coming weeks.
Four indicators are worth monitoring: whether COMEX registered inventories resume declining after the current rebuild cycle, whether China maintains or reduces the number of export licenses issued for 2027, whether production data from Mexico and Peru reinforce or weaken the concentration risks described above, and whether Chair Kevin Warsh's comments at the July 29 press conference differ from his earlier view that "prices are too high." None of these indicators is decisive on its own. Taken together, they provide the clearest basis for assessing whether the structural supply thesis remains supported by incoming evidence.
The Investment Thesis for Silver
- The silver market has remained in deficit for six consecutive years, reflecting byproduct-driven supply inelasticity rather than a cyclical decline in mine output that higher prices alone can quickly reverse.
- China's export licensing regime narrows the pool of eligible exporters through fixed production and credit thresholds, constraints that remain in place regardless of changes in the silver price.
- Mexico and Peru together account for roughly one-third of global mined silver supply, increasing the market's exposure to jurisdictional disruptions that could tighten supply further and support higher silver prices.
- Production, development, and exploration-stage companies represent different stages of the future supply pipeline, from near-term output growth to projects advancing through feasibility under conservative price assumptions and long-term resource expansion.
- Near-term price action and the multi-year supply outlook currently point in different directions. The Fed's communication at its upcoming meeting will be an important near-term indicator of whether macroeconomic conditions continue to outweigh physical supply fundamentals.
The evidence presented here supports the view that the physical shortage underlying the silver market remains intact despite recent price weakness. Six consecutive annual deficits, a byproduct supply structure that cannot readily expand in response to higher prices, and an export licensing regime covering the majority of China's refined silver exports all point to a market that remains physically undersupplied regardless of recent price movements. What remains uncertain is the timing over which prices adjust to those supply conditions, with monetary policy currently exerting greater influence than changes in mine output. Production-, development-, and exploration-stage companies each illustrate a different stage of the future supply pipeline. The coming weeks, beginning with the Fed's July 29 policy decision, are likely to provide more evidence on whether macroeconomic conditions continue to outweigh physical supply fundamentals than any single supply data release this year.
TL;DR
Silver has recorded a sixth consecutive annual market deficit, yet prices remain well below their January 2026 peak as hawkish Fed policy and a stronger dollar continue to outweigh physical supply fundamentals. The article argues that byproduct mining, China's export licensing regime, and concentration risks in Mexico and Peru support a persistent supply imbalance, while easing COMEX delivery pressure should not be mistaken for a resolved deficit. It also examines how production, development, and exploration companies contribute at different stages of the future supply pipeline and identifies Fed policy, export licensing, inventories, and mine supply as the key indicators to watch.
FAQs (AI-Generated)
Analyst's Notes





Subscribe to Our Channel












Stay Informed






