Fed Hikes Push Gold Lower: Miners With Low Costs Can Protect Cash Flow



Bar and coin demand held near its five-year average at 307 tonnes. A 10-year Treasury yield below 5% could reduce bond competition for gold.
- Spot gold traded at $4,291 an ounce on 25 September, down about 2% for the week, after the Fed's first hike in three years and 71% CME FedWatch odds of another on 28 October.
- The US 10-year Treasury yield reached 5.12% on 23 September, its highest since 2007, raising the cost of holding non-yielding gold faster than above-target inflation lifts its hedge value.
- At Q1 2026 costs, a further 10% gold fall narrows average producer margin by about 17% and 90th-percentile margin by about 24%, per World Gold Council data.
- With the October hike largely priced, cost flexibility and balance sheets, not the Fed call, separate outcomes for holders of gold producer equities.
- A 10-year yield close below 5.00%, reported daily in the Fed's H.15 release, would lift the main weight on gold.
Fed Hike Pricing Lifts Treasury Yields and Puts Gold on Course for a Weekly Loss
Spot gold was down more than 2% for the week as the Fed’s hike to 3.75% to 4.00% and a 71% CME FedWatch probability of another October hike raised the appeal of interest-bearing assets.
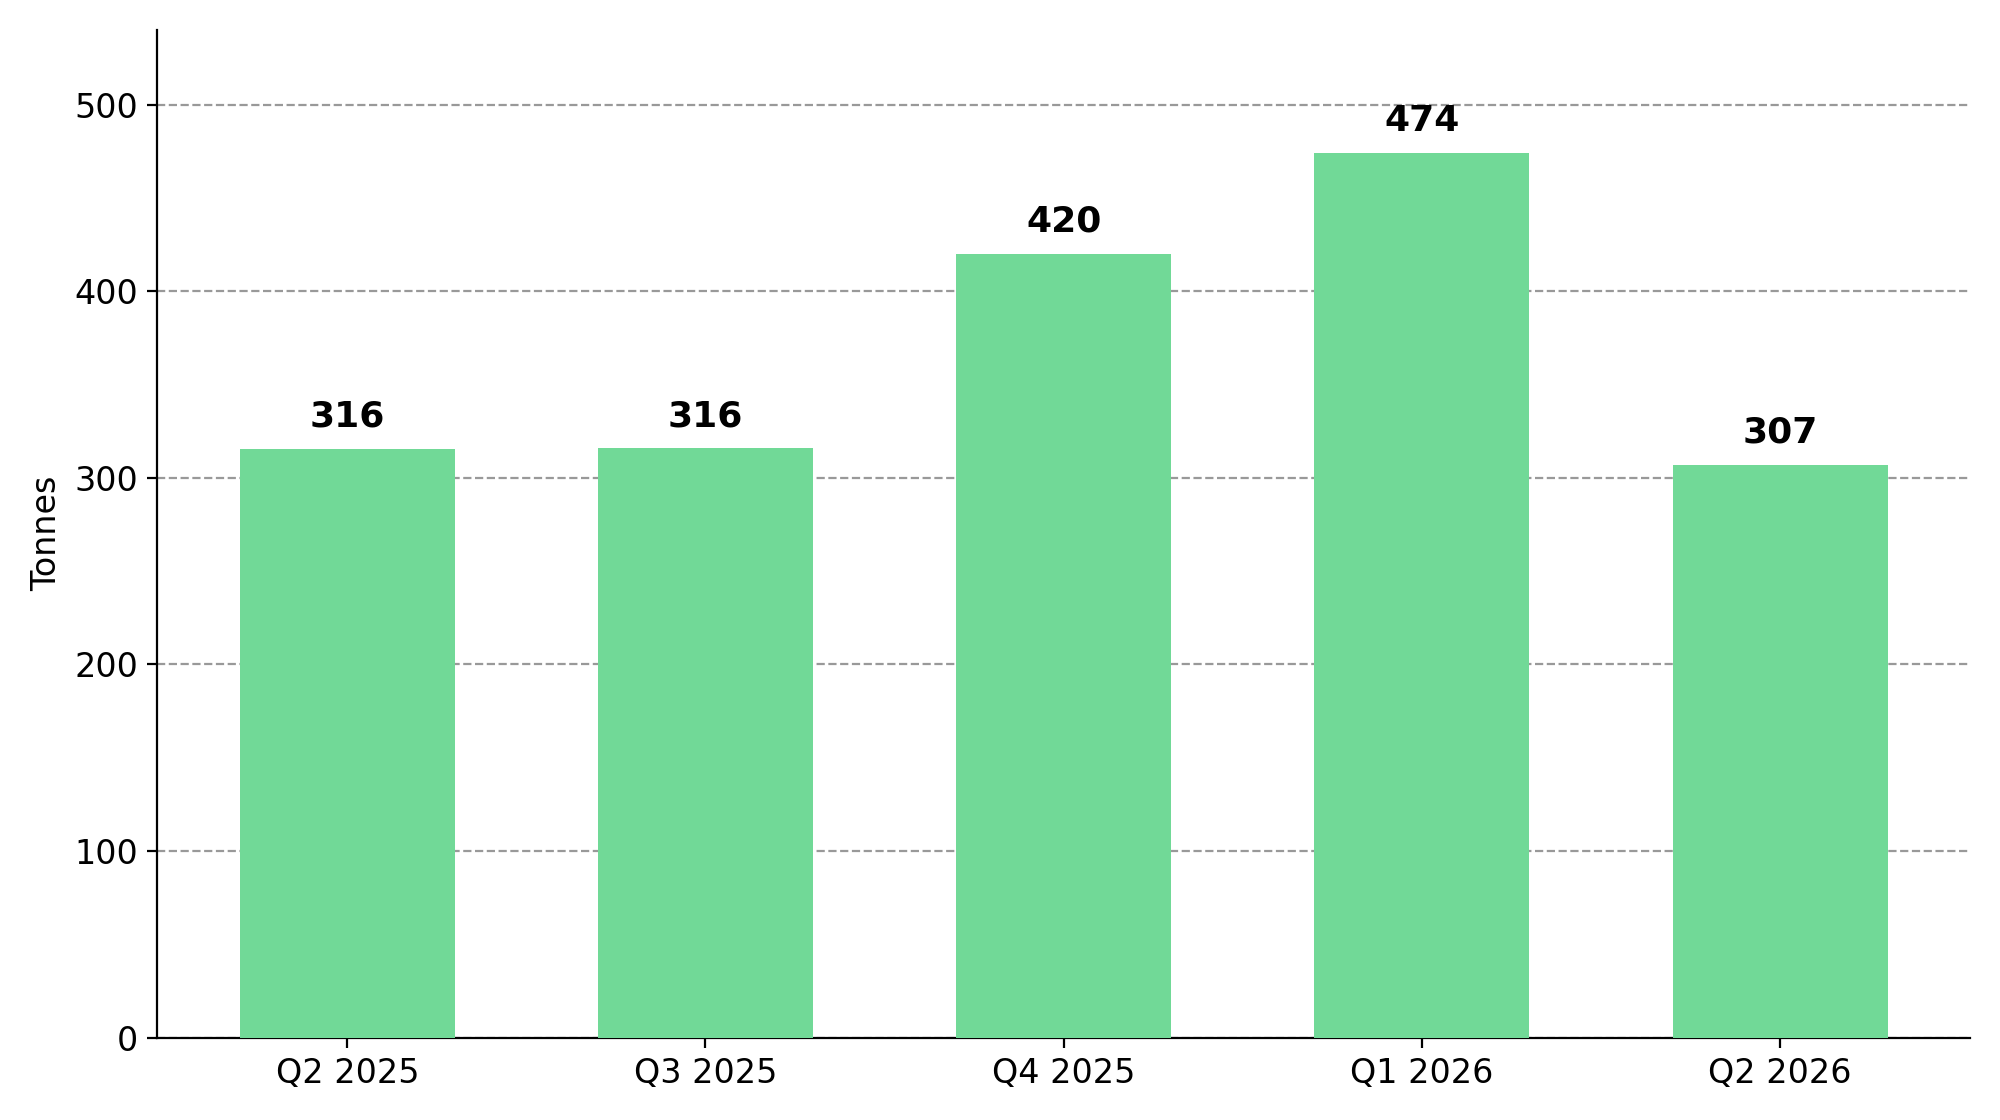
Higher rates raised the cost of holding gold despite US inflation remaining above the Fed’s 2% target. Gold traded about 23% below its $5,595 January record. The World Gold Council’s Gold Demand Trends: Q2 2026 reported 45 tonnes of gold exchange-traded fund outflows, while bar and coin demand fell from a revised 477 tonnes in Q1 to 307 tonnes in Q2, close to its five-year quarterly average of 305 tonnes.
Oil-Led Inflation & a Hawkish Fed Raise the Cost of Holding Gold
Disruption in the Strait of Hormuz kept Brent above $100 a barrel, adding to US fuel costs and inflation pressure. The Fed raised its target rate range to 3.75% to 4.00%, and its median end-2026 rate projection rose to 4.1% from 3.8% in June. The 10-year Treasury yield reached 5.11% on September 23, increasing the income forgone by holding gold, while a stronger dollar made it costlier for buyers using other currencies.
US and Iranian negotiators are exploring a phased deal to reopen the Strait and lift the US blockade, but Iran’s offer remains conditional. Reopened shipping could lower oil prices and rate-hike expectations, supporting gold. S&P Global’s flash US Composite PMI rose from 56.0 in August to 58.4 in September, its highest since July 2021, giving the Fed room to raise rates again if inflation stays elevated.
October Fed Decision Sets the Margin Test Across the Gold Cost Curve
A ceasefire could leave oil shipments constrained. Nitesh Shah, Commodity Strategist at WisdomTree, said rate-hike fears could persist until the Strait of Hormuz disruption is resolved.
The World Gold Council’s August 24 analysis of Q1 2026 costs put average all-in sustaining cost (AISC) at $1,785 an ounce and implies about $2,500 at the 90th percentile. At $4,291 gold and unchanged Q1 costs, estimated AISC margins are about $2,500 an ounce on average and $1,800 at the 90th percentile. A 10% gold decline would cut those margins by about 17% and 24%, respectively; a rebound would restore a larger share of the higher-cost group’s margin.
Ahead of the Fed’s October 28 decision, a 10-year Treasury yield below 5.00% in the Fed’s H.15 release would signal less competition for gold from bonds. Producer margins would widen only if gold rises or costs fall.
Higher Rates Test Cost Flexibility & Financing
Higher rates squeeze miners through two channels: a gold decline cuts a larger share of high-cost mines’ per-ounce margins, while higher borrowing costs and discount rates reduce the value of undeveloped projects. The World Gold Council’s August 24, 2026 cost analysis reported a record Q1 average AISC margin of $3,076 an ounce and noted that several producers held net cash positions.
Price-linked royalties can cushion a gold decline because royalty costs fall as revenue falls. The same analysis put royalties at 12% of average AISC in Q1 2026, up from 6% in Q1 2021. Ghana’s sliding-scale royalty reaches 12% above $4,500 an ounce, leaving mines subject to that regime below its top band with gold near $4,290. Fuel inventories, hedges and supply contracts protected many larger producers from the March oil spike, though prolonged high fuel prices could raise later costs.
With a 71% probability of an October hike priced by CME FedWatch, disclosed costs, royalty terms, fuel protection and net cash distinguish producers. Higher-cost mines face larger percentage margin losses if gold falls, but also larger percentage gains if it rebounds.
Rate-Driven Selloff Rewards Low-Cost Gold Producers
Higher Treasury yields raise the income forgone by holding gold, but physical demand has held up: the World Gold Council recorded 307 tonnes of bar and coin demand, near its five-year quarterly average of 305 tonnes. At gold near $4,290 and unchanged Q1 costs, its August 24 cost analysis implies an average all-in sustaining cost margin of about $2,500 an ounce.
Low costs, net cash and royalties that fall with the gold price can protect producer cash flow during a decline. Higher financing costs can delay new mines, while a gold rebound would widen existing producers’ margins.
Analyst's Notes





Subscribe to Our Channel




Stay Informed