Gold's Steepest Drop Since 2013 Meets Record Central Bank Buying & Stronger Producer Economics



Gold’s steepest quarterly decline since 2013 tests producer economics as central banks buy a record 288.9 tonnes and Fed uncertainty persists.
- Spot gold recorded its steepest quarterly decline since 2013 in the second quarter of 2026, while central bank net purchases reached a record 288.9 tonnes, showing that official-sector demand held through the price correction.
- The Fed held rates at 3.5% to 3.75% in July 2026, with three of twelve voting members favoring a 25-basis-point hike, while a 23,000 decline in July payrolls lifted the CME FedWatch probability of a September hold from roughly 33% to 60% within a week.
- Integra Resources increased Florida Canyon reserves 74% in its June 2026 feasibility study, while West Red Lake Gold Mines lifted second-quarter mined grade 23% to 4.3 g/t, strengthening reserve life and operating margins without requiring a higher gold price.
- Serabi Gold ended June 2026 debt-free with $65.7 million in cash, while i-80 Gold secured more than $1 billion to fund its Phase 1 and Phase 2 development plan, including the $430 million Lone Tree processing plant refurbishment.
- Mineros S.A. cut cash costs at its Pioneer and Panama mines from nearly $3,000/oz to $1,200/oz by removing a processing bottleneck, while its July 2026 treasury policy allows a measured portion of gold production to be retained as physical bullion.
Fed Rate Uncertainty Pressures Gold & Puts Producer Margins to the Test
Gold recorded its steepest quarterly decline since 2013 in the second quarter of 2026, while the Fed held rates at 3.5% to 3.75% in July with three of twelve voting members favoring a 25-basis-point hike. The price decline makes grade, recovery, AISC and balance-sheet strength clearer measures of which producers can protect margins without relying on a higher gold price.
Weak Jobs Data Cuts Fed Hike Odds & Reduces Pressure on Gold
Nonfarm payrolls fell by 23,000 in July against a consensus gain of 83,000, while unemployment declined to 4.1% from 4.2% as 264,000 people left the labor force, pushing participation to a five-and-a-half-year low of 61.4%.
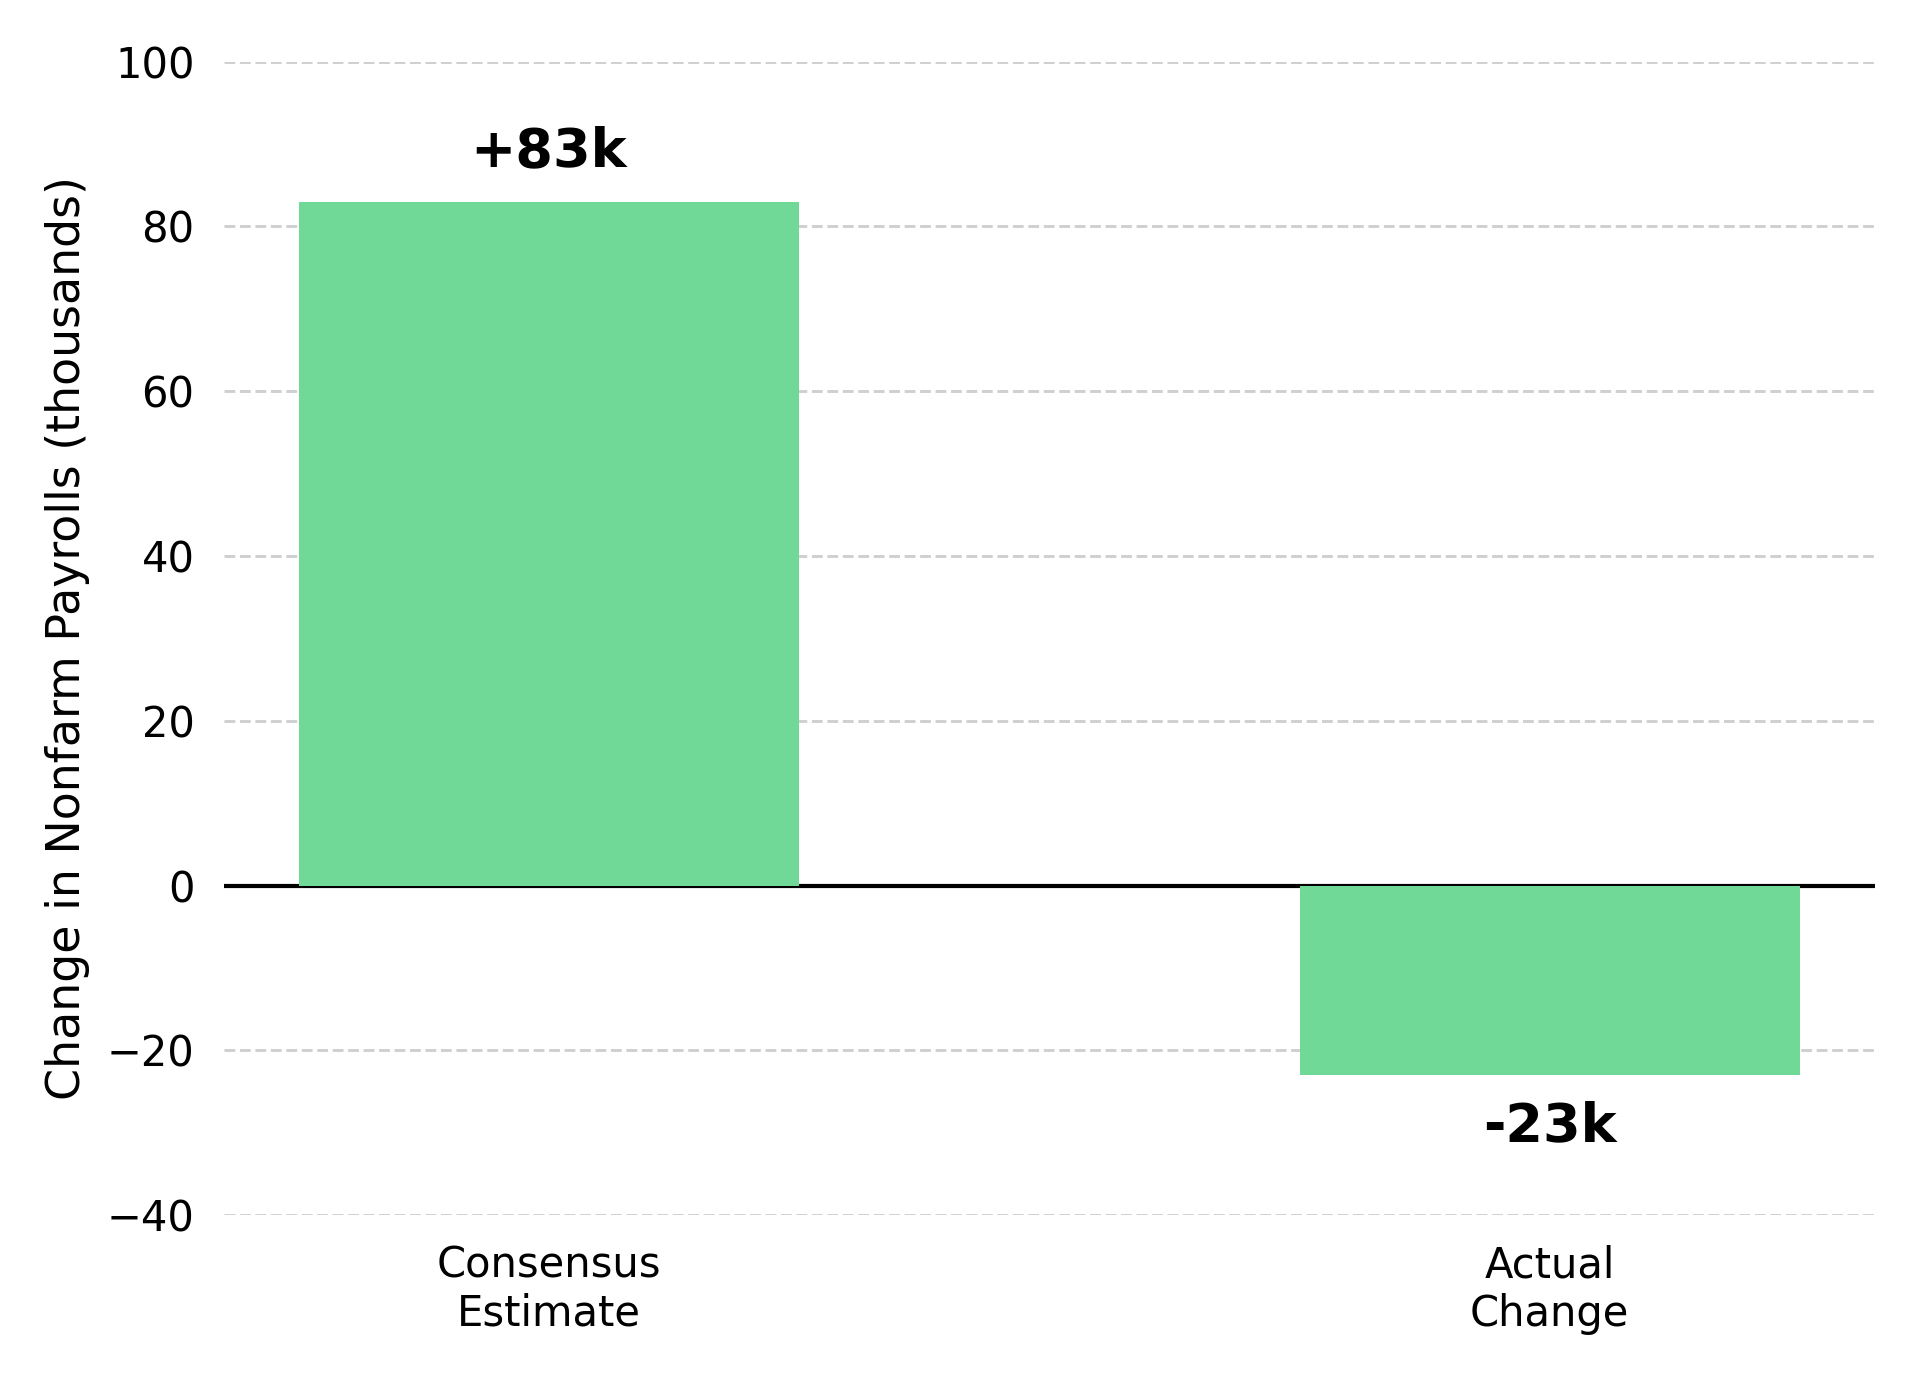
CME FedWatch subsequently showed the probability of a Fed hold on September 16 rising from roughly 33% to 60%, reducing the market-implied probability of another rate increase and the associated pressure on non-yielding gold.
Fed Rate Uncertainty Moves Gold & Leaves Mine Economics Unchanged
At its July 2026 meeting, the Fed held the federal funds target range at 3.5% to 3.75% for a fifth consecutive meeting, with three of twelve voting members favoring a 25-basis-point increase. The August 12 CPI release will test those September rate expectations, with inflation above consensus likely to raise hike probabilities and the opportunity cost of holding non-yielding gold, while a below-consensus reading would reduce both. Those rate expectations can move gold prices, but they do not directly change a producer’s grade, recovery rate or operating costs.
Central Banks Buy the Gold Decline & Producer Margins Face the Test
Central bank net purchases reached 288.9 tonnes in the second quarter of 2026, up 62% from 177.9 tonnes a year earlier and the highest second-quarter total in the WGC data series, even as gold posted its steepest quarterly decline since 2013. The People's Bank of China extended its gold-buying streak to 21 consecutive months in July 2026, according to Bloomberg's August 7 report, showing that Chinese official-sector demand continued beyond the second-quarter price decline.
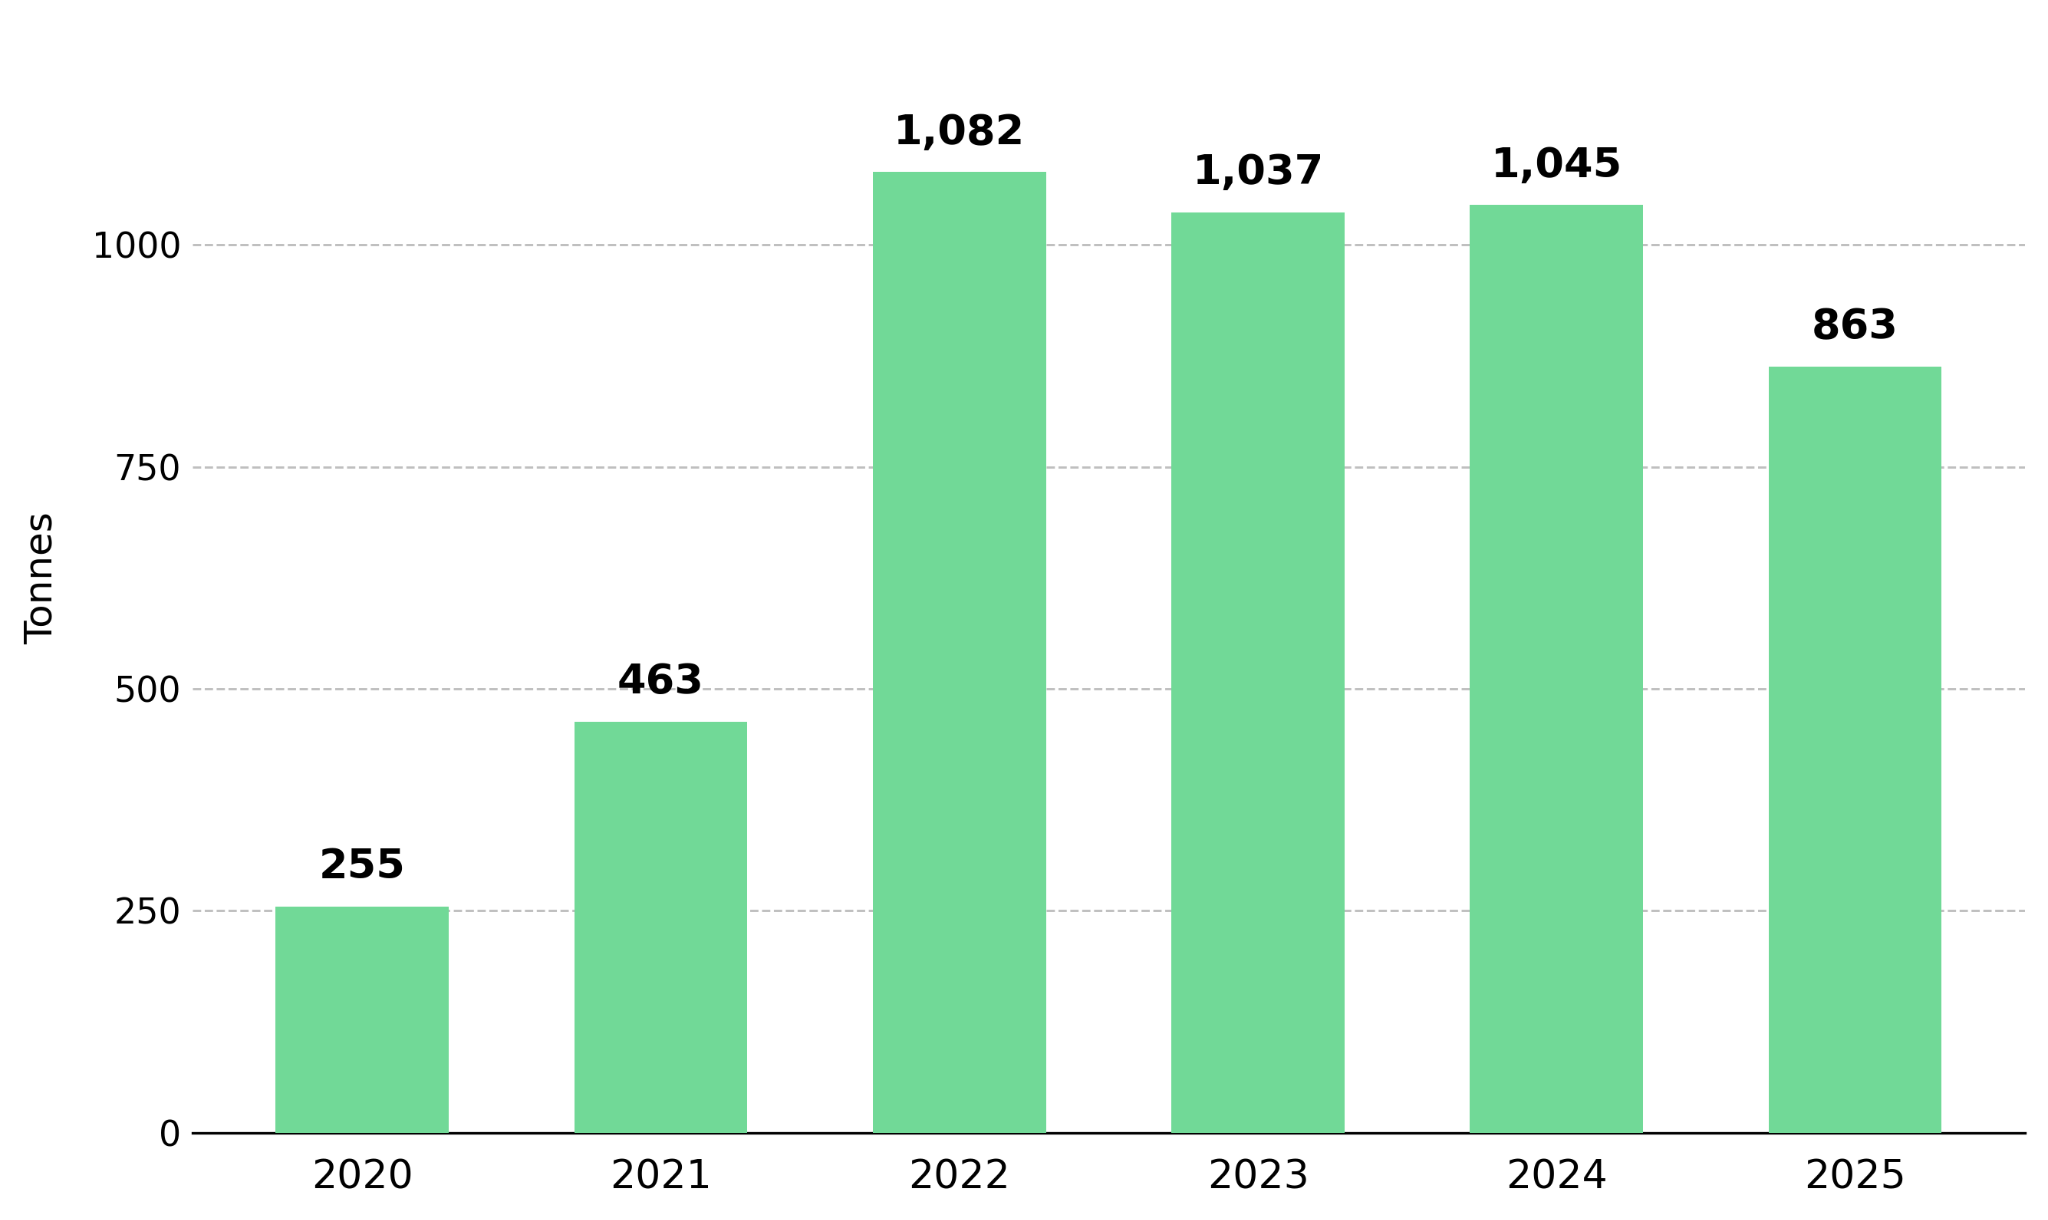
Central bank demand does not determine how a lower gold price translates into producer cash flow, which instead depends on mine-level costs, grade, recovery rates and balance-sheet strength. The five producers below show how reserve growth, higher grades, lower debt, processing improvements and lower mine costs can support margins without requiring a higher gold price.
Gold's Price Decline Tests How Producer Economics Hold
Reserve growth, higher grades, debt reduction, processing recovery and lower mine costs can improve producer economics without requiring a higher gold price, although the resulting cash flow remains sensitive to realized prices.
74% Reserve Growth Extends Mine Life & Cash Flow Reduces Funding Needs
Integra Resources' June 2026 Florida Canyon feasibility study reported a 74% increase in proven and probable reserves to 1.19 million ounces, supporting an eight-year mine life at a life-of-mine AISC of $2,331/oz. Integra's 2026 AISC guidance of $3,300 to $3,500/oz remains above the feasibility study's life-of-mine estimate, with diesel and explosives among the price-sensitive inputs that can raise unit costs and compress margins.
President and Chief Executive Officer George Salamis explains how that reserve growth gets funded:
"Our mission is to generate as much cash flow as we can, as large a treasury as we can. When we get to the Delamar build finish line, hopefully more than half of the build cost for Delamar will be in our treasury, which leads to the rest to be raised through some form of debt. We're trying to do this in as non-dilutive a manner as possible."
Higher Grade & 95% Recovery Support Margins Below the Prior Operator's Threshold
West Red Lake Gold Mines increased mined grade at its Madsen mine 23% quarter over quarter to 4.3 g/t gold in the second quarter of 2026, while mill recovery reached 95.0%, increasing recoverable gold per tonne processed and supporting stronger operating margins.
President and Chief Executive Officer Shane Williams ties that margin directly to the gold price the prior operator needed and the one the company needs today:
"Pure Gold needed to mine six or seven grams; we needed to mine four grams to make the same margin. The previous operators Pure Gold, was mining for 2,500 to 3,000 dollars an ounce, but unfortunately gold was at 1,500 dollars an ounce at the time. When you look at it today, even mining at that rate, we're still making a good margin."
Debt Reduction & Secured Funding Limit Near-Term Financing Risk
Serabi Gold repaid its outstanding bank debt in the first quarter of 2026 and ended June with $65.7 million in cash and no debt, removing interest and principal repayment obligations that could otherwise pressure liquidity during a gold-price decline. i-80 Gold is refurbishing its Lone Tree processing facility to target approximately 92% recovery for refractory ore, compared with 55% to 60% payability under third-party toll milling. The $430 million refurbishment forms part of a development plan backed by a $1 billion recapitalization completed in the first quarter of 2026, after which i-80 Gold reported $513.5 million in cash.
Processing Fix Cuts Mine Costs & Strengthens Gold Margins
Mineros S.A. reduced cash costs at its Pioneer and Panama mines in Nicaragua from approximately $3,000/oz to $1,200/oz by removing a processing bottleneck, widening mine-level margins at a given gold price. Mineros separately adopted a treasury policy that allows a portion of mined gold to be retained as bullion, increasing direct gold-price exposure on its balance sheet.
Gold Price Volatility Tests Costs & Balance-Sheet Strength Protects Cash Flow
Gold posted its steepest quarterly decline since 2013 as central bank net purchases reached a record 288.9 tonnes, while the featured producers improved reserves, grades, costs, processing economics or balance-sheet strength without requiring a higher gold price. Record central bank purchases show that official-sector demand continued through the decline, while mine costs, grade, recovery and balance-sheet obligations determine how much of a lower realized gold price reaches producer cash flow.
The August 12 CPI release and the Fed's September decision can shift rate expectations and gold's near-term price range through changes in the opportunity cost of holding a non-yielding asset. Neither directly changes a mine's grade, recovery rate or debt obligations. Rate expectations influence the gold price producers realize, while grade, recovery, unit costs and debt obligations determine how much of that revenue converts into cash flow.
The Investment Thesis for Gold
- Gold's steepest quarterly decline since 2013 makes grade, recovery, unit costs and balance-sheet strength more useful measures of operating quality because margin performance cannot be attributed to a rising gold price.
- Reserve growth can extend mine life, while higher grades increase contained gold per tonne, improving mine economics without requiring a higher gold price.
- Debt-free balance sheets and fully funded development plans reduce reliance on external capital, limiting exposure to borrowing costs and equity dilution while the Fed rate path remains uncertain.
- Processing upgrades that increase gold recovery can improve unit economics by generating more saleable gold from the same contained metal without requiring a higher gold price.
- Treasury policies that retain a portion of mined output as physical bullion rather than converting all production to cash extend the same price insensitive holding behavior seen at the central bank level into the corporate balance sheet.
- The thesis weakens if lower gold prices drive widespread AISC increases or force producers to use cash or equity to fund operations.
Gold posted its steepest quarterly decline since 2013 in the second quarter of 2026, while central bank net purchases reached a record 288.9 tonnes. Across the five featured producers, reserve growth, higher grades, lower costs, improved recovery and lower debt strengthened mine economics or balance sheets without requiring a higher gold price. Those company-level metrics determine how changes in realized gold prices translate into producer cash flow.
TL;DR
Gold recorded its steepest quarterly decline since 2013 in Q2 2026, yet central bank net purchases reached a record 288.9 tonnes as official-sector demand remained strong. Fed rate uncertainty continues to influence gold’s near-term price outlook, but producer economics depend on mine-level factors that monetary policy does not directly change. Across the five featured producers, reserve growth, higher grades, improved recovery, lower costs, reduced debt and secured development funding strengthened mine economics or balance sheets without requiring a higher gold price. The key measures to track are grade, recovery, AISC, liquidity and debt, which determine how changes in realized gold prices translate into producer cash flow.
FAQs (AI-Generated)
Analyst's Notes





Subscribe to Our Channel










Stay Informed