Undervalued? Is Revival Gold The Most Undervalued Gold Developer in the Market?


Revival Gold trades at 0.12x NAV with $1.2B of gold assets behind a $155M market cap. Is this the most undervalued gold developer in 2026?
- Revival Gold is advancing two multi-million-ounce brownfield gold projects in the western United States - Mercur in Utah (PEA-stage) and Beartrack-Arnett in Idaho (PFS-stage) - with a combined 6 million ounces of resource and initial target production exceeding 160,000 ounces per year.
- The company trades at just 0.12x price-to-NAV versus a developer peer average of 0.55x, representing one of the widest valuation discounts in the gold sector with $1.2 billion of after-tax net asset value sitting behind a $155 million market capitalisation.
- A brownfield strategy focused on past-producing mines delivers structural cost advantages: less than $10/oz finding cost, $208 million capex at Mercur ($220/oz of production versus $272/oz for peers), and AISC of $1,385/oz versus the peer average of $1,574/oz.
- Multiple near-term catalysts include high-grade drilling at the Joss target at Beartrack-Arnett, fast-track permitting at Mercur, and a PFS advancement that could move the company toward a production decision within two years.
- 54% institutional and corporate ownership, including EMR Capital and Dundee Corporation, provides financial backing, credibility, and alignment with shareholders as Revival Gold pursues a path to free cash flow generation.
The Gold Discovery Deficit Is Revival Gold’s Opportunity
The gold mining industry faces a structural problem that most investors overlook: the world is producing gold far faster than it is finding it. Global production runs at approximately 120 million ounces annually, while discovery has collapsed to roughly 20 million ounces per year. Over the last couple of years, there have been no new major discoveries of gold. All of this against a backdrop of a gold price that has surged past $2,900/oz and shows no signs of retreating. President & CEO, Hugh Agro stated:
“Gold mines are hard to find, challenging to make, and they tend to endure. Such businesses are hard to replicate, and very valuable.”
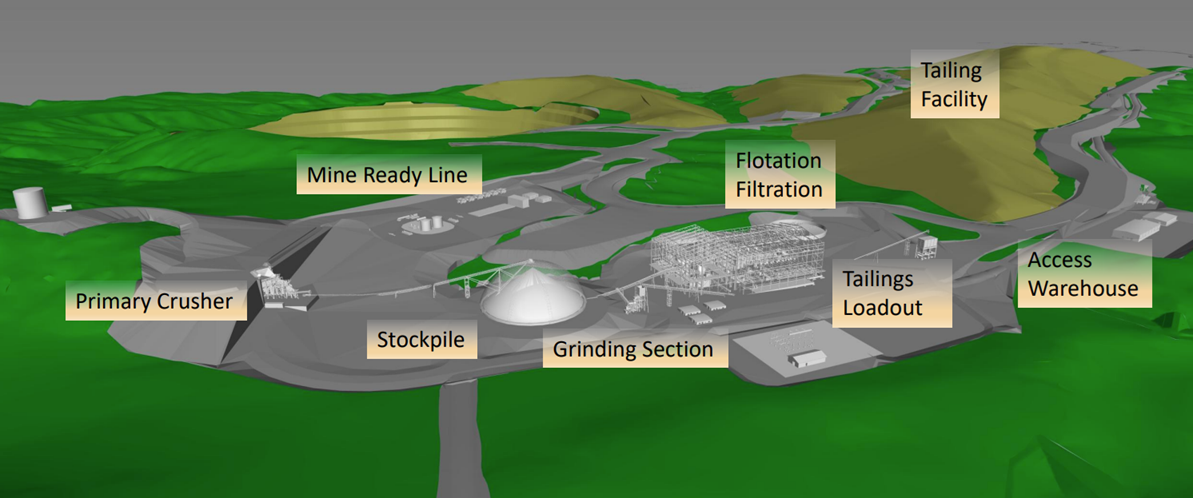
Revival Gold was established in 2017 by industry veterans to exploit precisely this gap. Rather than chasing greenfield exploration in remote jurisdictions, the company takes a differentiated approach: acquiring and redeveloping brownfield gold assets - sites where gold has been successfully produced before. The logic is compelling. These projects come with proven geology, existing infrastructure, historical production data, and established community relationships. The risk profile is fundamentally different from a traditional exploration play.
Undervalued? Presentation with President & CEO, Hugh Agro
Brownfield Strategy: Lower Risk by Design
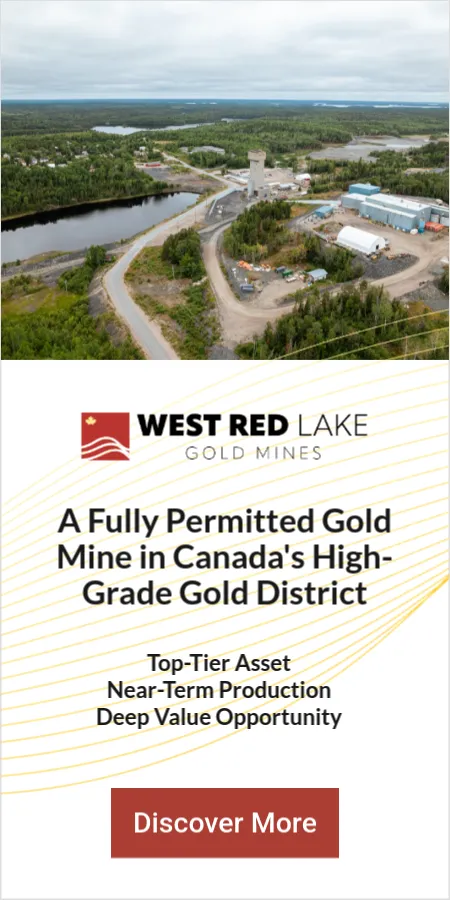
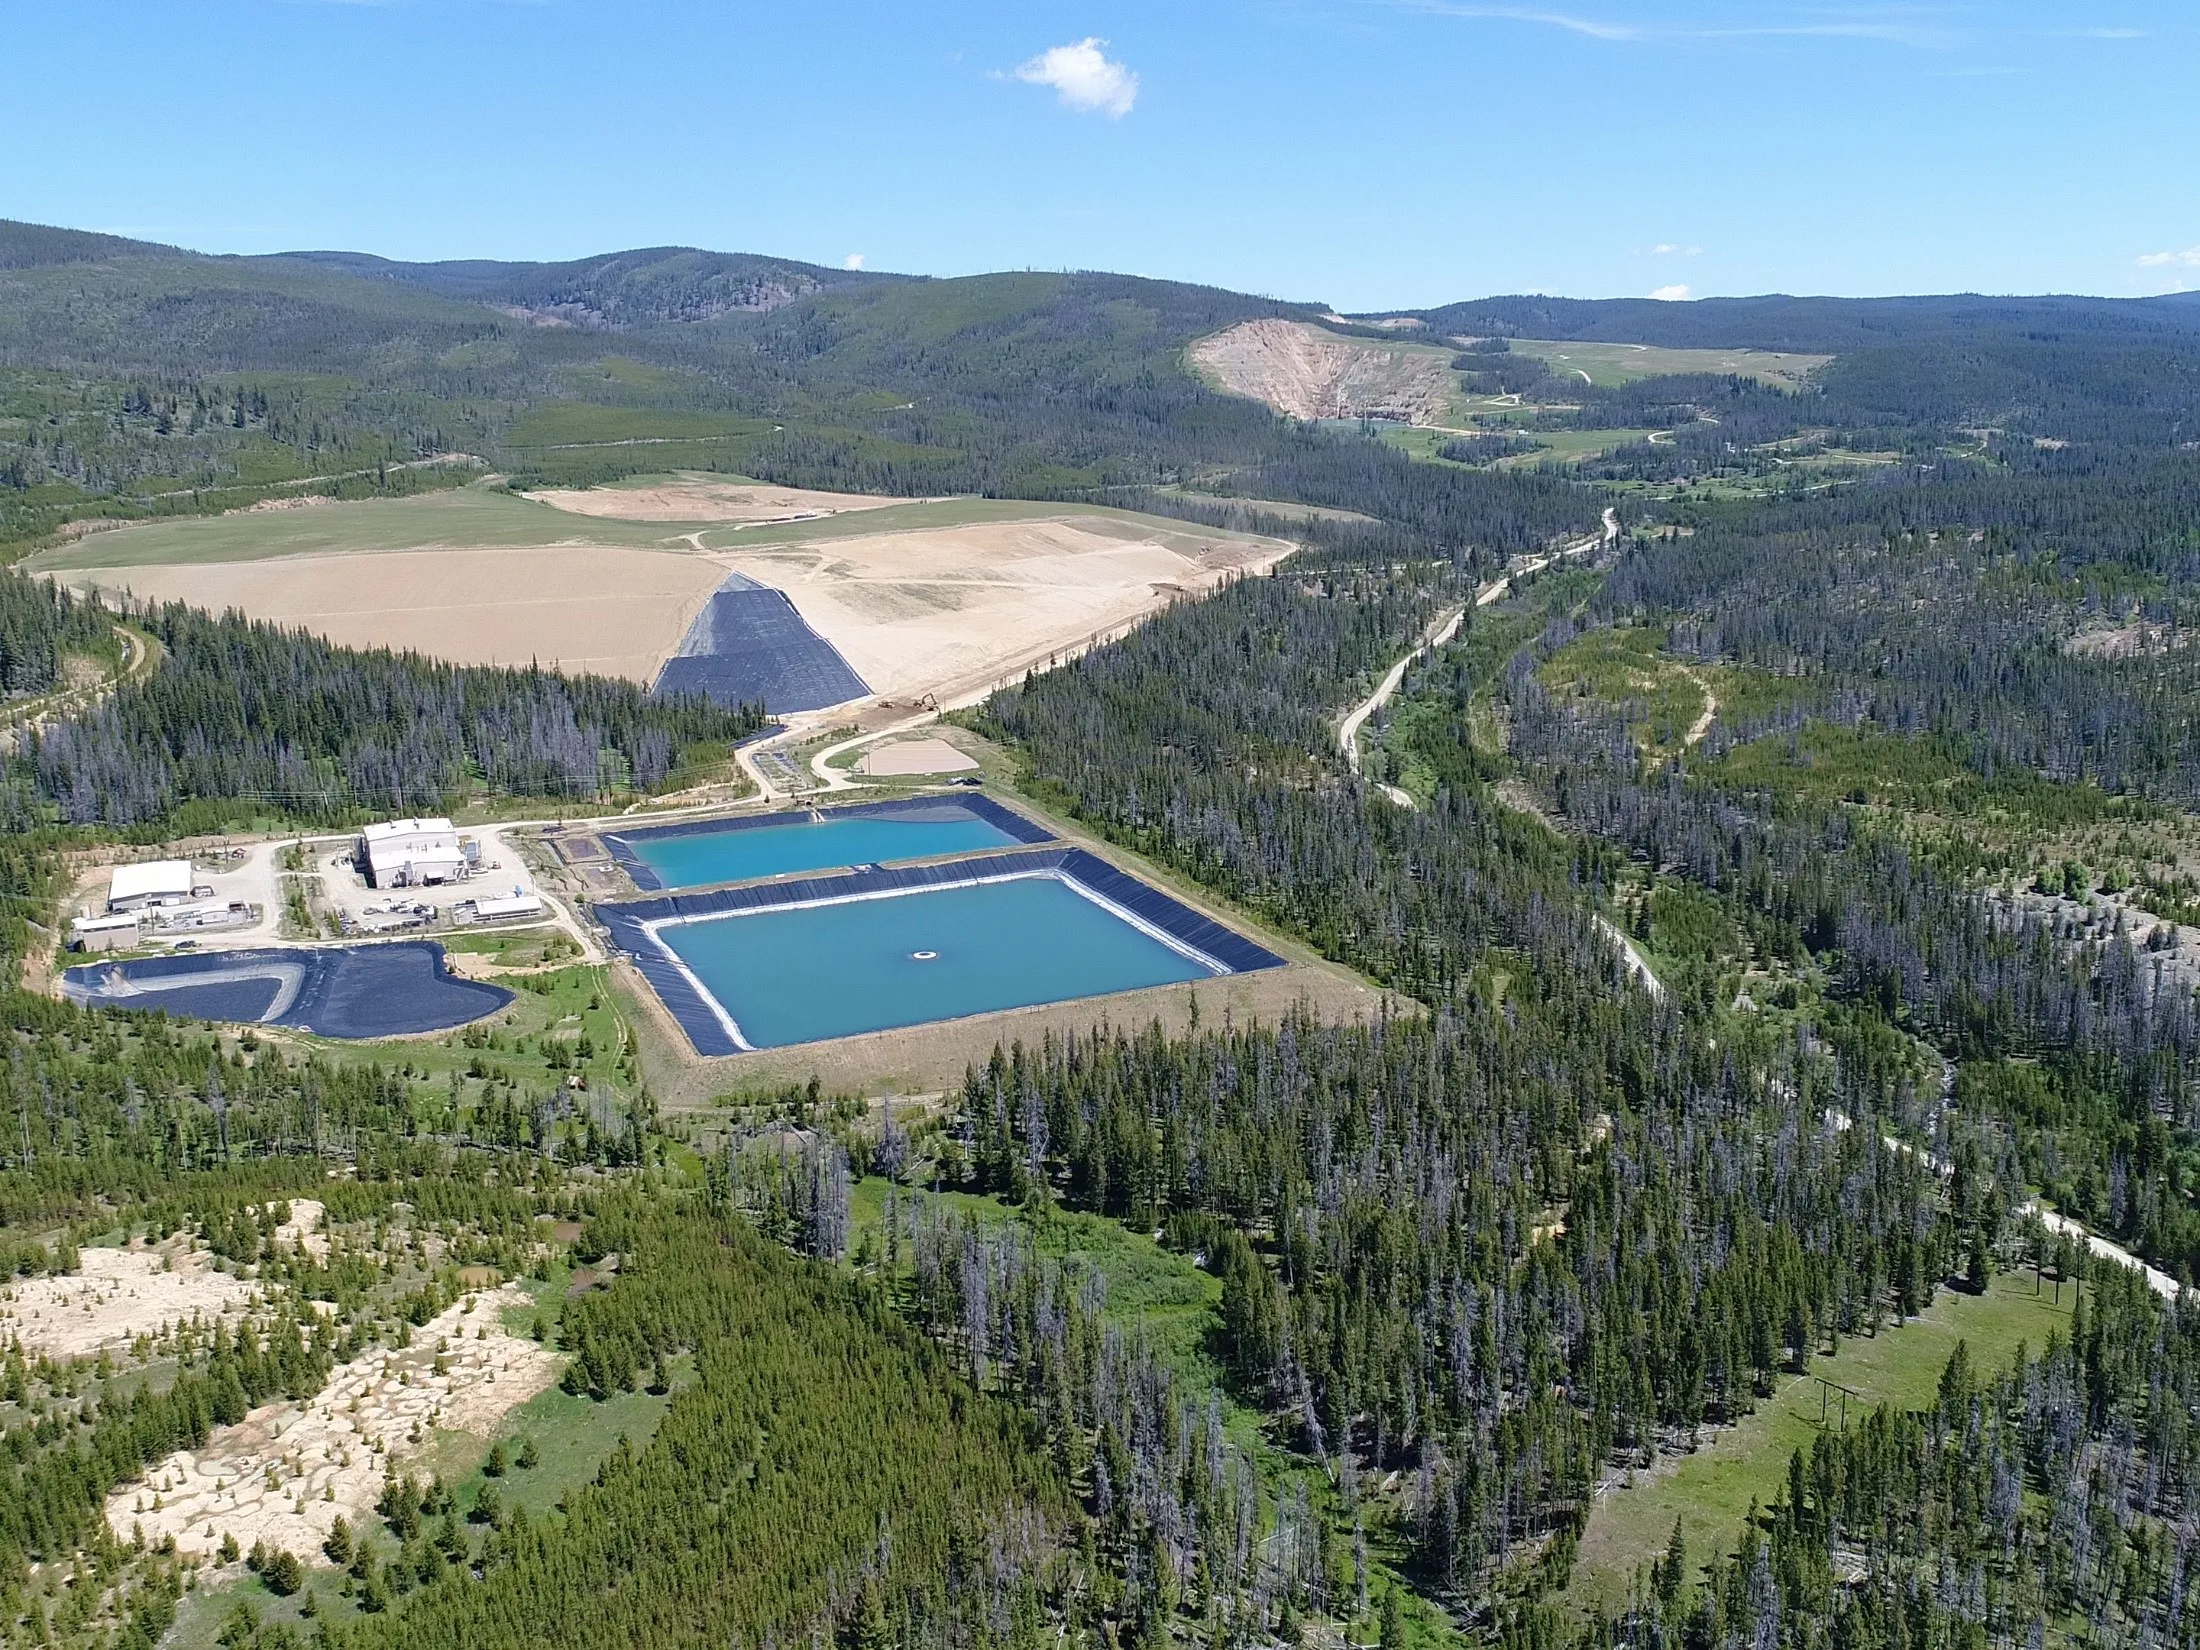
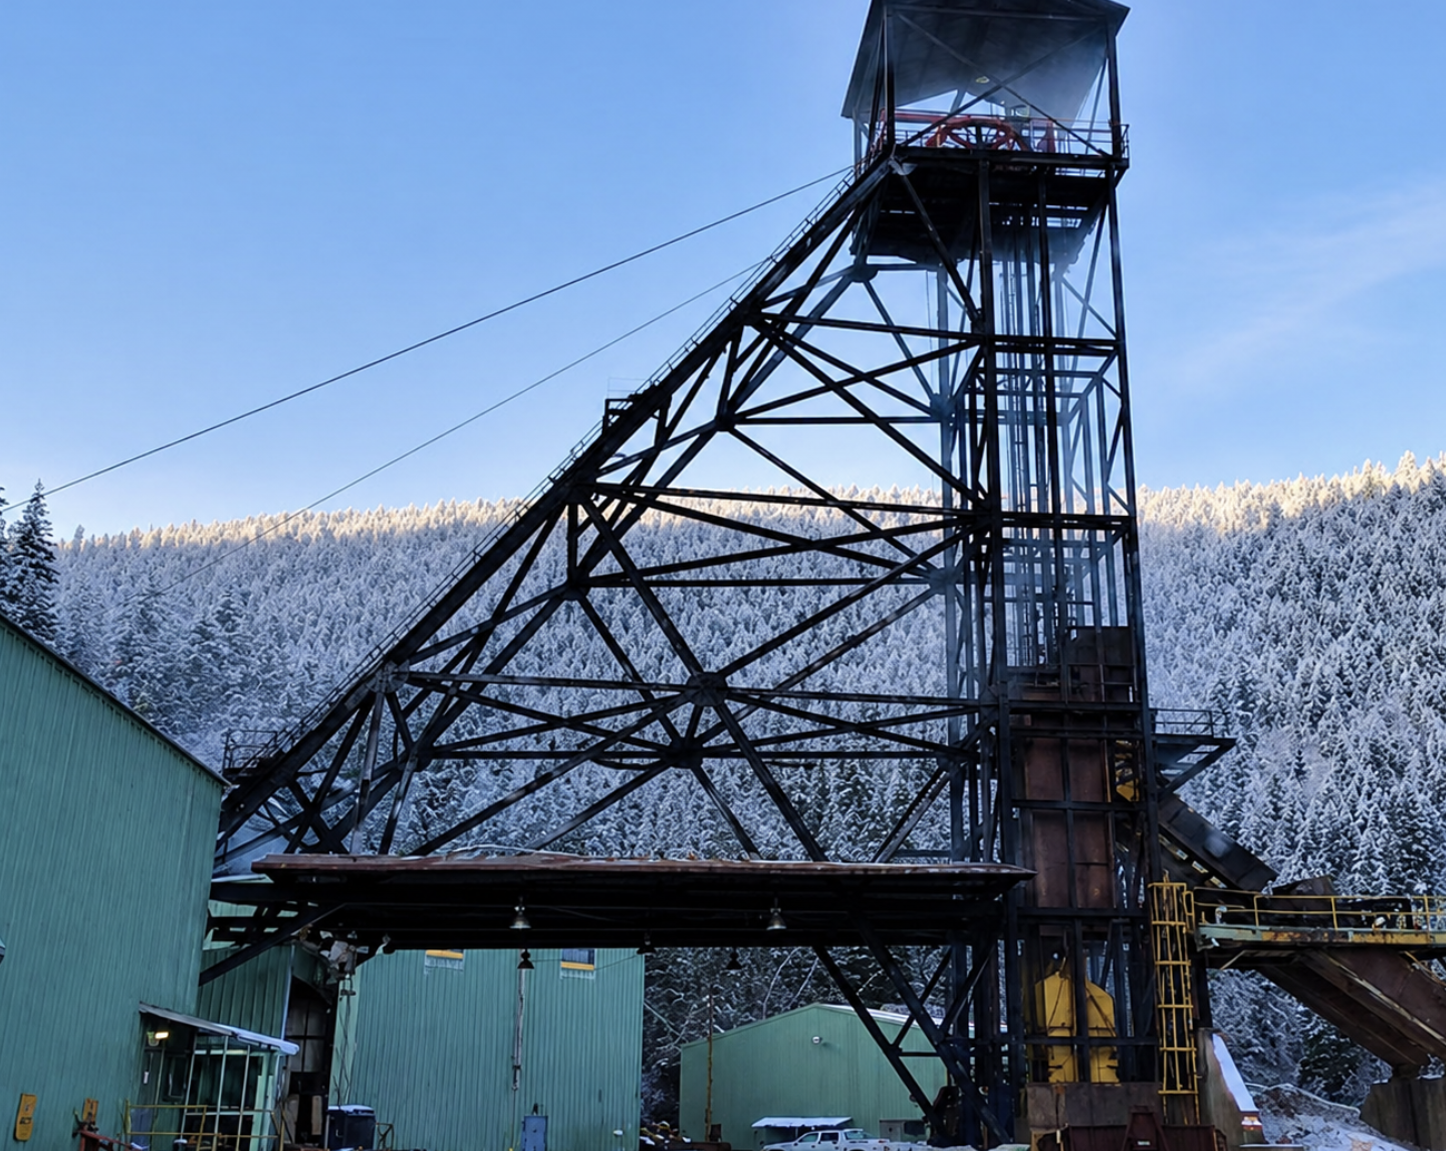
Revival Gold’s two cornerstone assets sit in the western United States, a Tier 1 mining jurisdiction that offers stable permitting frameworks, rule of law, and strong infrastructure connectivity.
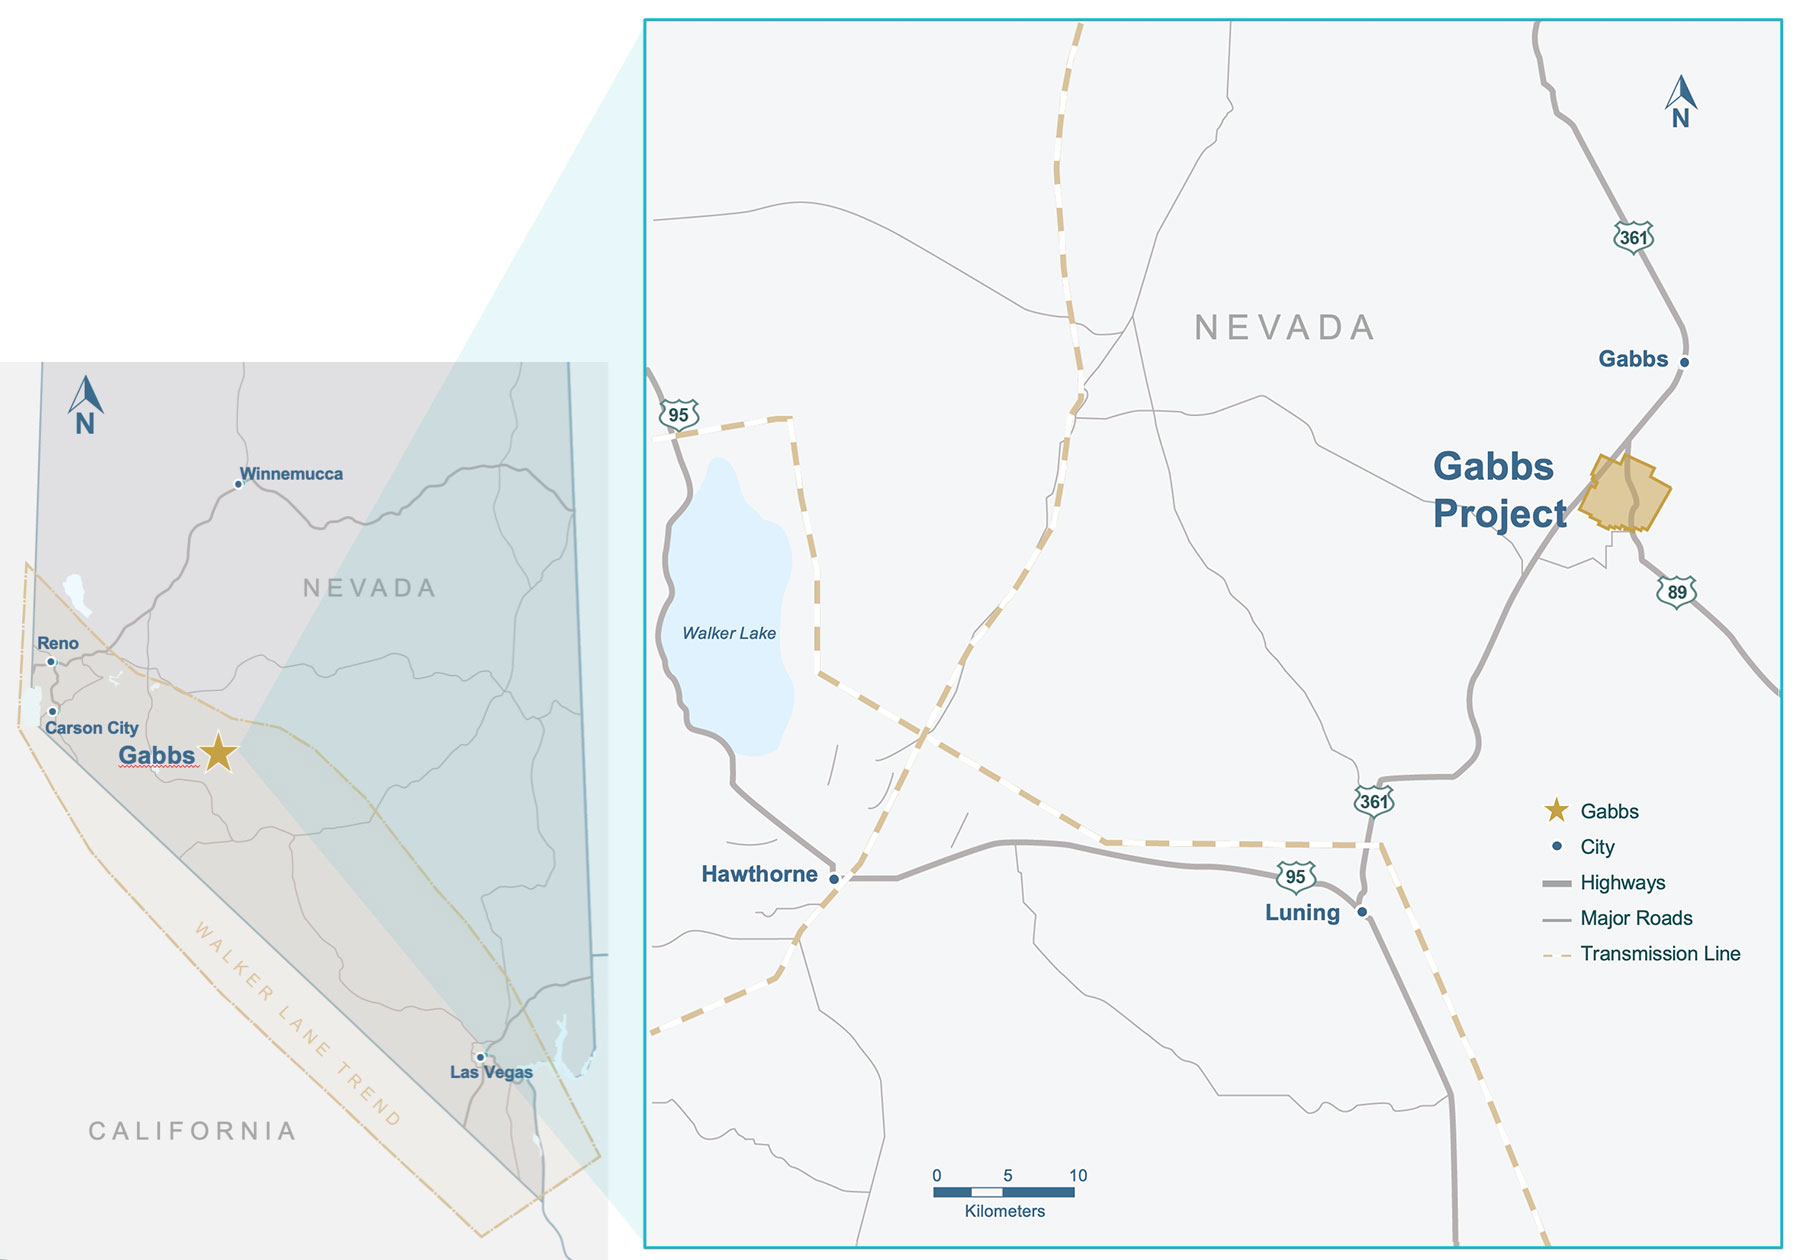
Mercur Gold Project, Utah
A PEA-stage heap leach gold project with a production decision targeted within two years. The 2025 PEA outlines a $208 million initial capex, which translates to just $220/oz of production, which is materially below the peer average of $272/oz. AISC of $1,385/oz also compares favourably against $1,574/oz for peers. This is not a speculative exploration play; it is a defined project with economics that work at current gold prices.
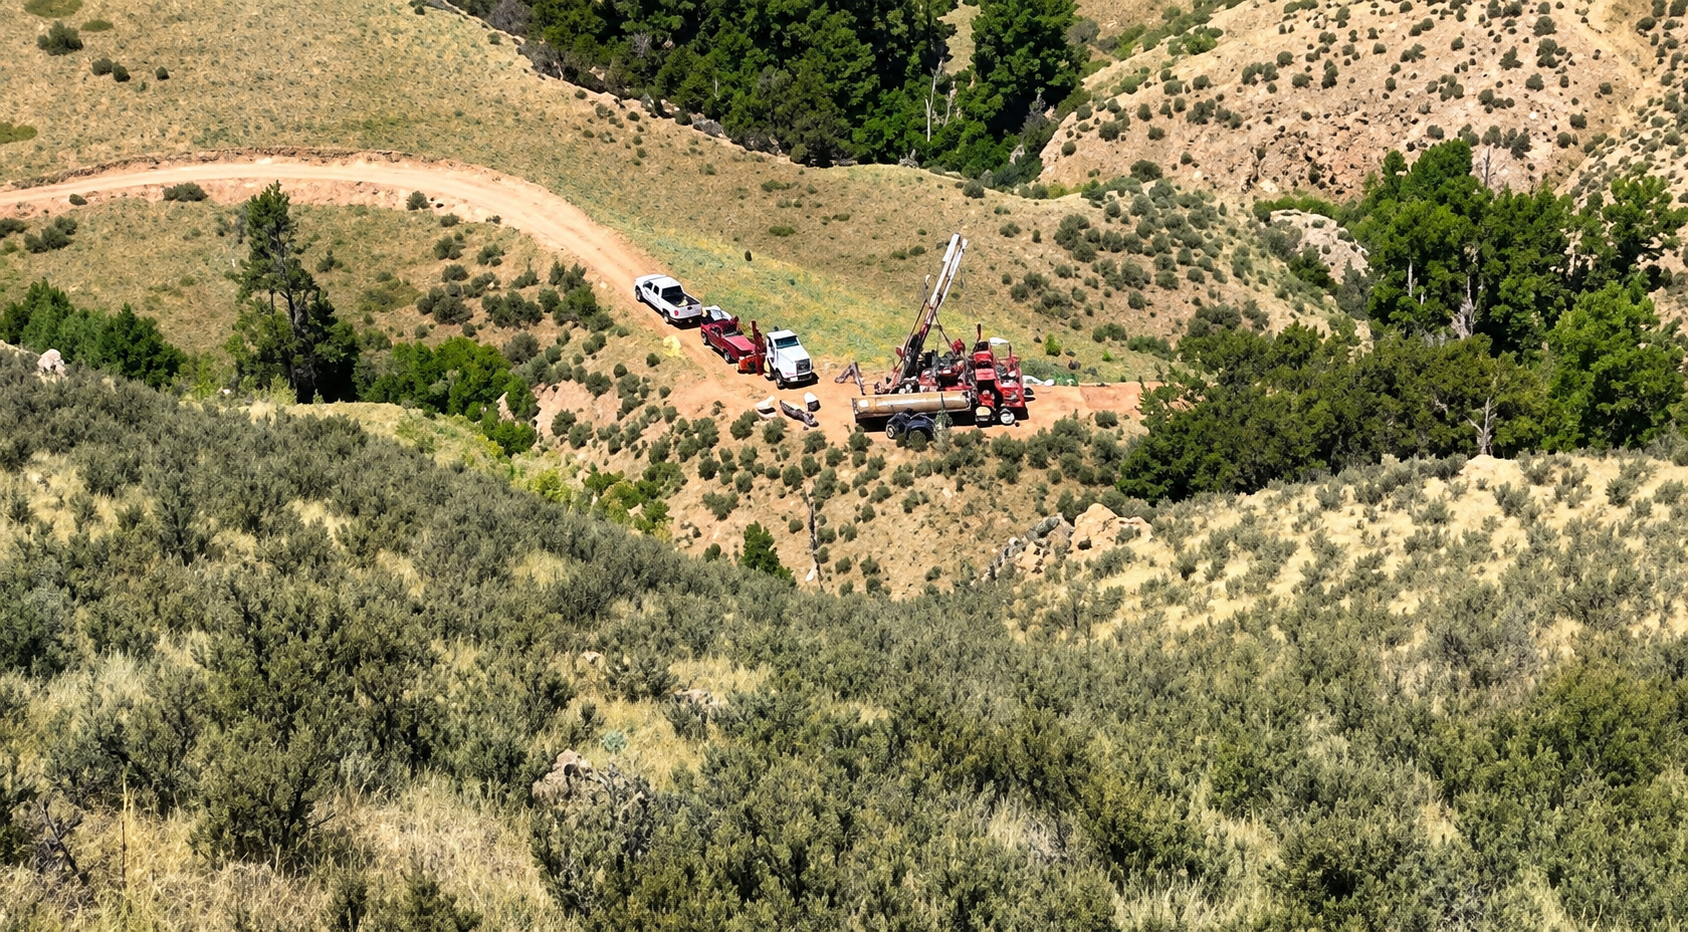
Beartrack-Arnett Gold Project, Idaho
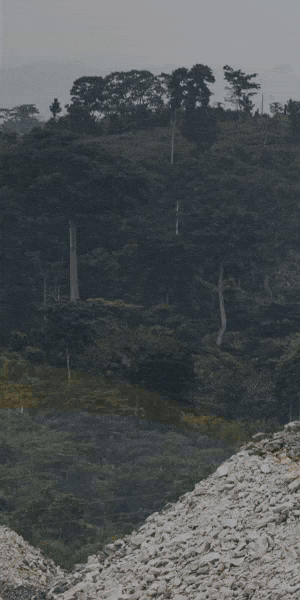
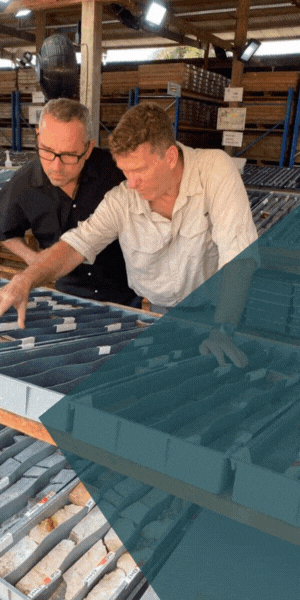
A PFS-stage heap leach project hosting a 4.6 million ounce gold deposit with initial production of 160,000 ounces from open pit phases. Two drill rigs are currently testing the high-grade underground Joss target, which represents meaningful exploration upside beyond the existing resource base. The 2023 PFS was prepared at a price of $1,900/oz gold; at today’s prices, the economics have improved dramatically.
Combined, the two projects provide 6 million ounces of resource, over $200 million of legacy infrastructure, and a finding cost to date of less than $10 per ounce of gold in the ground. Agro noted:
“We are lower risk by design. We’re redeveloping past producing gold mines in the United States which gives us advantages in terms of infrastructure - $200 million worth of infrastructure and data at our fingertips.”
CEO Agro points to precedent: Goldstrike, Haile, Malartic, Detour, and Skeena are all examples of past-producing gold assets that were cast off by majors, redeveloped by junior companies, and ultimately became very valuable mines. Revival Gold is attempting to replicate this well-worn playbook across two simultaneously advancing projects.
The Valuation Disconnect: 0.12x P/NAV in a $5,000 Gold World
This is where the investment case becomes most compelling. The gold developer space as a whole trades at approximately 0.55x underlying net asset value, according to BMO Capital Markets data as of January 2026. Producer peers, by contrast, trade at 1.0x to 1.5x NAV. Revival Gold trades at just 0.12x P/NAV, a fraction of even the discounted developer average.
To contextualise what this means: the company’s combined after-tax NAV at a 5% discount rate and $3,000/oz gold is $1.225 billion. At $4,000/oz gold, that figure rises to $2.064 billion. The current market capitalisation is approximately $155 million, with $13 million of cash on hand and no long-term debt. Agro stated:
“What’s under the hood? $1.2 billion of net asset value, which reflects less than half the company’s current resources. And that $1.2 billion of NAV increases to $2 billion of NAV at $4,000 gold. So, lots of leverage for investors as the gold price continues to grow.”
On a market cap per resource ounce basis, Revival Gold trades at approximately $25/oz versus $100/oz for US developer peers. Large, mid, and small producers trade at $300-$400/oz. Even applying a generous risk discount for the development stage, the current valuation implies the market is ascribing minimal value to the combined project portfolio.
This is not unusual for the gold developer space in aggregate; developers have historically traded at steep discounts to producers. But Revival Gold’s discount is extreme even within its own peer group, and the question investors must answer is whether the gap reflects genuine risk or merely market inefficiency.
Catalysts That Could Close the Valuation Gap
Revival Gold has multiple de-risking milestones on its near-term horizon, each of which has the potential to drive a re-rating toward developer peer multiples.
- High-grade drilling at Joss (Beartrack-Arnett): Two rigs are actively drilling a high-grade underground target that could materially expand the 4.6 million ounce resource. Positive results here could redefine the project’s scale and economics, particularly the optionality for underground mining at higher grades.
- Mercur PFS and production decision: The company is advancing Mercur from PEA toward PFS, with a production decision targeted within two years. Each step along this de-risking pathway (PFS completion, permitting advancement, financing) represents a potential inflection point for the share price.
- Fast-track permitting at Mercur: Utah offers a favourable permitting environment for mining projects, and the brownfield nature of the Mercur site, with existing infrastructure and historical operations, should support an expedited permitting timeline relative to greenfield alternatives.
- Gold price tailwind: Revival Gold is a pure-play gold company with 100% gold exposure and 22 ounces of gold in situ for every 1,000 shares held. In a rising gold price environment, the leverage embedded in the company’s NAV sensitivity is substantial: from $521 million at $2,175/oz to $1.225 billion at $3,000/oz to $2.064 billion at $4,000/oz.
“For investors that have watched the gold price take off over the last couple of years and senior gold equity share prices increase along with it, I’ve got good news. There’s still exceptional value in the developer space.”
Key Risks to Consider
No investment case is complete without an honest assessment of risk. Revival Gold is a pre-revenue development company, and investors should weigh the following considerations. The company faces the standard risks associated with mine development: permitting delays, cost escalation between PEA/PFS and feasibility, metallurgical performance uncertainty, and gold price volatility. The $208 million capex at Mercur will need to be financed, and while the brownfield cost advantage reduces the quantum, the company’s current $13 million cash position means external capital will be required. The Beartrack-Arnett PFS was completed using a $1,900/oz gold price, and while current gold prices are materially higher, investors should recognise that study-level economics may shift as the project advances through updated technical work. Additionally, as a TSX-V listed developer with a $155 million market cap, Revival Gold carries the liquidity risk inherent to small-cap mining equities.
Investment Thesis: Revival Gold
- Extreme valuation discount: At 0.12x P/NAV, Revival Gold trades at a fraction of the developer average (0.55x) and a fraction of producer multiples (1.0–1.5x). On a per-ounce basis, the market values the company’s 6 million ounce resource at just $25/oz versus $100/oz for US developer peers.
- Brownfield cost advantage: Past-producing assets with $200 million of legacy infrastructure deliver structural advantages: sub-$10/oz finding cost, below-peer capex intensity ($220/oz versus $272/oz), and lower AISC ($1,385/oz versus $1,574/oz).
- Dual-asset diversification: Two independently advancing projects in Tier 1 US jurisdictions reduce single-asset concentration risk and provide multiple pathways to value realisation.
- Near-term catalyst density: High-grade drilling at Joss, Mercur PFS advancement, and fast-track permitting provide multiple inflection points over the coming 12–24 months.
- Gold price leverage: Combined NAV swings from $521 million at base-case gold to $2.064 billion at $4,000/oz, offering substantial torque to continued gold strength.
- Institutional validation: 54% corporate and institutional ownership including EMR Capital and Dundee Corporation provides capital access and alignment.
TL;DR
Revival Gold owns 6 million ounces of gold across two brownfield projects in the US, has $1.2 billion of combined NAV at $3,000/oz gold, and trades at just $155 million market cap (0.12x P/NAV). With a production decision at Mercur targeted within two years, high-grade drilling underway at Beartrack-Arnett, and 54% institutional ownership backing the strategy, the valuation gap to peers is one of the widest in the gold developer space. Whether that gap closes depends on execution, but at current prices, investors are paying almost nothing for a substantial portfolio of advanced gold assets in a Tier 1 jurisdiction.
FAQ's (AI-Generated)
The company is targeting a production decision within two years, contingent on completion of the PFS, permitting advancement, and project financing. The 2025 PEA provides the technical foundation, and management has indicated fast-track permitting is underway in Utah’s supportive regulatory environment.
The company’s combined after-tax NAV at a 5% discount rate is $521 million at $1,900/oz gold (the PFS base case), $1.225 billion at $3,000/oz, and $2.064 billion at $4,000/oz. With gold currently trading around the $5,000/oz mark, the relevant NAV is approximately $1.2 billion against a $155 million market capitalisation.
Joss is a high-grade underground gold target within the Beartrack-Arnett project in Idaho. Two drill rigs are currently active on the target, testing for resource expansion beyond the existing 4.6 million ounce deposit. Positive results could add higher-grade underground ounces that would improve the project’s overall economics and support a potential underground mining phase targeting over 250,000 ounces per year of combined production.
Revival Gold currently holds $13 million in cash with no long-term debt. The $208 million capex will require external financing, likely through a combination of project-level debt, streaming/royalty arrangements, and potentially equity. The company’s 54% institutional ownership base — including mining-focused funds EMR Capital and Dundee Corporation — provides access to capital markets and strategic financing options.
Gold developers in general trade at steep discounts to producers, reflecting the inherent execution risk in bringing a mine to production. Revival Gold’s 0.12x P/NAV is extreme even relative to the 0.55x developer average, which likely reflects its small market cap ($155 million), pre-revenue status, and the financing required to reach production. As the company advances through de-risking milestones — PFS completion, permitting, drilling results — the market typically narrows this discount. The question for investors is whether the current price adequately compensates for the risks or whether it represents an inefficiency that will correct as catalysts materialise.
Analyst's Notes


Subscribe to Our Channel


%20(1).png)


Stay Informed