



Road Salt 2027 Outlook: Supply Security Sets Prices as Buyers Run Short


Failed state tenders and low stockpiles give US road salt suppliers pricing power, with 2026-27 quotes up to 72% higher. Delivery capacity now drives value.
- Revised federal data show US net import reliance for salt ranged from 23% to 37% between 2021 and 2025, wider than earlier estimates.
- Mine-gate values for rock salt fell about 10% from 2021 to 2025, while delivered highway salt prices rose through 2026.
- More than 250 Illinois communities and several Ohio counties received no bids for 2026-27 road salt through state purchasing programs.
- The United States applied a 50% duty to Canadian road salt from August 29 to September 15, 2026, before a presidential proclamation removed it.
- The National Oceanic and Atmospheric Administration expects a very strong El Niño to bring warmer-than-average temperatures across much of the northern United States in the coming winter.
Tight Supply Now Sets Road Salt Prices Ahead of Winter
North American road salt enters the 2026-27 winter with buyers competing for supply rather than suppliers competing for contracts. State purchasing pools in Illinois and Ohio received no bids for parts of their territory, and accepted prices rose by double digits in several states. One of the largest highway salt suppliers reported low inventories across the industry after a demanding 2025-26 winter.”
The change alters how salt exposure is valued. Revised federal data show the United States relies more on imported salt than earlier estimates suggested. Mine-gate rock salt prices have fallen since 2021, even as municipal prices have climbed. Value has moved away from tonnage at the mine and toward two things: the ability to deliver salt on time to snowbelt buyers, and the inventory to honor delivery guarantees in a severe winter.
The US Relies More on Imported Salt Than Earlier Data Showed
The US Geological Survey (USGS) released its Mineral Commodity Summaries 2026 in February. The release revised production, consumption, import and price data for 2021 to 2023 and added estimates for 2024 and 2025. The revised figures indicate a domestic supply base unable to respond to demand swings, with imports absorbing almost the entire adjustment.
Domestic Output Stays Flat While Demand Swings
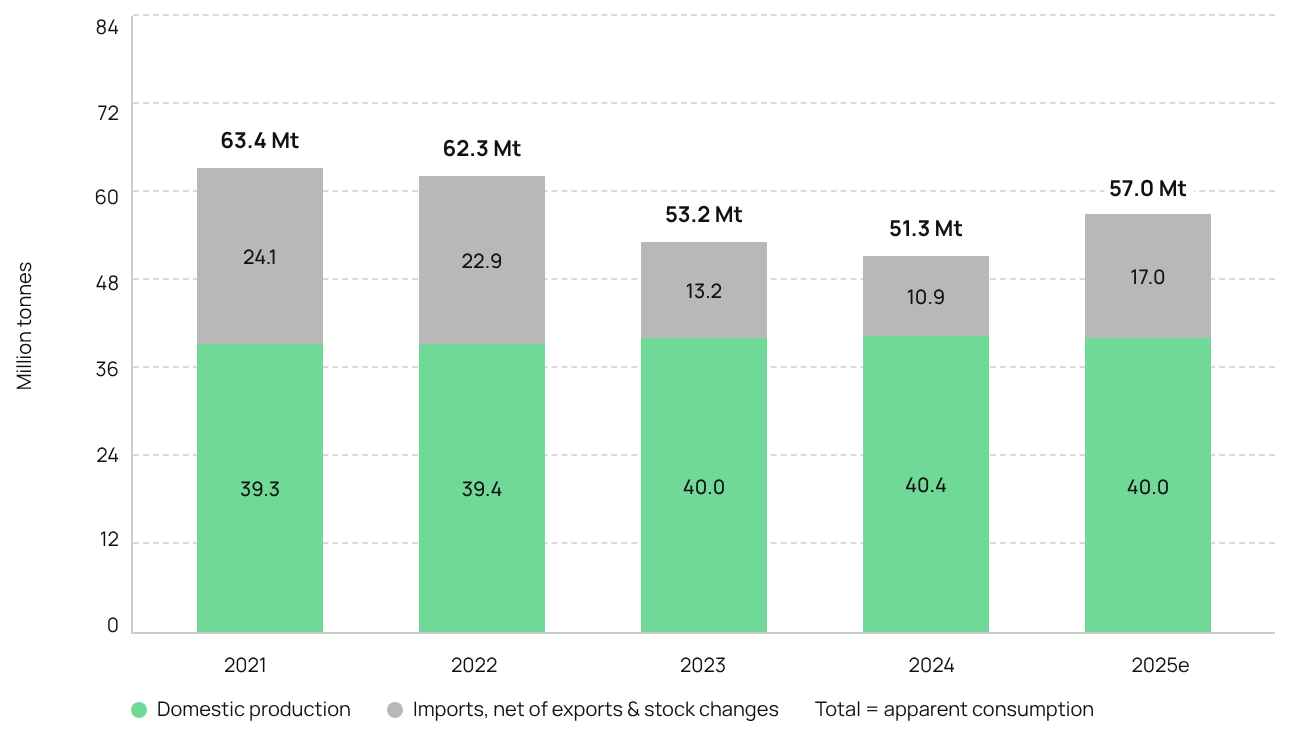
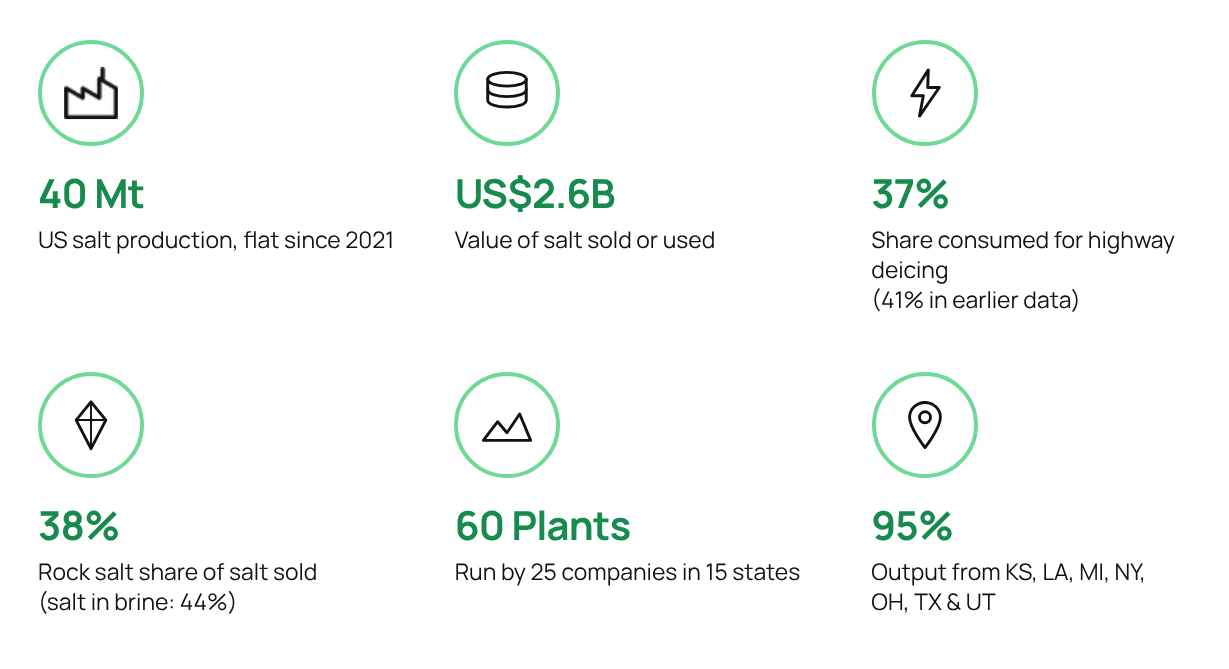
USGS estimates US salt production at about 40 million tonnes in 2025, and output has held between 39.3 and 40.4 million tonnes since 2021. Revised 2023 production stands at 40.0 million tonnes, below the 42 million tonnes in earlier USGS estimates. Twenty-five companies operated 60 plants in 15 states in 2025. Seven states produced about 95% of output: Kansas, Louisiana, Michigan, New York, Ohio, Texas and Utah.
Demand moved far more than supply. Apparent consumption fell from 63.4 million tonnes in 2021 to 51.3 million tonnes in 2024, then rose 11% to an estimated 57.0 million tonnes in 2025. Imports rose about 37% over the same year, from 13.9 to 19.0 million tonnes. USGS attributes much of the gain to transportation departments using more road salt than in 2024.
Annual domestic output varies little, even though operating rates at rock salt mines rise and fall with winter severity. Most additional demand in a severe season is met by imports and stock drawdowns rather than higher domestic output. US winter supply therefore depends on port capacity, freight markets and trade policy as much as on domestic mining.
Import Reliance Swings Between 23% and 37%
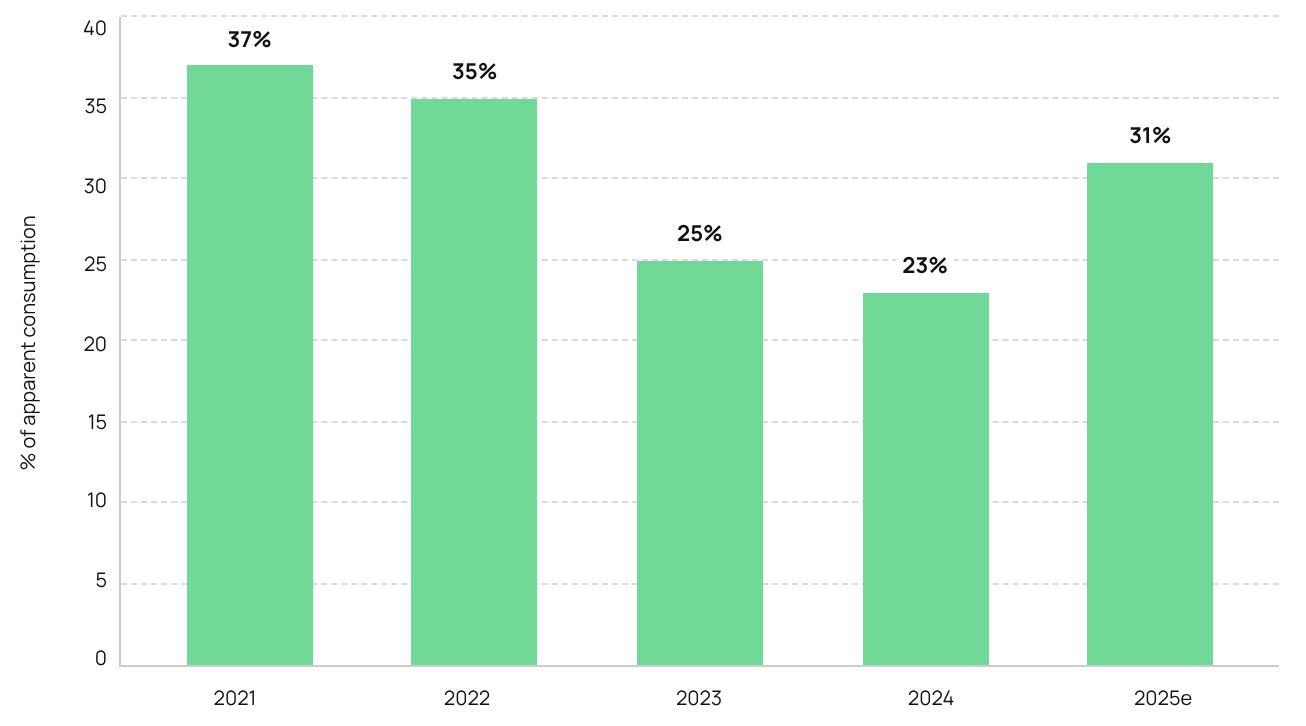
Revised USGS figures put net import reliance at 37% in 2021, 35% in 2022, 25% in 2023, 23% in 2024 and an estimated 31% in 2025. Earlier USGS editions put both 2021 and 2022 at 30%, for a range of 25% to 30%. The revised range is wider at both ends.
Import reliance tracks winter severity. It peaked in the 2021 and 2022 seasons, fell during the milder winters of 2023 and 2024, and rose again in 2025. A swing of 14 percentage points over five years represents several million tonnes of salt moving through ports, barges and rail terminals during seasons when weather demands it.
Supply risk in a severe winter is therefore larger than earlier data indicated. Capacity located close to snowbelt demand, whether domestic or across the Canadian border, carries more value than national production totals suggest.
Mexico Now Ships More Salt to the US Than Canada
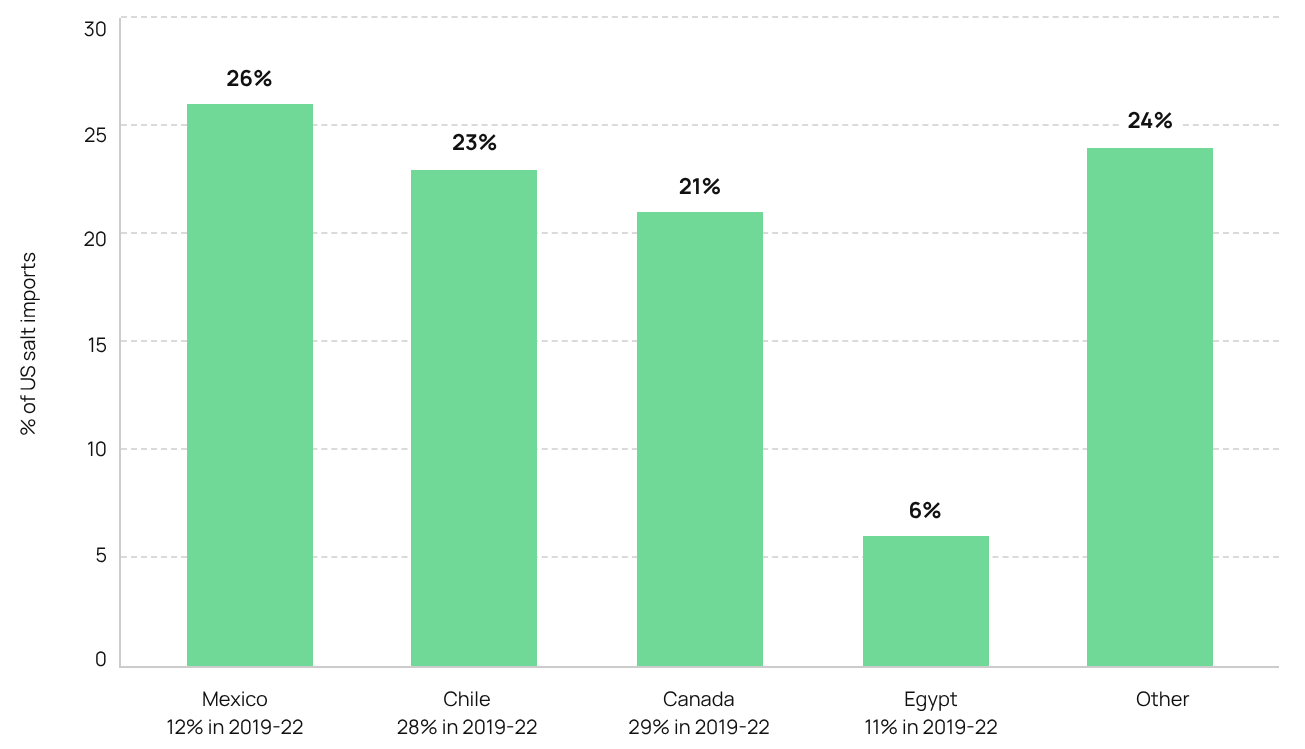
USGS lists 2021-24 import sources as Mexico 26%, Chile 23%, Canada 21%, Egypt 6% and other 24%. The 2019-22 window in earlier USGS data showed Canada at 29%, Chile at 28%, Mexico at 12%, and Egypt at 11%. Mexico's share has more than doubled, making it the largest single source.
Canada matters more than its share of volume suggests. Total imports across 2021-24 were about 76.7 million tonnes, so Canada's 21% equals roughly 16 million tonnes, or about 4 million tonnes a year. The United States imported US$159 million of Canadian salt in 2025, much of it for deicing. Canadian mines sit close to Great Lakes and Northeast markets, which shortens delivery during storms.
Imports from Mexico, Chile and Egypt account for most of the volume, while short-haul Canadian supply meets storm-driven demand at short notice. Short-haul Canadian supply covers storm-driven demand at short notice. Any disruption to cross-border trade is therefore a direct risk to winter road maintenance in the northern states.
Highway Deicing Uses a Smaller Share of US Salt
USGS now puts highway deicing at about 37% of total salt consumed, down from 41% in earlier USGS data. The chemical industry accounted for about 42% of salt sales, with brine-derived salt supplying about 90% of chemical feedstocks. By type, 2025 salt sold or used split into salt in brine 44%, rock salt 38%, solar salt 9% and vacuum pan salt 9%. The 2023 split had rock salt at 46% and brine at 33%.
Reported consumption was estimated at 43 million tonnes in 2025, and USGS now puts 2023 at 44.1 million tonnes, down from 48 million tonnes in earlier data. Applying the 37% share gives roughly 16 million tonnes of highway deicing salt. The total value of salt sold or used held near US$2.6 billion in 2025.
Road salt is a smaller, more concentrated segment of US salt than headline totals suggest, so a producer's revenue mix determines its risk profile. Rock salt mines tied to highway contracts carry weather risk. Brine operations serving chemical plants follow industrial demand.
Last Winter Left Snowbelt Stockpiles Low
The 2025-26 winter tested delivery capacity across the Great Lakes, New England and Ontario. Shortages in January and February forced rationing and pushed some buyers toward costlier materials. The season ended with public and private stockpiles drawn down ahead of the 2026-27 bid cycle.
Cities Rationed Salt as Deliveries Slipped
In January, Cleveland began salting main roads before residential streets after its supplier delayed deliveries of salt the city had ordered in August. Nearby North Royalton began rationing weeks earlier. It held about 400 tons in reserve, against use of up to 1,500 tons over three snowy days.
Michigan reported a statewide shortage that forced communities to limit salt use and left commercial snow removal companies with thin supplies. One contractor said the cost of a load of salt had doubled from US$200 to US$400. In Vermont's Upper Valley, towns relying on one main supplier reported a nationwide shortage, and one road commissioner said his town was essentially out of salt. Connecticut towns were conserving salt in early February, and Ontario reported a shortage driven by high demand.
The shortages hit several states in the same weeks. USGS recorded a regional rock salt shortage in New York in early 2025, and the 2026 shortages covered a far wider area. Two consecutive winters of delivery failures have moved buyer priorities from lowest price toward assured supply.
Shortages Pushed Some Buyers Toward Costlier Deicers
During the Michigan shortage, commercial contractors switched to calcium and magnesium chloride despite the higher cost, and Lansing switched to a chloride-and-sand mix during the coldest period. Sodium chloride loses much of its effectiveness below about 15°F, at which point calcium and magnesium chlorides perform better.
The USGS assessment of substitutes is unchanged in the 2026 edition. No economic substitutes exist for most applications, and calcium chloride, calcium magnesium acetate, hydrochloric acid and potassium chloride can replace salt in deicing only at a higher cost. Government-funded transportation research found that calcium and magnesium chlorides can damage concrete, whereas sodium chloride brines do not.
Substitution rose at the edges during the shortage, then stopped where cost and concrete damage set limits. Alternative deicers serve as an emergency backstop, not a replacement, and demand for sodium chloride remains intact once supply returns.
Suppliers Now Choose Which Public Contracts to Fill
Procurement for the 2026-27 winter ran from spring through late summer and showed suppliers declining parts of the public market. In several states, pooled tenders received no offers at all. Agencies then paid sharply higher prices when they negotiated directly with suppliers.
Hundreds of Illinois Towns Drew No Bids
More than 250 Illinois communities could not secure salt through the state purchasing pool for the 2026-27 season. The state’s purchasing agency said one large supplier that usually wins the contract chose not to participate, leaving gaps for some locations.
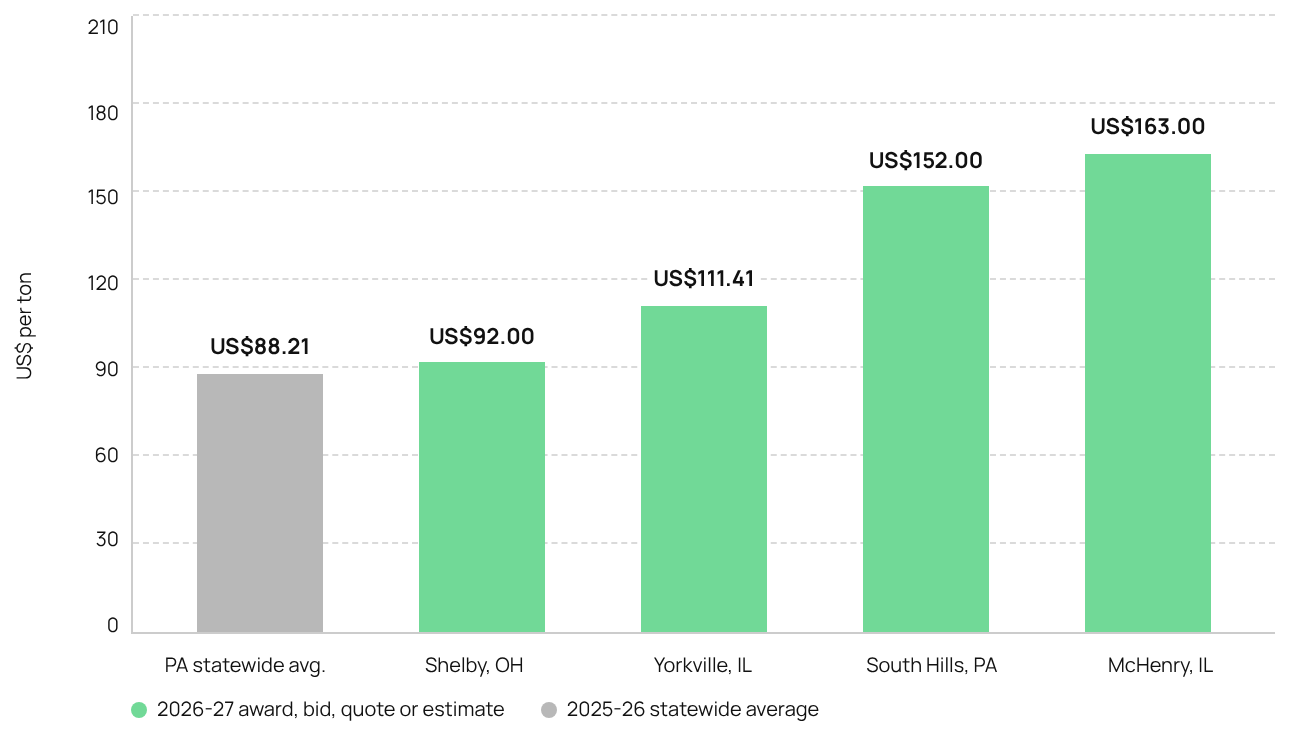
Communities without a contract went directly to suppliers. Yorkville approved a US$256,243 contract with Midwest Salt at US$111.41 per ton. McHenry received two quotes: US$120 per ton from Midwest Salt and US$163 per ton from Morton Salt. Public works directors were told of a regional shortage, though one said he could not tell whether the shortage was due to supply or transport.
Results varied across Illinois, and some communities secured salt through county joint bids. The failures were concentrated rather than universal. Suppliers committed only limited available tonnage selectively, rather than leaving the public market entirely.
Producers turning down public contracts contradicts industry claims of spare capacity. Nolan Peterson, CEO of Atlas Salt, points to how bidding changed between the last two seasons:
“Last year you can see some cities were getting bids from multiple mines, two or three in many cases. This year, many of these mines are not bidding on those same contracts. So if the capacity is there, as they say, why are they not bidding? Why are they ceding ground and territory?”
Winning Bids Came in Far Above Last Season
The City of Shelby, Ohio estimated about US$92 per ton for additional salt, against US$64.96 per ton paid in the spring, an increase of 42%. The city requested 800 tons through the state, half its typical seasonal use.
Pennsylvania’s statewide road salt contract for August 2025 to July 2026 averaged US$88.21 per ton, up from US$84.41 the year before. County prices ranged from US$59.62 in Erie to US$111.10 in Mifflin. American Rock Salt won 38 counties, Cargill 17 and Compass Minerals 6. In the South Hills of Pittsburgh, a regional purchasing group received a single bid of US$152 per ton, against US$88.32 accepted a year earlier, an increase of 72%. The council rejected both, noting it still held about 8,000 tons under the previous contract. The lower bid is 72% above the prior statewide average.
Increases of 42% to 72% in Ohio and Pennsylvania compare with a rise of about 4.5% in Pennsylvania’s statewide average a year earlier. Suppliers are also pricing municipal business as the higher-risk segment of public demand.
Delivery Guarantees Make Suppliers Selective
Most state salt contracts use volume flexibility clauses, commonly the 80/120 structure. The purchasing agency guarantees to buy at least 80% of the target volume, and the supplier guarantees to deliver up to 120% on request. Bands vary by state: New York uses 70% to 150%, Ohio 90% to 110%, and New Jersey 50% to 120%. Research for state transportation agencies found tighter bands lower per-ton prices, with Iowa recording a 3.37% average decrease after narrowing its band.
When stockpiles are low and production is fully committed, an obligation to deliver up to 120% becomes a large liability in a severe winter, and declining to bid caps the exposure. One of the largest highway suppliers said it expects to commit to lower volumes for fiscal 2027 while it rebuilds inventory.”
Pricing power in road salt shows up first as bid coverage, and only then as bid price. Once suppliers can choose among contracts, buyers have to pay for delivery guarantees and wide volume bands. Suppliers with spare inventory hold the stronger position in negotiations.
Delivery, Not the Mine, Captures the Value of Road Salt
Federal unit values measure salt at the mine or plant gate. Municipal contract prices include freight, storage and the cost of guaranteed winter delivery. The widening gap between the two shows where value in the supply chain now accrues.
Mine-Gate Rock Salt Prices Have Fallen Since 2021
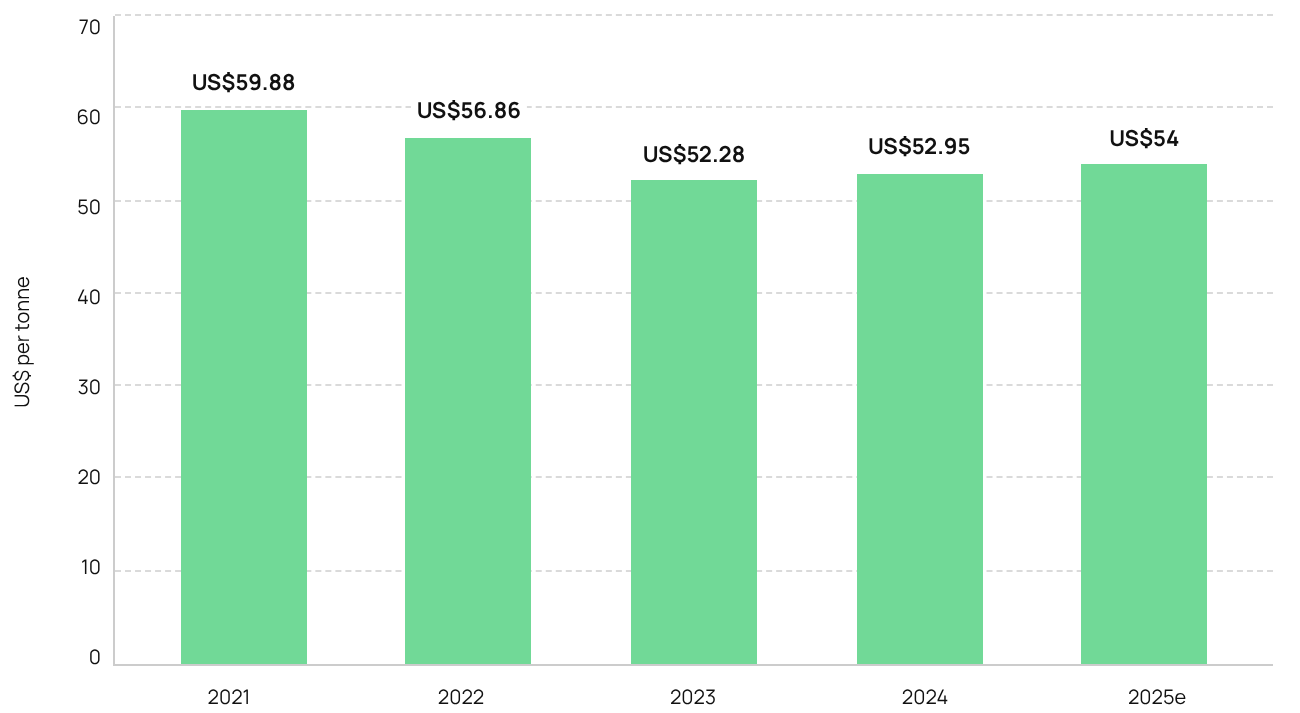
USGS average unit values for rock salt were US$59.88 per tonne in 2021, US$56.86 in 2022, US$52.28 in 2023, US$52.95 in 2024 and an estimated US$54 in 2025. The revised 2023 figure is about 14% below the earlier estimate of roughly US$61 per tonne. On the revised series, rock salt mine-gate values fell about 10% from 2021 to 2025.
Other grades moved differently. Vacuum and open pan salt rose from US$203.72 per tonne in 2021 to an estimated US$260 in 2025, an increase of about 28%. Salt in brine rose from US$8.14 to an estimated US$11, and solar salt ended near US$150 after swinging between US$129 and US$154. Energy-intensive evaporated grades gained value, while rock salt did not.
Earlier data indicated a gradual appreciation in rock salt values, but the revised series no longer supports that pattern. Price and margin comparisons built on the older federal figure overstate mine-gate economics. Mine-gate value now has little bearing on what snowbelt buyers pay.
Freight, Storage & Timing Make Up Most of the Delivered Price
USGS reports unit values free on board at the mine or plant, which excludes transportation. Market Research Intellect, in its October 2026 road salt study, finds delivered cost depends on freight, loading capacity, covered storage, barge and rail availability, and emergency delivery. It adds that logistics can account for more of the invoice than the salt itself in coastal or remote markets. The study concludes producers with mines, terminals and dependable transport contracts hold an advantage over opportunistic traders.
The 2026-27 contract prices cited above range from about US$88 to US$163 per ton, against a mine-gate rock salt value near US$54 per tonne. The difference covers freight, terminal handling, storage, delivery guarantees and the supplier's exposure to weather-driven volume swings. Producer revenue and public budgets are both set by the delivered price.
Control of terminals, storage, and transport accounts for more of the road salt price than tonnage alone. Realized delivered price per ton is the measure tied to producer earnings, and federal unit values are not.
Steady Buyers & Retail Channels Spread Weather Risk
Market Research Intellect identifies five buyer groups for road salt. Municipal and state road agencies are the largest, followed by highway maintenance contractors, airports, commercial property owners and industrial site operators. Industrial buyers purchase based on site risk and operational continuity rather than municipal winter budgets.
Crux Investor’s 2026 Salt Report found packaged retail salt commands materially higher producer-level prices than bulk product. The premium reflects packaging, handling and distribution, not any difference in the salt. Retail purchases are triggered by weather forecasts, while municipal purchases follow contract schedules.
A supplier's channel mix therefore shapes the stability of its earnings. Producers selling only to public tenders bear the full weather and procurement cycles. Access to retail, commercial and industrial buyers spreads sales across the season and raises the average price realized per ton.
Higher Salt Prices Have Not Yet Lifted Producer Margins
Compass Minerals is one of the largest highway salt suppliers in North America and the primary producer that reports road salt data every quarter. Its fiscal year ends September 30. Results for fiscal 2026 show how the tighter market reaches a producer's revenue, and why higher prices have not yet reached its margins.
Highway Salt Bids Rise by Double Digits in Some Markets
In the first fiscal quarter, covering October to December 2025, Compass salt revenue rose 37% to US$331.5 million on highway volumes up 43%. In the second quarter, covering January to March 2026, salt revenue fell 12% to US$382.6 million as highway volumes dropped 22%. For the first half, highway deicing revenue rose 6%, on prices 8% higher and volumes 2% lower.
Realized highway prices reached US$83.74 per ton in the third quarter, against US$77.63 a year earlier, after the fiscal 2025 average slipped to US$71.53 from US$73.23. Management said the 2026-27 bid season produced substantial price gains, well into double digits in certain markets. It described North American highway markets as structurally tight, with low inventories supporting both pricing and tender sizes. Fiscal 2026 highway volume guidance rose from 8.0-8.4 million tons in December 2025 to 8.6-8.8 million tons by August 2026.
Rising Mine Costs Absorb Part of the Price Gains
In the third quarter, Compass combined average salt prices rose 9%: highway prices rose 8% and consumer and industrial prices 6%, while total volumes fell 4%. Salt segment adjusted earnings before interest, taxes, depreciation and amortization fell 15% to US$38.9 million. The company attributed the decline to lower sales volumes and higher per-unit product and distribution costs.
A pricing reset does not, by itself, lift producers' earnings. Cost per ton at existing mines decides how much of the higher contract prices reaches margins, and producers with lower, steadier mining costs keep more of the gain.
Trade & State Policy Add Risk to Cross-Border Salt
Salt entered 2026 duty-free: USGS listed sodium chloride as free under Normal Trade Relations as of December 31, 2025. Trade tensions between the United States and Canada then changed the status of Canadian road salt twice in less than a month, mid-procurement cycle. Over the same period, New York moved away from its domestic-only purchasing preference.
A 50% Duty Hit Canadian Salt During Bid Season
The United States imposed 50% tariffs on about US$20 billion of Canadian goods under Section 338 of the Tariff Act of 1930. Canada responded with retaliatory tariffs on about 700 US products effective September 8. Canadian road salt and cement were subject to a 50% duty as of August 29. Two Kansas-based producers own and operate Canadian mines and ship the salt into the United States for distribution.
A presidential proclamation then removed road salt, cement and six other categories of Canadian goods from the duty, effective September 15, describing the change as narrowing the earlier tariffs in the public interest. Senator Susan Collins of Maine lobbied for the road salt and cement exemption, and Senator Jerry Moran of Kansas welcomed it after raising concerns in August.
The exemption arrived after many states had already run their 2026-27 tenders, so summer bids were priced while the duty was pending or in force. A duty lasting about 17 days showed that Canadian supply carries trade policy risk in addition to freight and weather risk.
New York Drops Its US-Only Salt Rule After Shortages
Under New York's Buy American Salt Act, American Rock Salt became the supplier for about half the state, growing from eight counties to 31. When severe weather hit in early 2025, the New York State Office of General Services asked other rock salt companies on January 30 whether they could supply emergency salt. It listed nine counties directly affected by the contractor's inability to deliver.
The Office of General Services then said the Buy American preference would not apply to its 2025-26 road salt solicitation, citing factors including the prior winter's shortages. The state sought restitution from the contractor and received six bids for the following winter. Assembly Bill A5890 would create a Buy North American Salt Act, extending the procurement preference to rock salt mined in Canada.
Origin preferences break down when in-state capacity cannot cover peak demand. New York has set aside origin rules in practice, and a pending bill would extend the preference to Canadian salt, which would favor suppliers with proven winter delivery records. The shift favors suppliers with proven winter delivery records.
A Warm Winter Forecast Puts Volumes at Risk
The National Oceanic and Atmospheric Administration (NOAA) 2026-27 US Winter Outlook, released October 16, covers December through February. It expects a very strong El Niño to shape the season, favoring warmer-than-average temperatures across much of the northern United States and wetter-than-average conditions across the southern tier and along the East Coast.
The strongest odds of above-average temperatures are across the Pacific Northwest, northern Rockies, Midwest, Mississippi Valley, much of the East, and Alaska. Drier-than-average conditions are favored for parts of the northern Rockies and the Great Lakes, while the Ohio Valley and northern Plains have equal odds of below-, near- or above-average precipitation. Ken Graham, director of the National Weather Service, said a very strong El Niño will likely shift the jet stream south and east, raising the odds of stormier weather across the South.
The Number of Icing Events Matters More Than Snowfall
USGS states the number of winter weather events, including freezing rain, sleet and snow, predicts rock salt demand better than total snowfall, and several small events usually require more salt than one large storm. The 2024-25 winter illustrates the point. Snowfall was below average across much of the snowbelt, yet an arctic outbreak brought record snow to parts of Florida and Louisiana, and salt consumption rose in 2025.
Market Research Intellect finds that climate patterns can produce fewer ordinary snow days but more abrupt freeze-thaw events, rain-on-snow episodes, and heavy storms, all of which increase salt use per event. NOAA forecasts seasonal averages, not the count of icing events.
A warm seasonal outlook is a weak guide to salt demand. The wetter East Coast forecast brings more precipitation to the densely populated Northeast, where temperatures near freezing determine whether it falls as rain or ice.
Contract Floors Protect Supplier Revenue in Mild Winters
Prices for 2026-27 were set in spring and summer tenders. Under the 80/120 structure, agencies buy at least 80% of contracted volume, so a mild winter reduces shipments above the floor rather than the price per ton.
Market Research Intellect notes a mild winter leaves municipal stockpiles high and can weaken the following purchasing cycle. USGS recorded the same pattern after the mild 2022-23 winter, when domestically sourced stockpiles were sufficient in many areas, and rock salt imports declined.
Weather risk for the coming season sits in the volume above contract floors. The larger effect of a mild winter arrives a season later, through rebuilt stockpiles and weaker bidding the following spring.
Municipal buying habits reinforce the contract floor, because agencies size purchases to their storage capacity rather than to the weather forecast. Nolan Peterson describes how cities approach the annual purchase:
“The cities buy essentially the same amount of salt every year. They look at the size of their yard, and if it can hold 20,000 tons, they’re going to fill it with 20,000 tons of salt... The risk of the downside of not having the salt far exceeds the cost of just buying as much as you can and stocking up for it.”
Road Salt is a Slow-Growth Market Where Position Drives Returns
Beyond the coming winter, road salt grows slowly, and efficiency rules limit growth in tonnage. Returns in a market of this kind come from pricing, logistics and channel position, not from rising volume.
Outside Estimates Put Global Growth Near 4% a Year
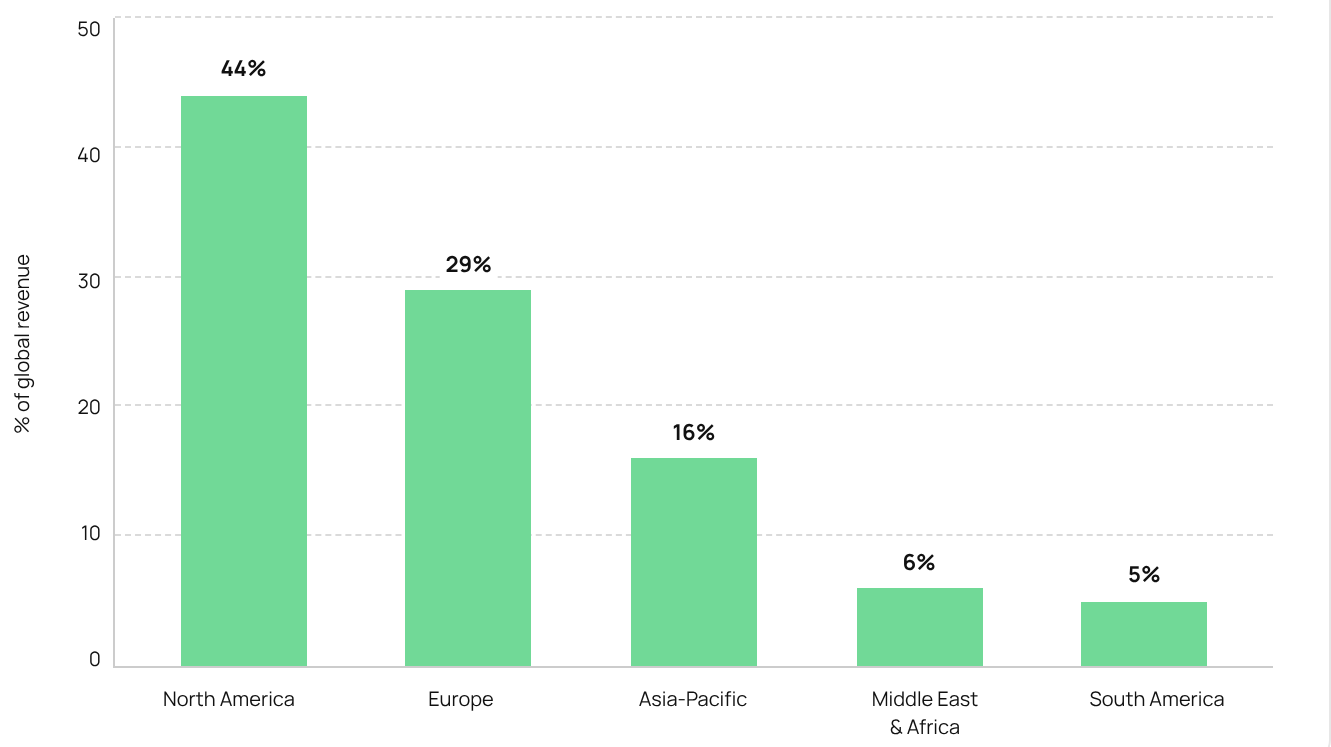
Market Research Intellect values the global road salt market at US$24.8 billion in 2025 and US$25.8 billion in 2026. It projects US$37.1 billion by 2035, a compound annual growth rate of 4.1%. North America holds 44% of global revenue, about US$10.9 billion, followed by Europe at 29%, Asia-Pacific at 16%, the Middle East and Africa at 6%, and South America at 5%.
The basis differs from the USGS figure of US$2.6 billion. USGS counts all US salt at the mine or plant gate, while Market Research Intellect counts salt and associated road-deicing supply sold into transportation and property maintenance.
Even allowing for the different scopes, the distance between the two figures shows how much of road salt's value is created after extraction, in delivery, storage and service.
Chemical Demand Follows a Different Cycle
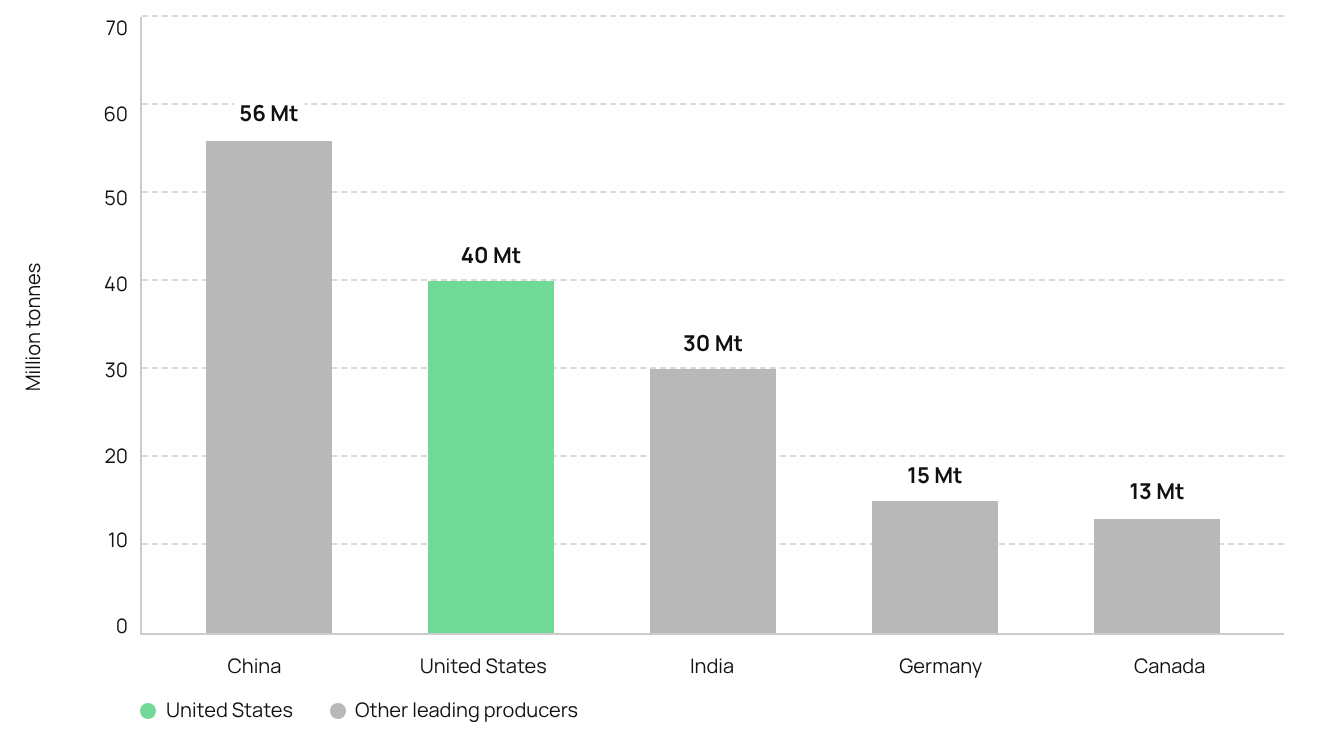
USGS estimates world salt production at 270 million tonnes in 2025, against 275 million tonnes in 2024. China led at 56 million tonnes, followed by the United States at 40 million and India at 30 million, down from 34 million. Germany produced 15 million tonnes, Canada 13 million (up from 10.6 million) and Australia 12 million.
USGS expects global demand for brine used in chloralkali production to rise in 2026 as demand for caustic soda and polyvinyl chloride grows, especially in Asia, while US domestic demand remains largely flat. Salt exports from Australia and India have risen to meet the growth. In Europe, demand is expected to fall as chloralkali plants close because of high energy costs and weak chemical demand. High energy costs reduce European salt consumption and help no part of the supply chain.
Producers with chemical brine operations have a revenue stream tied to industrial demand rather than winter weather, which helps stabilise earnings during mild deicing seasons.
Efficiency Rules Cut Waste Without Replacing Salt
Market Research Intellect reports agencies are moving from broadcast dry-salt spreading toward calibrated application, pre-wetted salt and liquid brine. Most agencies make brine from solid salt, so the shift keeps demand for crystalline salt in place. It slows tonnage growth while raising demand for storage tanks, spreader controls and reliable regional supply.
The US Environmental Protection Agency's chronic aquatic life criterion for chloride remains 230 milligrams per litre. New Hampshire's Salt Reduction Initiative remains the clearest example of a state reducing salt use through equipment upgrades and application monitoring rather than by lowering road safety standards, and Federal Highway Administration guidance continues to treat pre-wetting and anti-icing as best practices.
Environmental pressure trims tonnage per storm but rewards suppliers able to provide consistent product, brine feedstock and dependable delivery. Market Research Intellect expects producers with integrated mines, terminals and service partnerships to capture a larger share of contracted and emergency demand.
No New Mines Leave Existing Capacity Scarce
Cargill ended production at its Avery Island mine in Louisiana in January 2021. The mine was one of three Cargill operations producing deicing salt for the United States and Canada, and closure work, including flooding the mine, began in June 2022. Cargill expanded its Breaux Bridge evaporation plant in Louisiana, but evaporated salt is a higher-cost product and not the typical highway grade. The USGS plant count fell from 63 plants across 16 states in the 2023 data to 60 plants across 15 states in the 2025 data.
No new salt mine has entered production in North America in nearly three decades. Atlas Salt is developing the Great Atlantic Salt Project in Newfoundland, positioned as the first new North American salt mine in nearly three decades.
The absence of new supply reflects the cost and risk of the existing mine base as much as any shortage of capital. Nolan Peterson explains why exploration for new deposits has stalled:
“Many of these mines are very old. They’re all shaft mines, which are very expensive to develop in 2026, and many of them sit under bodies of water... It creates the risk of water inflow... If you can raise $10 million, you’re going to look for gold... So, nobody’s been looking for salt in North America.”
Permitted, producing salt mines close to snowbelt markets carry scarcity value, since demand peaks can be met only from existing capacity or imports. A new project capable of completing permitting and delivering to the Northeast by water would enter a market where buyers now pay for assured supply. Canadian supply also carries the trade-policy risk shown in 2026.
Supply Security Has Become the Main Driver of Road Salt Value
North American road salt has moved from a market where buyers chose among suppliers to one where suppliers choose among buyers. Domestic output has held near 40 million tonnes, import reliance has ranged from 23% to 37% over five years, and Mexico has surpassed Canada as the largest import source. Imports carry most of the swing in winter demand.
The 2025-26 winter drew down stockpiles across the Great Lakes, New England and Ontario. The 2026-27 procurement cycle then recorded failed tenders in Illinois and Ohio and quotes 42% to 72% above prior prices in Ohio and Pennsylvania. Mine-gate rock salt values sit below their 2021 level, while delivered and realized highway prices rose. Producer costs rose alongside prices.
Policy and weather added uncertainty. A 50% duty on Canadian road salt applied for about 17 days, and New York set aside its domestic-only preference after a shortage under the rule. NOAA expects a very strong El Niño and a warmer northern winter, replacing last season's La Niña assumptions, while chemical brine demand follows its own industrial cycle. Value in the market now rests on delivery capacity, inventory and access to snowbelt buyers.
The Investment Thesis for North American Road Salt
- Delivered economics separate stronger producers from weaker ones. Realized price per ton and cost per ton track producer earnings more closely than federal mine-gate values. Mine-gate values sit below their 2021 level, while contract prices rose in 2026.
- Bid coverage signals pricing power as clearly as bid price. The share of public tenders receiving no offers in the spring 2027 cycle will indicate whether 2026 pricing remains the new floor.
- A mild winter reduces volume more than revenue per ton. With prices locked and 80% minimum purchase terms common, a warm season cuts shipments without lowering contract prices. Stockpile levels entering the spring bid season carry more weight for pricing.
- Canadian supply brings both a logistics advantage and a policy risk. Short-haul Canadian salt covers storm demand in the Northeast and Great Lakes, but the 2026 duty showed US trade policy can impose and lift tariffs within weeks.
- Owned logistics and inventory near the snowbelt command the strongest position. In a tight market, suppliers able to honor 120% delivery obligations choose their contracts and set terms.
- Returns in road salt depend on margin, not market growth. Outside estimates put market growth near 4% a year, so producer returns rest on capturing price and controlling cost.
Road salt now prices certainty of delivery more than the cost of mining. Flat domestic output, wide swings in import reliance and drawn-down stockpiles leave little slack when icing events cluster, and public buyers already pay more for assured supply.
The coming winter tests volume more than price. A warm El Niño season would ease pressure on stockpiles, but 2026-27 contract prices are fixed. The more telling signal arrives with the spring 2027 tenders: whether suppliers again decline public contracts, and whether prices hold near 2026 levels.
Cross-border trade remains a live variable. Canadian supply serves the storm-exposed Northeast and Great Lakes, while US trade policy toward Canada has shown it can change within weeks. Suppliers with nearby capacity, owned logistics and controlled mining costs are positioned to keep the gains from tighter supply. Suppliers relying on long-haul imports or spot sales face the greatest exposure to weather and policy risk.
TL;DR
North American road salt has turned into a seller's market. USGS data show flat domestic output near 40 million tonnes and net import reliance swinging between 23% and 37%. After shortages depleted stockpiles during the 2025-26 winter, more than 250 Illinois communities and several Ohio counties received no bids through state programs. Quotes in Ohio and Pennsylvania ran 42% to 72% above prior prices. Mine-gate rock salt values remain below 2021 levels, so value sits with suppliers that control delivery, storage and inventory near the snowbelt. A short-lived 50% duty on Canadian salt and a warm El Niño outlook add policy and volume risk, while 2026-27 contract prices stay locked.
FAQs (AI-Generated)
Analyst's Notes





Subscribe to Our Channel






Stay Informed


