US GDP Slows to 2.0% & 3.8% CPI Inflation Expand Gold Producers’ Operating Leverage


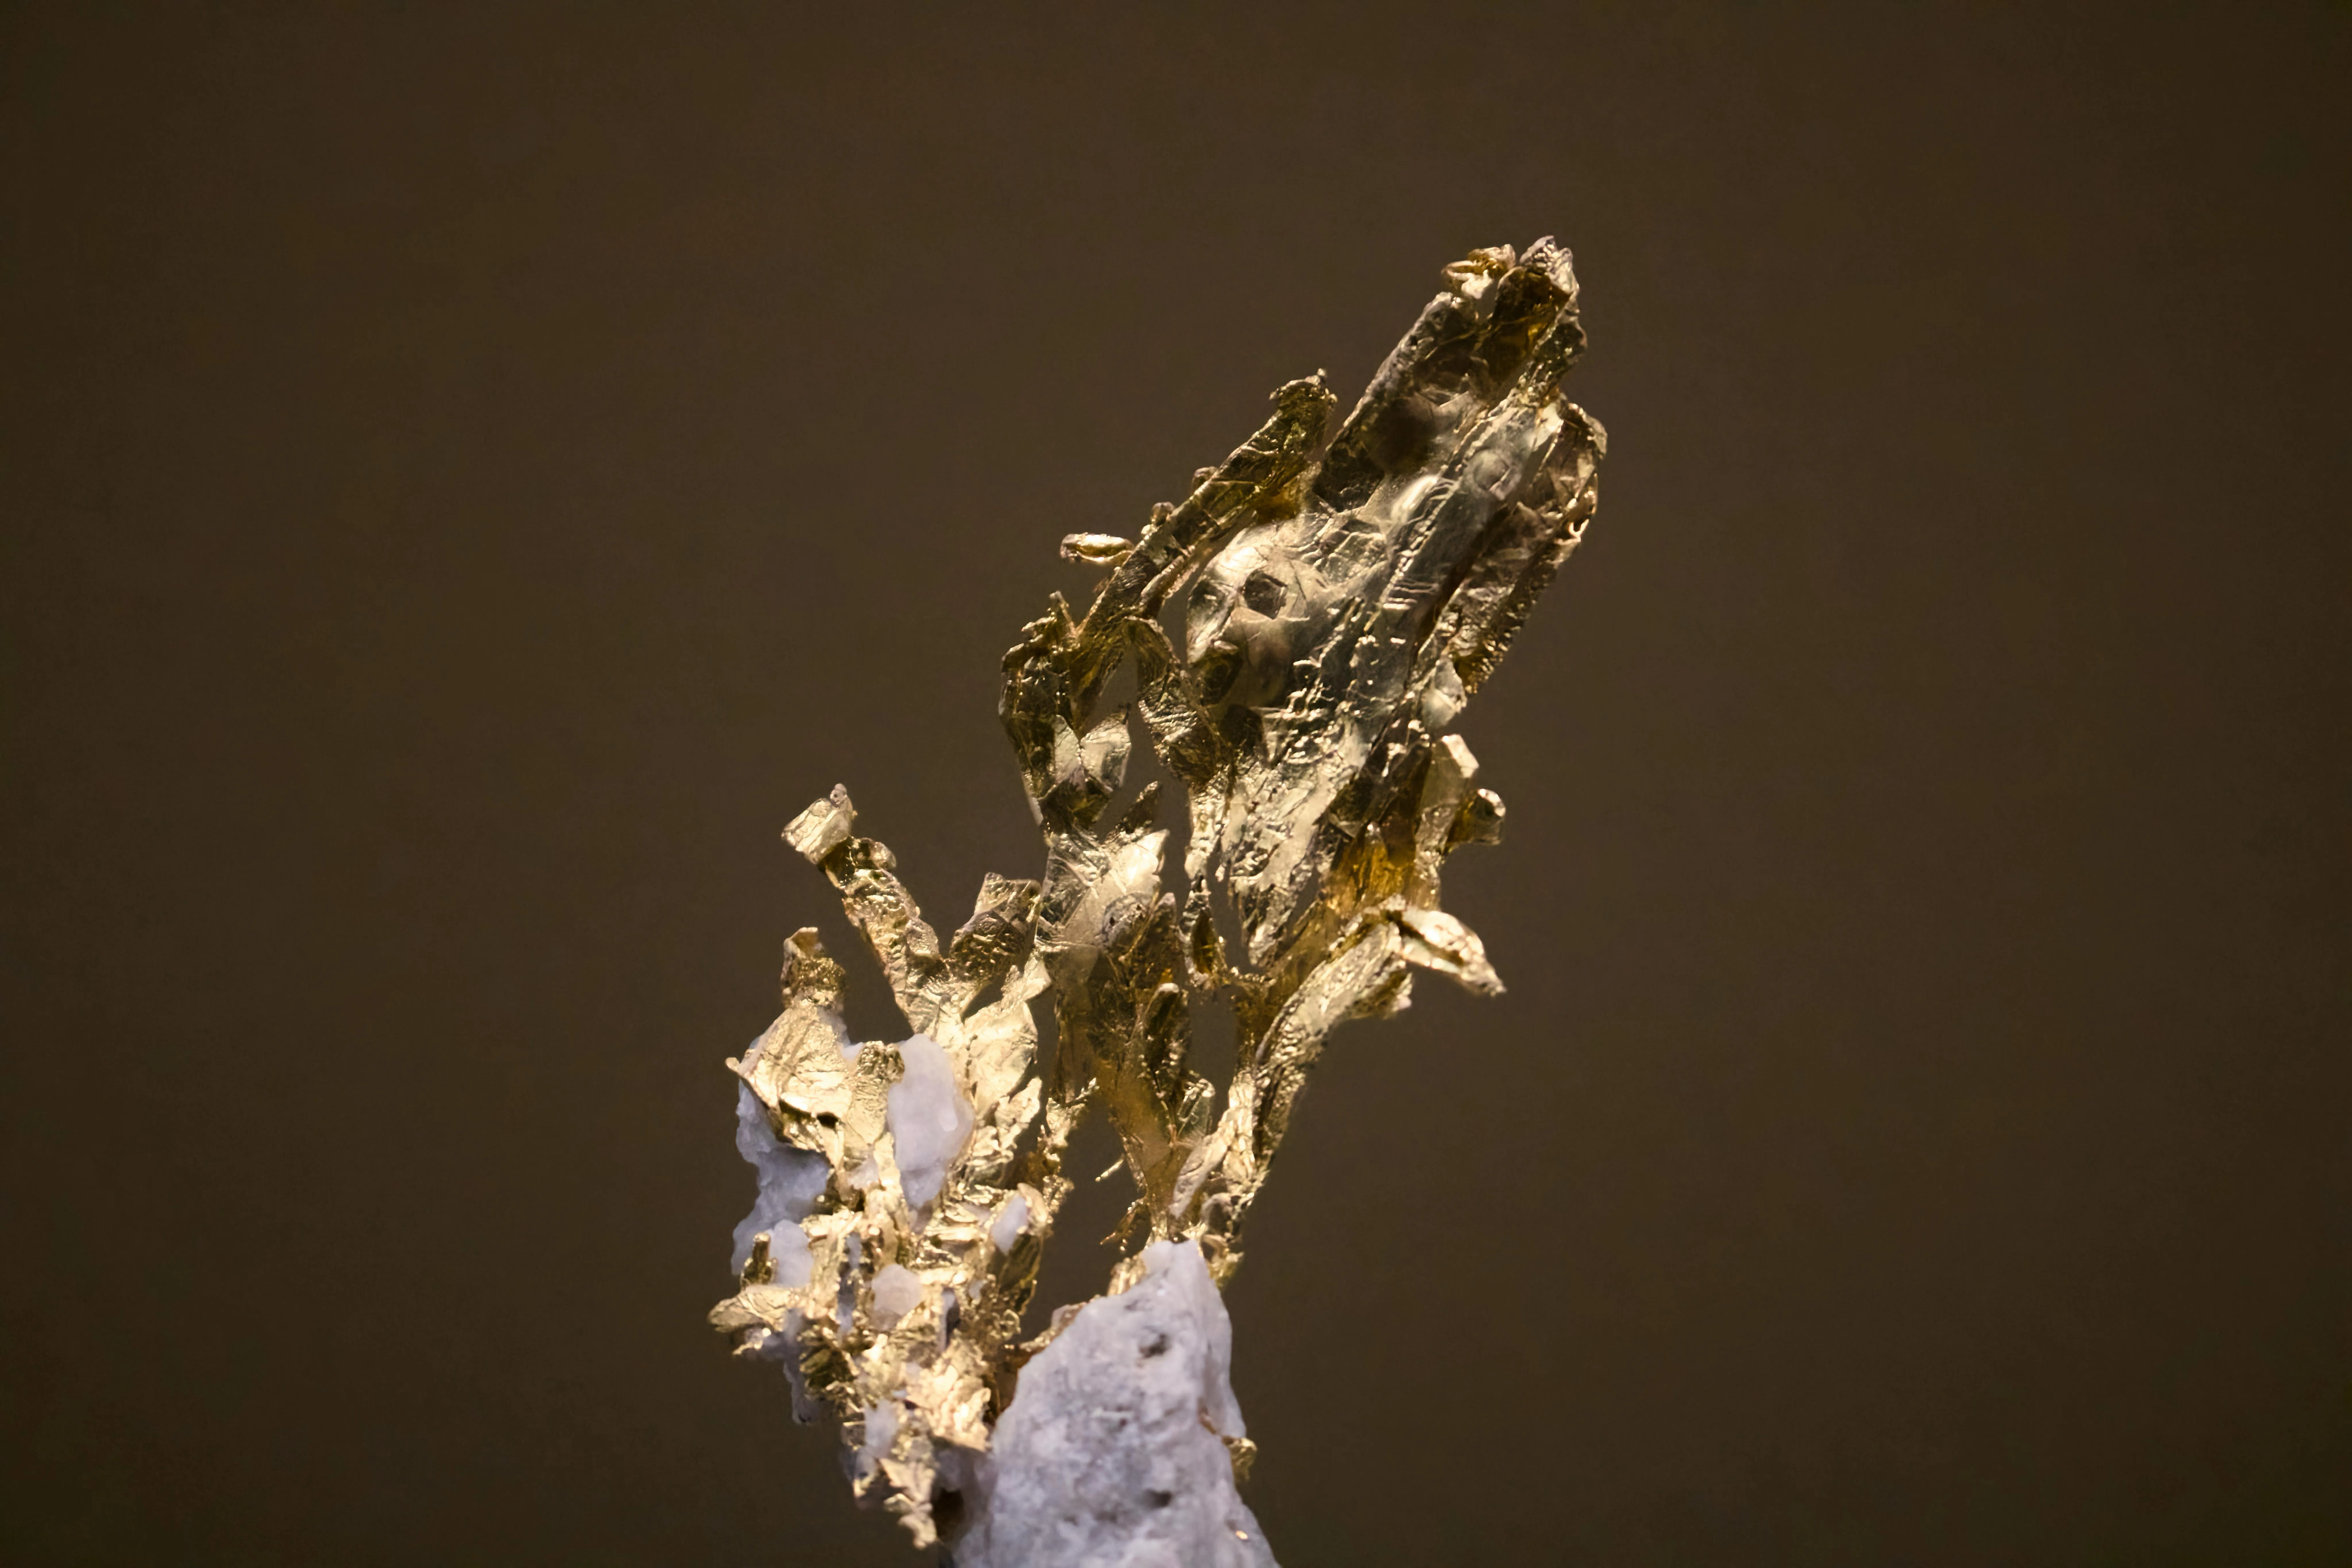
US GDP growth slowed to 2.0% while CPI inflation reached 3.8%, supporting stronger gold demand and margin upside for production-stage gold companies.
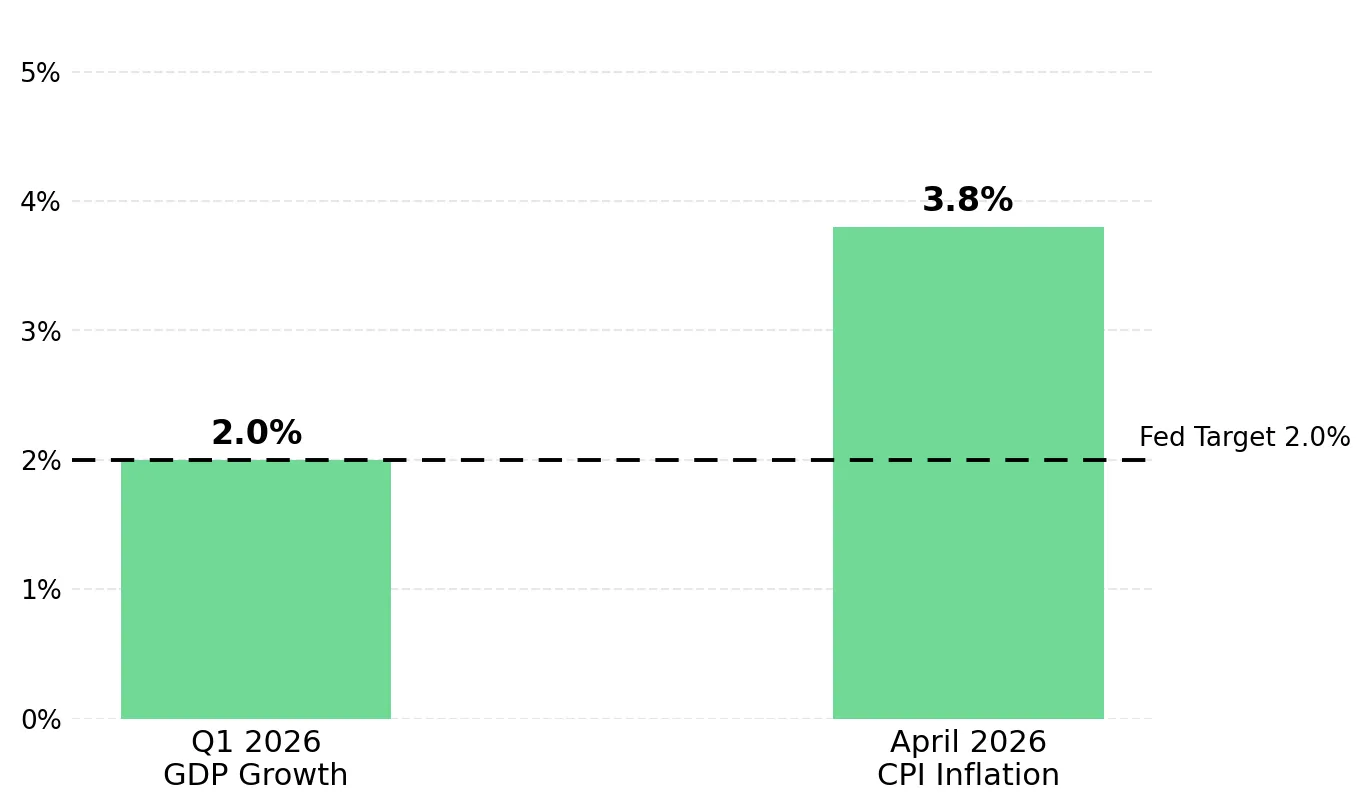
- US Q1 2026 GDP growth of 2.0% against April CPI inflation of 3.8% marks the widest growth-inflation spread since mid-2022, supporting gold demand as both an inflation hedge and a recession hedge without requiring Fed rate cuts.
- J.P. Morgan, Goldman Sachs, ANZ, and ING expect weaker gold price performance in H1 2026 followed by stronger H2 buying, while maintaining year-end targets between $5,400 and $6,000 per ounce.
- The World Gold Council’s Q1 2026 Gold Demand Trends report recorded total gold demand value at a record $193 billion, up 74% year-on-year, driven by 244 tonnes of central bank net purchases and a 42% rise in global bar and coin demand even with spot gold trading 19% below its January 2026 peak.
- The BEA GDP Second Estimate on May 28, 2026 is the nearest-term catalyst for gold; a higher PCE deflator and weaker growth revision would strengthen the inflation-and-slowing-growth thesis and could push gold above the $4,650 to $4,730 moving average resistance range.
- Production-stage gold companies with Mine-site AISC below $3,000 per ounce are generating positive margins at current spot prices near $4,500; a move toward bank targets of $5,400 to $6,000 per ounce would increase those margins by 40 to 60% through operating leverage, giving producers higher upside than physical gold or broad gold ETFs.
US Stagflation Risk & Implications for Gold
The Bureau of Economic Analysis advance estimate for Q1 2026 recorded real GDP growth of 2.0% annualized, below the 2.3% consensus expectation. Much of the Q1 growth came from businesses building inventories ahead of tariffs, a temporary boost that could reverse in later quarters. April 2026 CPI came in at 3.8% year-on-year, the highest reading since mid-2023. US Treasury Q2 TBAC data shows non-housing core services inflation rose to 0.4% per month in Q1 2026 from 0.1% in Q4 2025, indicating inflation is spreading from energy into wages and services. The IMF's April 2026 World Economic Outlook assumed US inflation at 3.2% for 2026, a full 120 basis points above the Fed’s 2% target.
Rates have remained at 3.5% to 3.75% through 2026, with markets pricing a 67% probability of no rate cuts for the rest of the year. Fed Chair Kevin Warsh faces pressure to lower borrowing costs while the IMF warns that premature rate cuts could push inflation expectations higher. The Fed cannot raise rates further without risking slower growth, and it cannot cut rates without risking higher inflation expectations. That policy constraint supports gold demand as both an inflation hedge and a slowdown hedge.
The BEA GDP Second Estimate on May 28 is the next major macro catalyst for gold prices. Markets are likely to focus less on the 2.0% GDP estimate, which is already partly reflected in prices, and more on any upward revision to the Personal Consumption Expenditures deflator. Lower growth combined with a higher PCE deflator would strengthen the case for gold as both an inflation hedge and a slowdown hedge, while increasing the likelihood of a breakout above the $4,650 to $4,730 moving average resistance range.
Gold’s Dual-Hedge Role & Expanding Global Demand
The World Gold Council’s Q1 2026 Gold Demand Trends report recorded quarterly gold demand value at a record $193 billion, up 74% year-on-year, even with spot gold trading 19% below its January 2026 high of $5,598 per ounce. Chinese bar and coin demand rose 67% year-on-year to a record 207 tonnes in Q1 2026, while global bar and coin demand increased 42% to 474 tonnes. The continued demand at near-record gold prices indicates investors are buying for long-term portfolio protection rather than short-term trading momentum.
Central bank buying continues to support gold demand at elevated price levels. Central banks purchased a net 244 tonnes of gold in Q1 2026, including estimated unreported flows tracked by the World Gold Council and Metals Focus. The People’s Bank of China increased its gold reserves by 7 tonnes in Q1 2026 to 2,313 tonnes, equal to 9% of China’s total reserves. Gold represents roughly 70% of reserves for Germany, France, Italy, and the US. The reserve gap suggests emerging-market central banks could continue increasing gold holdings for years even if short-term gold prices remain volatile.
Major Banks Maintain Bullish H2 Gold Targets
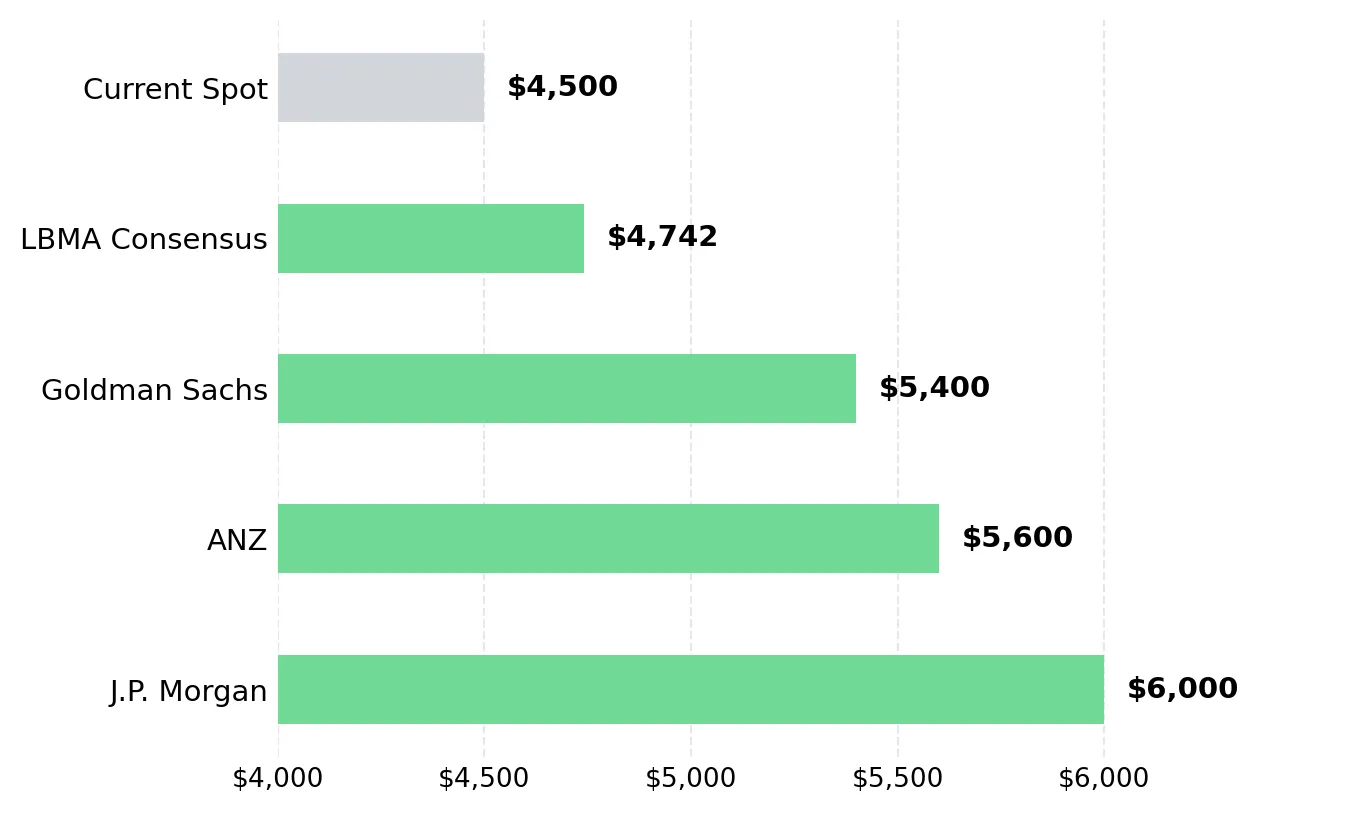
J.P. Morgan lowered its 2026 average gold price forecast to $5,243 per ounce from $5,708 because of weak COMEX positioning and ETF flows, while maintaining its $6,000 year-end target. Goldman Sachs maintained a $5,400 target based on continued central bank buying, while ANZ lowered its target to $5,600. With the LBMA 2026 consensus forecast at $4,741.97 per ounce, spot gold remains near or below major bank expectations despite continued bullish year-end targets.
Spot gold is trading below the 20, 50, 100, and 200-day moving averages clustered between $4,649 and $4,794 per ounce, while the 14-day RSI of 40.62 indicates weaker momentum without oversold conditions. A sustained move above that range could trigger renewed buying from quantitative and institutional investors.
Gold Producers Offer Operating Leverage to Higher H2 Prices
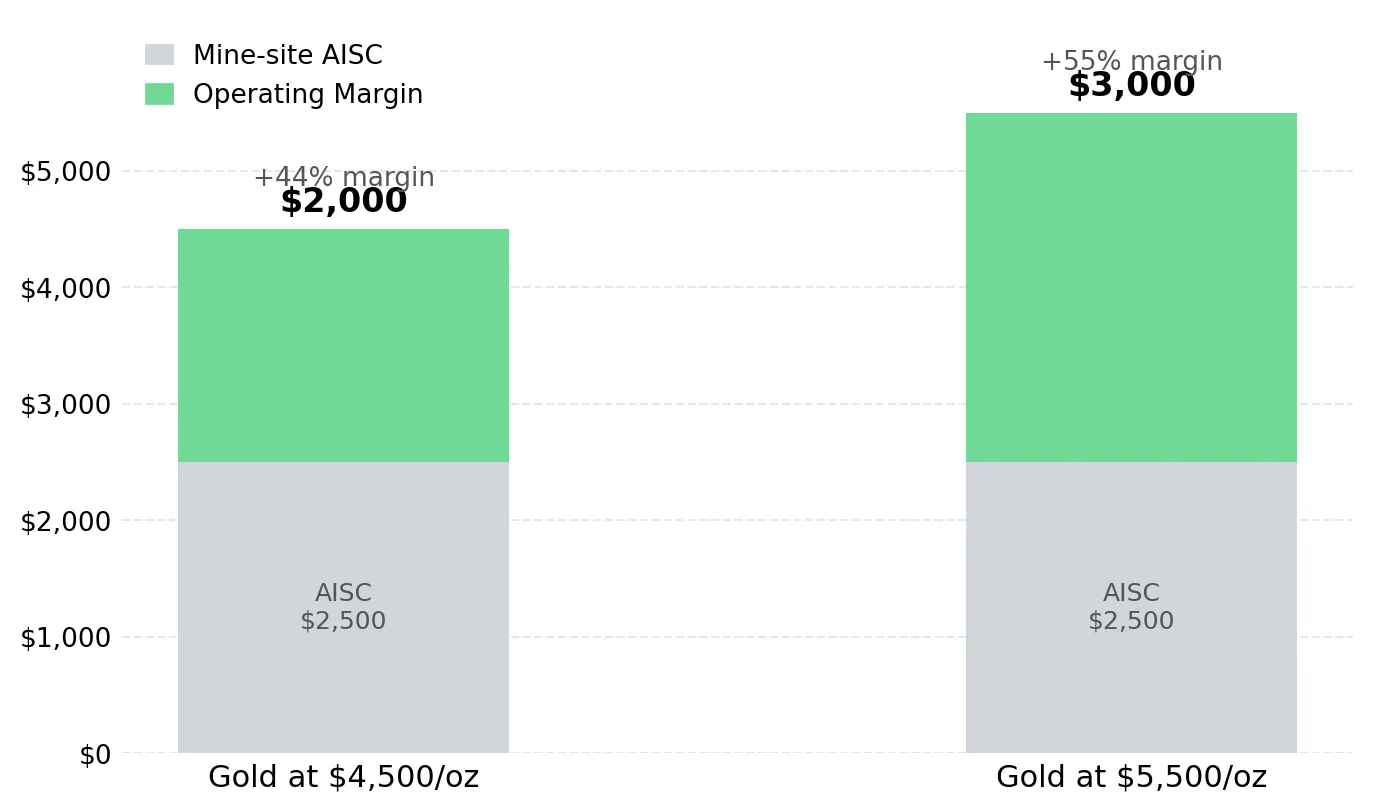
Production-stage gold companies offer higher upside than physical gold or broad gold ETFs because rising gold prices expand operating margins. A producer with Mine-site AISC of $2,500 per ounce generates a $2,000 per ounce margin at a $4,500 gold price. If gold rises to $5,500 per ounce, a 22% increase, that margin expands to $3,000 per ounce, a 50% gain. Physical gold delivers only a 22% price return. That margin expansion is why institutional investors often buy producers before higher gold prices are fully reflected in mining stocks.
Integra Resources Expands Nevada Gold Production & DeLamar Upside
Integra Resources generated $24.9 million in mine operating earnings on $61.7 million in revenue in Q1 2026, with Mine-site AISC guidance of $2,750 to $2,950 per ounce and $105.8 million in cash at March 31, 2026. The February 2026 DeLamar Feasibility Study estimated an after-tax NPV5% of $774 million at $3,000 gold, rising to roughly $1.9 billion at current spot prices near $4,500 per ounce. DeLamar was added to the FAST-41 permitting dashboard in January 2026, placing the project on an accelerated 15-month NEPA review schedule.
George Salamis, President and Chief Executive Officer of Integra Resources, explains how Florida Canyon spending is expected to increase production and cash flow through 2028:
“2026 is about building capacity today at Florida Canyon to deliver more ounces, stronger cash flow, lower costs tomorrow. That high AISC is basically delivering something in the order of 80,000 to 90,000 ounces per year production in 2027 and 2028.”
West Red Lake Gold Mines Expands Red Lake Production Through Madsen Ramp-Up
West Red Lake Gold Mines declared commercial production at the Madsen Mine in January 2026 following a seven-month restart ramp-up in Ontario’s Red Lake district. Full-year 2026 guidance of 35,000 to 45,000 ounces is weighted roughly 60% to the second half, increasing leverage to stronger H2 gold prices. The Rowan Project hosts an NI 43-101 Indicated resource grading 12.78 g/t Au, while the company targets long-term regional production of 100,000 to 120,000 ounces annually through satellite mine integration around the Madsen mill.
Shane Williams, President and Chief Executive Officer of West Red Lake Gold Mines, outlines the company’s production growth strategy around the Madsen operation:
“We can see a pathway to 150,000 ounces a year in Red Lake. Our mill can be ramped up and effectively doubled with very little capital, and we can grow to that 150,000-ounce level through steady expansion around the Madsen operation.”
Serabi Gold Funds Coringa Expansion Through Rising Cash Flow
Serabi Gold produced 44,169 ounces in 2025 and is guiding 53,000 to 57,000 ounces in 2026, targeting more than 60,000 ounces annually from 2027 as Coringa ramps up. The company ended Q1 2026 debt-free with $64.4 million in cash, funding growth internally without external financing. A sub-$10 million ore sorter at Coringa is projected to upgrade feed grades from below 2 g/t to above 12 g/t while removing more than 98% of waste material, reducing transport and processing infrastructure costs. A $5 million ball mill relocation is expected to increase processing throughput to roughly 900 tonnes per day by Q4 2026.
Mike Hodgson, Chief Executive Officer of Serabi Gold, explains how internal cash flow is funding Serabi’s Coringa expansion:
“We generated about $30 million cash, ended the year with $50 million in the bank, and Q1 was even stronger. We got rid of our debt in January and February, so the company is now completely debt-free, and we should be looking at $80 million to $100 million in cash generation this year depending on the gold price.”
i-80 Gold Expands Nevada Gold Production Through Autoclave Infrastructure
i-80 Gold is one of only two Nevada producers with autoclave processing capacity alongside Nevada Gold Mines. Following a $787.5 million recapitalization, the company held $513.5 million in cash at March 31, 2026, materially reducing financing risk. Granite Creek Underground generated a record Q1 2026 gross profit of $16.1 million on revenue of $52.4 million before the Lone Tree autoclave began operations. Lone Tree commissioning is scheduled for Q4 2027, with Phase 1 production targeting 150,000 to 200,000 ounces annually from 2028 as company-owned autoclave processing replaces third-party toll milling.
Paul Chawrun, Chief Operating Officer of i-80 Gold, explains how the Lone Tree autoclave could increase production and cash flow from 2028:
“We’ll have the Lone Tree plant producing gold by the end of 2027 with ramp-up into 2028, targeting roughly 150,000 to 160,000 ounces per year at good margins. At around $3,000 gold, we estimated approximately $150 million to $200 million in annual net cash flow, and at current gold prices those numbers are significantly higher.”
The Investment Thesis for Gold
- US Q1 2026 GDP growth of 2.0% against April CPI inflation of 3.8% marks the widest growth-inflation spread since mid-2022, supporting gold demand as both an inflation hedge and a slowdown hedge without requiring Fed rate cuts.
- Central banks purchased a net 244 tonnes of gold in Q1 2026, including estimated unreported flows, maintaining strong demand even near record price levels. Emerging-market central banks still hold far less gold in reserves than developed economies, supporting continued long-term buying regardless of Western investor flows.
- J.P. Morgan’s $6,000 per ounce year-end target, alongside Goldman Sachs at $5,400 and ANZ at $5,600, indicates major banks still expect higher gold prices even as COMEX positioning and ETF flows remain weak, leaving room for additional institutional buying if sentiment improves.
- The BEA GDP Second Estimate on May 28, 2026 is the next major catalyst for gold; a higher PCE deflator revision could push gold above the $4,650 to $4,730 moving average resistance range and trigger renewed buying from quantitative and institutional investors.
- Producers with Mine-site AISC below $3,000 per ounce and funded operations in Tier-1 jurisdictions offer lower execution risk and greater upside than physical gold or broad ETFs if gold rises toward major bank targets of $5,400 to $6,000 per ounce.
- The LBMA 2026 consensus forecast of $4,741.97 per ounce indicates spot gold is still trading near or below major bank expectations, suggesting the market has not fully priced in stronger H2 gold prices or the potential upside for producers.
Weak Western ETF flows, above-target inflation, and limited Fed flexibility have pressured gold in H1 2026, but those same conditions could support stronger institutional buying later in the year. April 2026 CPI inflation of 3.8% shows price growth remains well above the Fed’s 2% target. Central banks purchased a net 244 tonnes of gold in Q1 2026, maintaining strong demand even near record price levels. Production-stage companies are already generating operating cash flow, advancing development projects, and strengthening balance sheets ahead of the stronger H2 gold prices projected by major bank research desks. Current gold prices may offer an earlier entry point before stronger macro data and institutional buying are reflected in producer valuations.
TL;DR
US GDP growth slowed to 2.0% in Q1 2026 while April CPI inflation accelerated to 3.8%, creating conditions that support gold demand as both an inflation hedge and a slowdown hedge. Central banks purchased a net 244 tonnes of gold in Q1 2026, while major banks including J.P. Morgan, Goldman Sachs, and ANZ maintained bullish year-end gold targets between $5,400 and $6,000 per ounce despite weak ETF flows and COMEX positioning. Production-stage gold companies with Mine-site AISC below $3,000 per ounce are generating strong margins at current gold prices near $4,500 and could see margin expansion of 40 to 60% if gold prices move toward institutional targets. Companies including Integra Resources, West Red Lake Gold Mines, Serabi Gold, and i-80 Gold are using current cash flow strength to expand production and advance development projects ahead of a potential H2 2026 gold recovery.
FAQs (AI-Generated)
Analyst's Notes





Subscribe to Our Channel







Stay Informed