

Central Bank Buying Offsets Weaker Retail Gold Demand in Q3


Fed hike risks test gold ETF demand, while strong cash flow helps producers withstand lower prices and retain exposure to a recovery.
- The World Gold Council’s (WGC) November 3, 2026 report showed Q3 gold demand fell 1% year over year to 1,369 metric tons, while central bank purchases rose 42% to 321 metric tons.
- WGC data published November 3 showed central banks and gold ETFs accounted for 39% of Q3 demand, up from 33% a year earlier, while bar and coin demand fell 19% and jewelry consumption dropped 17%.
- On November 3, CME FedWatch put December Fed hike odds at 75%; a hike would make interest-paying assets more competitive with gold.
- Spot gold traded at US$3,908.49/oz on November 3, 8.3% below the WGC’s Q3 benchmark average of US$4,262.20/oz, reducing revenue per ounce on unhedged sales at that price.
- A recovery would lift revenue from unhedged sales; Tim Waterer, Chief Market Analyst at KCM Trade, said on November 3 that gold needed a convincing move above US$4,000/oz to strengthen its recovery.
Reserve Diversification Lifts Central Bank Gold Purchases 42%
The WGC’s Q3 2026 Gold Demand Trends report put total demand at 1,369 metric tons, down 1% year over year, with an average LBMA price of US$4,262/oz. Central bank and official institution purchases rose 42% to a net 321 metric tons, the highest quarterly total since Q4 2024.
Bar and coin demand fell 19% to 268 metric tons, while jewelry consumption dropped 17% to 313 metric tons, its weakest third quarter since records began in 2000. Physically backed gold ETFs added 211 metric tons after outflows of 47 metric tons in Q2, helping offset weaker retail demand. Spot gold fell 1% to US$3,908.49/oz, roughly 30% below January’s US$5,595/oz record.
Fiscal Concerns Support Gold ETF Buying Despite Higher Yields
The WGC linked weaker bar and coin buying to uncertainty over price direction, although China’s demand rose 7% year over year. High prices pushed jewelry buyers toward lighter, lower-carat pieces, while spending rose 2% to US$43 billion despite lower volumes. Recycling fell 8% to 314 metric tons, its lowest since Q4 2023, limiting scrap supply as mine output reached a third-quarter record of 1,071 metric tons.
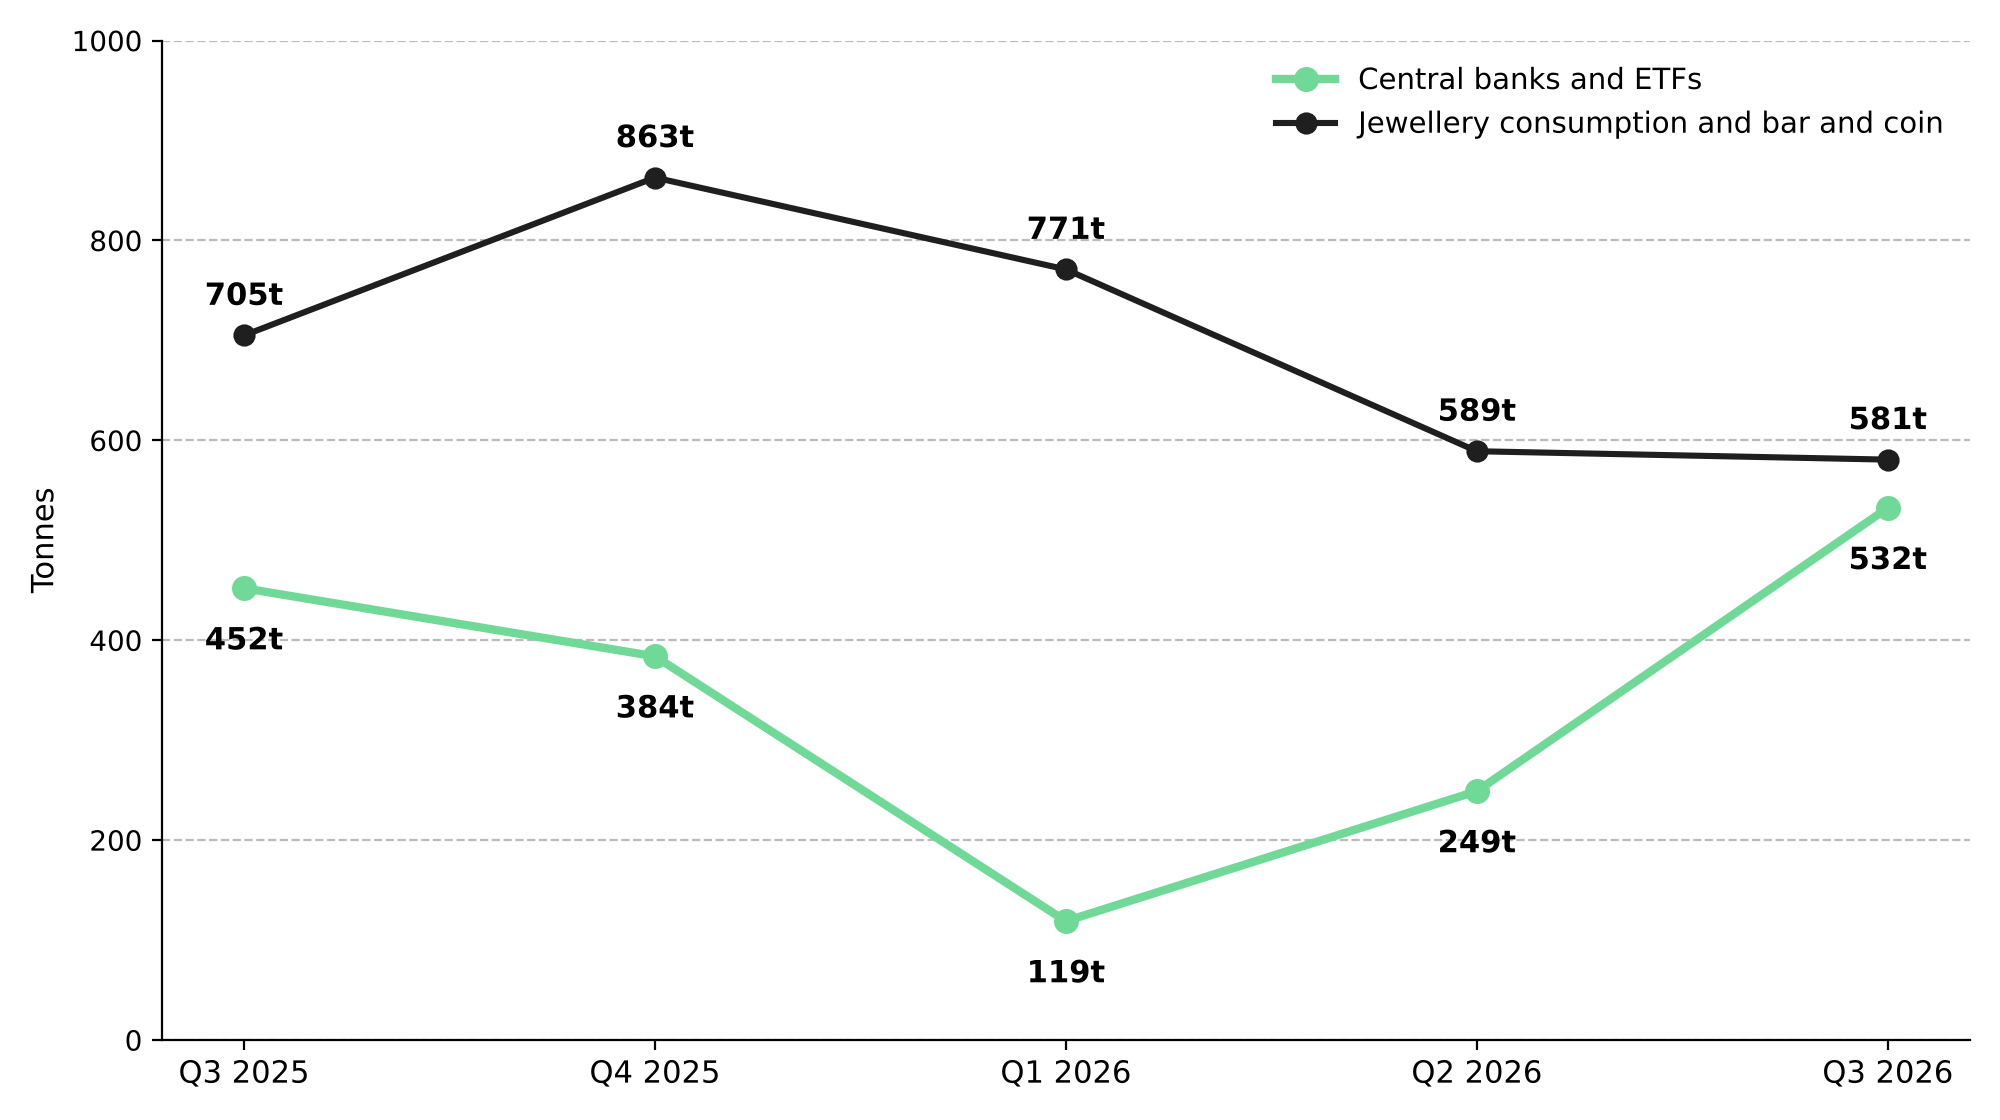
The WGC linked ETF inflows to fiscal and inflation concerns, showing that demand could withstand higher bond yields and a stronger dollar. Renewed oil gains following a reported US strike on Iran’s Qeshm Island heightened inflation concerns, while December Fed hike odds reached 75%. A hike would increase the interest income forgone by holding gold, potentially testing the demand that supported Q3 ETF inflows.
December Fed Hike Risk Could Delay Bullion’s Recovery
Year-to-date central bank purchases reached 675 metric tons, up 6% from the same period in 2025, prompting the WGC to raise its 2026 forecast to at least last year’s 848 metric tons. Krishan Gopaul, Senior EMEA Analyst at the World Gold Council, said full-year purchases could exceed last year’s total.
The WGC cut its forecast for 2026 gold investment demand growth to 200 metric tons from 400, citing weaker bar and coin buying. A December Fed hike could discourage ETF buying by making interest-paying assets more competitive, while fiscal and geopolitical concerns could sustain demand despite higher rates.
Monthly ETF flows will help show whether buying withstands rate pressure. A price recovery would lift revenue from unhedged gold sales; Tim Waterer, Chief Market Analyst at KCM Trade, said gold needed a convincing move above US$4,000/oz to strengthen its recovery.
Strong Cash Flow Cushions Gold Producers Against Lower Prices
Spot gold at US$3,908.49/oz was 8.3% below the US$4,262.20/oz average in the WGC’s Q3 2026 Gold Demand Trends report. If that price holds, unhedged sales would generate 8.3% less revenue per ounce than the Q3 benchmark. At unchanged costs, producers with thinner margins would suffer larger percentage profit declines.
Metals Focus data published by the WGC showed producers reduced their gold hedges by a net 16.8 metric tons in Q3, increasing exposure to gold price changes. Price hedges can cushion lower selling prices, while deferring discretionary capital spending can preserve cash.
Third quarter ETF inflows continued despite higher yields, so a Fed hike would not guarantee outflows. Valuations based on current spot require less price recovery than those assuming January’s record, but remain exposed to further declines. Producers whose cash flow and funding can withstand lower prices keep their exposure to a recovery.
Cash Flow Decides Which Gold Producers Gain From a Price Recovery
Central bank buying helped offset weaker retail demand, while an 8% decline in recycling reduced scrap supply. With gold about 30% below January’s record, unhedged producers whose valuations reflect lower prices and whose cash flow and funding can withstand further declines hold the most exposure to a recovery. A recovery would lift their revenue per ounce, with a larger percentage gain in margins if costs remain unchanged.
Analyst's Notes





Subscribe to Our Channel








Stay Informed