Fed Hold & Higher Real Yields Drive a 16% Gold Pullback, While Mining Margins Remain Elevated


Fed-driven gold weakness triggered a 16% pullback, but 17%-41% upside to institutional targets continues to support gold miners.
- Gold has corrected ~16% from its January 2026 high of $5,589/oz to ~$4,465/oz as the Fed's 3.50%-3.75% policy rate and a 30% market-implied probability of a Q1 2027 rate hike increased real yields and strengthened the US dollar, reducing demand for non-yielding gold.
- The gap between spot gold at ~$4,465/oz and institutional year-end targets of $5,243-$6,300/oz implies further upside for gold mining equities, particularly producers generating large margins at current gold prices.
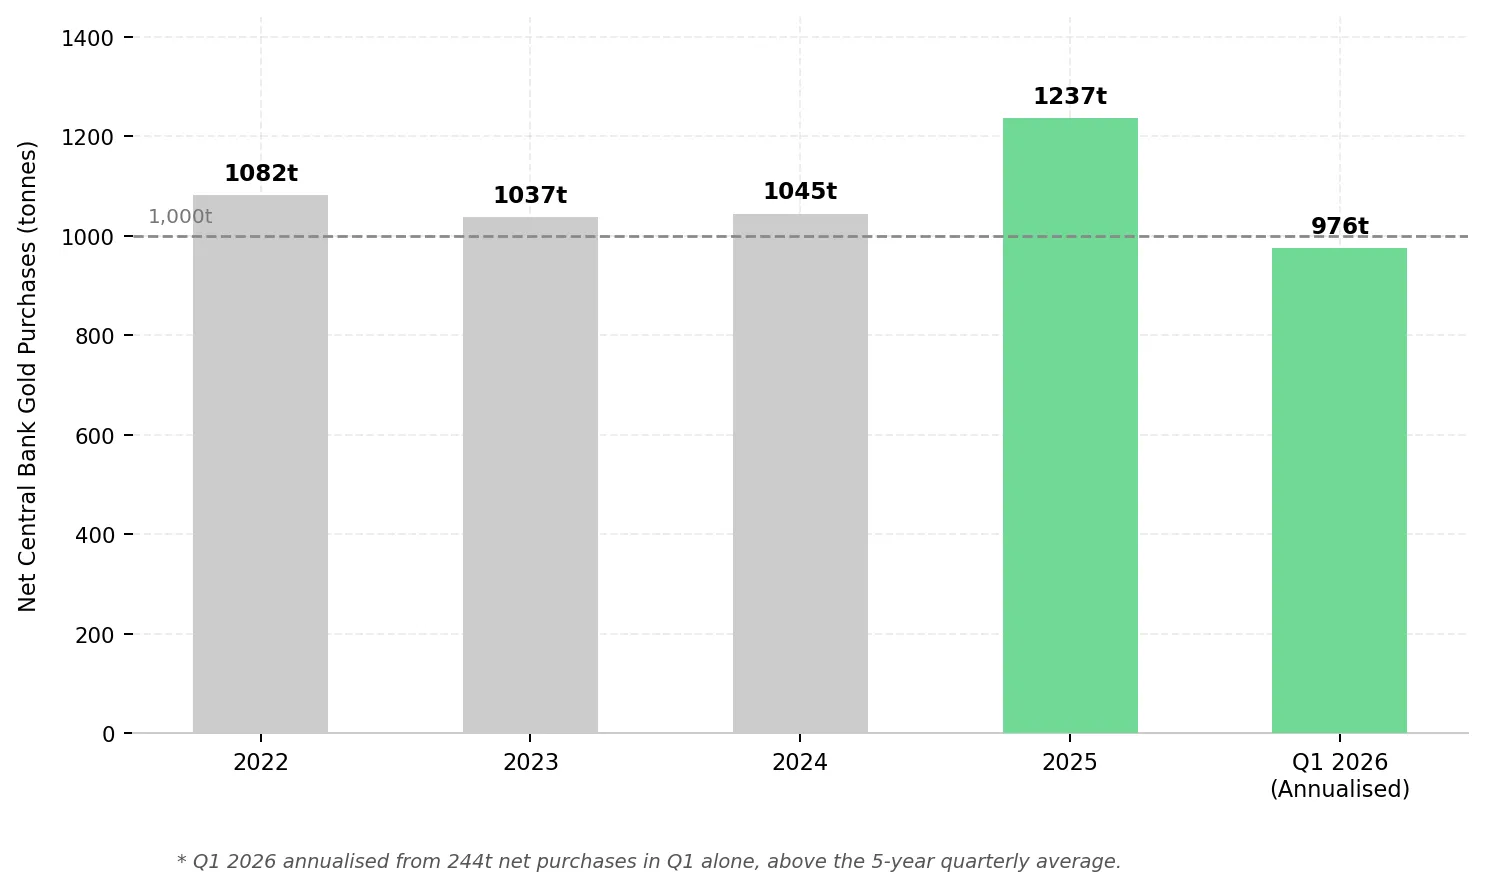
- World Gold Council data show that gold demand remains supported by 244 tonnes of central bank purchases in Q1 2026, record quarterly demand value of $193 billion, and US inflation of 3.8%.
- The correction has reduced EV/oz multiples across the gold sector, particularly among ramp-up producers reporting elevated costs before reaching planned production rates. As ounce volumes increase, fixed costs are spread across more production, lowering unit costs and supporting valuation re-ratings.
- Producers with low-cost assets, fully funded balance sheets, and near-term operational catalysts can generate strong margins at current gold prices while advancing growth projects without raising additional capital.
Fed Hold, Higher Real Yields & the Gold Price Correction
Gold has fallen from its January 28, 2026 high of $5,589/oz to approximately $4,465/oz as the Fed maintained rates at 3.50%-3.75%, 10-year US Treasury yields approached a one-year high, and a stronger US dollar reduced demand for USD-denominated gold. FOMC minutes from the April 28-29 meeting showed US inflation at 3.8% year-on-year and indicated that most policymakers do not expect rate cuts before Q3-Q4 2026. With swaps markets pricing only a 5% probability of a rate cut at the June 16-17 meeting, higher interest rates have increased the opportunity cost of holding non-yielding gold.
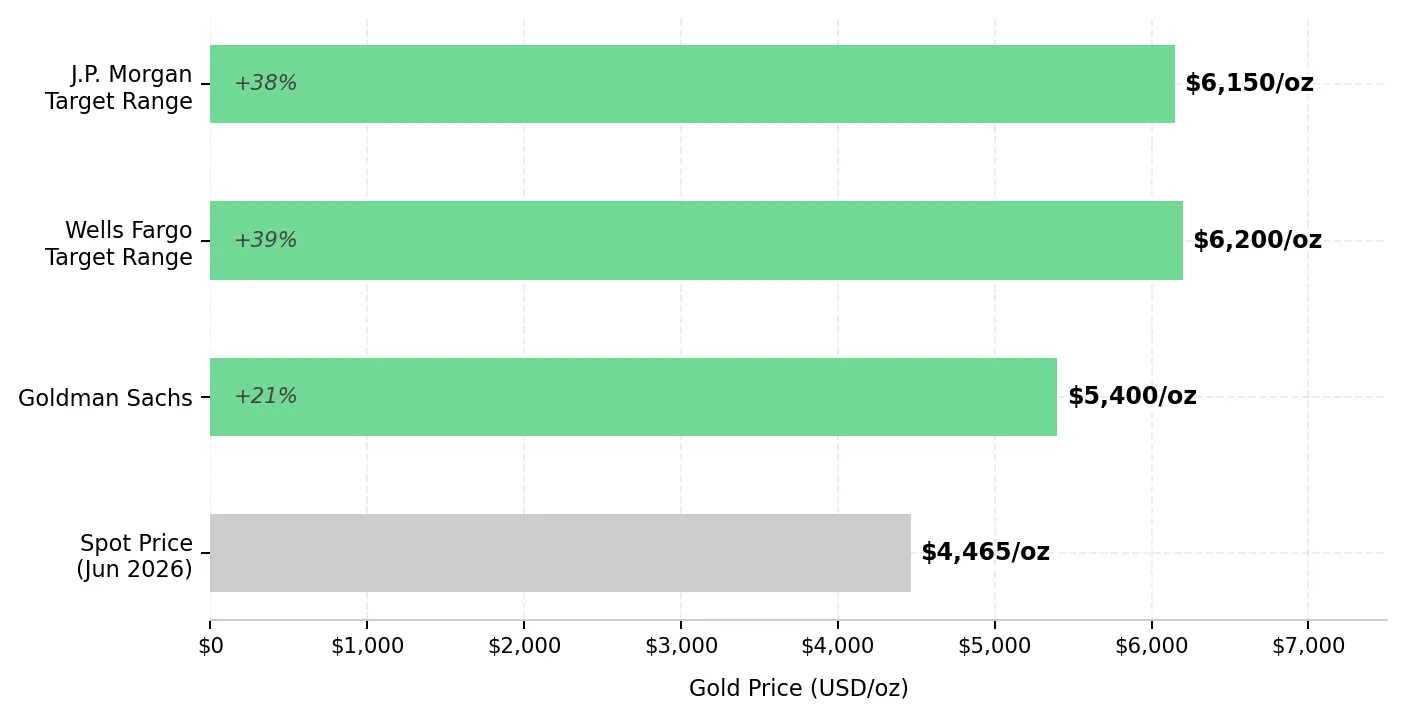
Institutional Gold Targets Remain 17%-41% Above Spot Prices
The gap between spot gold and institutional year-end price targets remains unusually wide. J.P. Morgan has set a year-end target range of $6,000-$6,300/oz, Goldman Sachs forecasts $5,400/oz, and Wells Fargo has revised its target to $6,100-$6,300/oz. Against a spot price of approximately $4,465/oz, these targets imply 17%-41% upside. If gold moves toward institutional targets, producers can expand margins and free cash flow from current levels, supporting higher equity valuations.
Real Yields & Dollar Strength Drive Gold's Correction
The June 16-17 FOMC meeting could influence gold prices because policymakers' dot plot forecasts will indicate whether Fed rate cuts are still expected in 2026. The April meeting minutes showed concern about energy-driven inflation even as employment growth slowed. April non-farm payrolls totaled 115,000, above the 62,000 consensus but below March's 185,000. If policymakers maintain their current rate forecasts, expectations for 2026 rate cuts are unlikely to change. Higher rate forecasts would likely push Treasury yields higher, increasing the opportunity cost of holding gold and adding pressure to gold prices.
May Payrolls Could Shift Rate-Cut Expectations & Gold Equity Valuations
The May non-farm payrolls report, due June 6, could influence gold prices by changing expectations for Fed rate cuts. A payrolls reading below 100,000 could increase the implied probability of a September 2026 rate cut from near-zero toward 35%-40%, lowering real yields. Lower real yields typically support gold prices, increasing producer margins and supporting higher EV/oz valuations. For producers operating with cash costs of $1,800-$2,600/oz, a gold price recovery to $4,700-$4,850 would expand free cash flow by increasing margins on each ounce sold.
Rising Costs & Limited Supply Growth Support Gold Prices
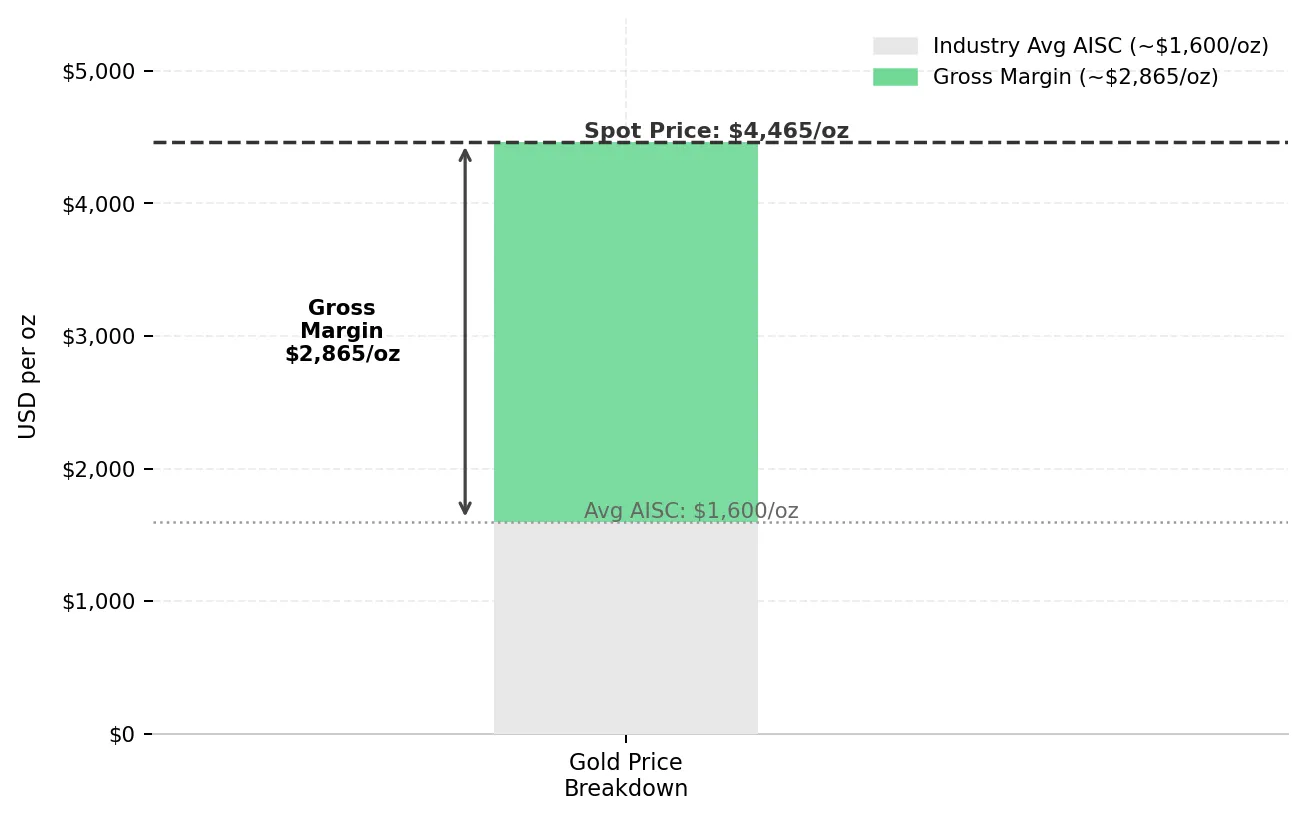
Industry-wide AISC has risen approximately 3% in recent quarters to around $1,600/oz, driven by higher energy costs, labor inflation, and lower ore grades. The World Gold Council expects limited mine supply growth in 2026 as energy shortages affect some operations, while recycling supply remains constrained by low available inventories. Producers cannot rapidly increase output when gold prices rise, while prices below roughly $3,500-$4,000/oz would significantly reduce industry margins and discourage new supply.
Heap Leach Operations Can Deliver Strong Margins at Current Gold Prices
Heap leach oxide operations typically require less capital and processing infrastructure than sulfide or refractory gold projects. By recovering gold through a simpler processing method, heap leach operations can require less upfront capital and generate cash flow sooner than sulfide or refractory projects.
Integra Resources reported a 40% operating margin at its Florida Canyon Mine in Q1 2026 at a realized gold price of $4,854/oz. Mine-site AISC was $3,310/oz, reflecting lower production volumes, higher royalty payments linked to stronger gold prices, and increased diesel costs. Higher mining rates and improved leach pad performance could reduce unit costs by spreading fixed costs across more ounces.
George Salamis, President and Chief Executive Officer of Integra Resources, explains how current investment at Florida Canyon is expected to support higher production and lower costs:
"2026 is about building capacity today at Florida Canyon to deliver more ounces, stronger cash flow, and lower costs tomorrow. Our guidance over the next two years is 80,000 to 90,000 ounces per year in 2027 and another 80,000 to 90,000 ounces in 2028."
A Fed Pivot Could Expand Margins & Cash Flow
Gold mining equities typically move more than the underlying gold price because changes in gold prices have an amplified effect on margins and cash flow. When gold prices rise, revenue per ounce increases while many operating costs remain relatively stable, causing EBITDA and free cash flow to grow faster than the gold price. This effect is strongest for producers with lower AISC and higher-grade assets, while fully funded balance sheets allow companies to advance growth projects without raising additional capital. Companies advancing production growth, cost reductions, or permitting milestones can improve valuations even if gold prices remain unchanged.
Production Growth Can Reduce Costs for Ramp-Up Gold Producers
Producers in the early stages of commercial production spread fixed costs across fewer ounces, resulting in higher per-ounce costs than they may achieve at planned production rates. West Red Lake Gold Mines reported Q1 2026 cash costs of US$2,594/oz and AISC of US$4,678/oz at the Madsen Mine, reflecting fixed costs being spread across early-stage production volumes. With approximately 60% of 2026 production scheduled for the second half of the year as additional mining areas come online, higher ounce volumes could reduce per-ounce costs by spreading fixed expenses across more production.
Balance Sheet Strength Supports Development Without Dilution
i-80 Gold's $787.5 million Q1 2026 recapitalisation reduced financing risk by providing $513.5 million in cash and removing its going-concern disclosure. The company is targeting annual production of 150,000-200,000 oz from Phase 1 beginning in 2028 and approximately 600,000 oz/year at Phase 3. Ownership of one of only two autoclave processing facilities in Nevada supports that production growth plan. Advancing that plan requires significant investment in drilling, resource expansion, and project development.
Paul Chawrun, Chief Operating Officer of i-80 Gold, explains how the company's recapitalization is funding development and resource growth across its Nevada asset portfolio:
"This is what launches i-80 into the next level. We did the equity raise last year. What this does for us is allow us to put this project together. We have in the range of $80 million for drilling alone this year and approximately $10 million allocated to Granite Creek."
Permitting Certainty Supports Gold Project Valuations
Jurisdiction influences gold equity valuations because permitting, regulatory, and sovereign risks affect project development timelines and discount rates. Assets in lower-risk jurisdictions often trade at higher EV/oz valuations because investors assign lower permitting and sovereign risk to future cash flows. Nevada and Ontario provide established mining laws, existing infrastructure, and access to North American capital markets, reducing development and financing risk. FAST-41 federal permitting reform can shorten National Environmental Policy Act (NEPA) review timelines, reducing permitting risk for US development projects.
Strong Margins Can Outweigh Broad Jurisdiction Discounts
High operating performance can outweigh broad emerging-market discounts when assessing producer valuations. Serabi Gold generated Q1 2026 post-tax profit of $21.0 million on revenue of $50.6 million, its highest quarterly profit on record, while carrying no debt. With AISC of $2,293/oz and a realized gold price of $4,926/oz, the company generated a cash margin of approximately $2,633/oz in Q1 2026.
Mike Hodgson, Chief Executive Officer of Serabi Gold, outlines how production growth, strong margins, and cash generation have strengthened the company's balance sheet in Brazil:
"We increased production from 38,000 ounces in 2024 to 44,000 ounces. We realized AISC of $1,816/oz for the year, while our average gold price was $3,451/oz. We generated approximately $30 million in cash and ended the year with $50 million on the balance sheet. EBITDA totaled about $79 million. That growth continued into Q1 as we benefited from higher gold prices, increasing our cash position to approximately $65 million by quarter-end."
The Investment Thesis for Gold
- With gold at approximately $4,465/oz and industry AISC averaging around $1,600/oz, producers are generating margins of approximately $2,865/oz. A recovery toward institutional targets of $5,243-$6,300/oz would increase margins on every ounce produced, driving further growth in cash flow and earnings.
- Institutional year-end targets remain 17%-41% above the current gold price, while central banks purchased 244 tonnes of gold in Q1 2026. Together, these data points suggest that investor and sovereign demand remain supportive of higher gold prices.
- Companies with fully funded balance sheets can advance development projects and permitting milestones without raising additional capital, reducing dilution risk and supporting future production growth.
- Producers in ramp-up phases often report elevated AISC because fixed costs are spread across lower production volumes. As ounce production increases, those costs can fall on a per-ounce basis, supporting margin expansion and higher cash flow.
- Gold producers operating under FAST-41 or in established mining districts can benefit from shorter permitting timelines and lower development risk. Reduced uncertainty increases confidence in future cash flows and can support higher EV/oz valuations.
- European institutional investors increased gold purchases during Q1 and Q2 2026. A decline in US real yields could support renewed ETF demand, adding another source of investment demand alongside continued central bank buying.
Gold has fallen from $5,589/oz to approximately $4,465/oz as higher real yields and a stronger US dollar reduced demand for non-yielding gold. Central bank purchases, above-target inflation, and institutional year-end targets that remain 17%-41% above spot prices continue to support the investment case for gold. Producers with strong margins, fully funded balance sheets, and identifiable production or permitting catalysts remain positioned to convert higher gold prices into cash flow growth.
TL;DR
Gold has fallen about 16% from its January 2026 high as higher real yields and a stronger US dollar increased the opportunity cost of holding non-yielding assets, but the broader investment case remains intact. Institutional gold targets remain 17% to 41% above spot prices, while central banks purchased 244 tonnes of gold in Q1 2026 and industry supply growth remains constrained. For gold producers, the correction has lowered valuations while margins remain strong. Companies with low-cost operations, fully funded balance sheets, production growth, and permitting catalysts are positioned to convert higher gold prices into cash flow growth if gold recovers toward institutional forecasts.
FAQs (AI-Generated)
Analyst's Notes


Subscribe to Our Channel


Stay Informed