Fed Rate Hike Expectations Pressure Gold Prices While Demand Reaches a Record 1,231 Tonnes


Gold fell on Fed rate hike fears, but record 1,231-tonne demand and central bank buying continue to support the long-term investment case.
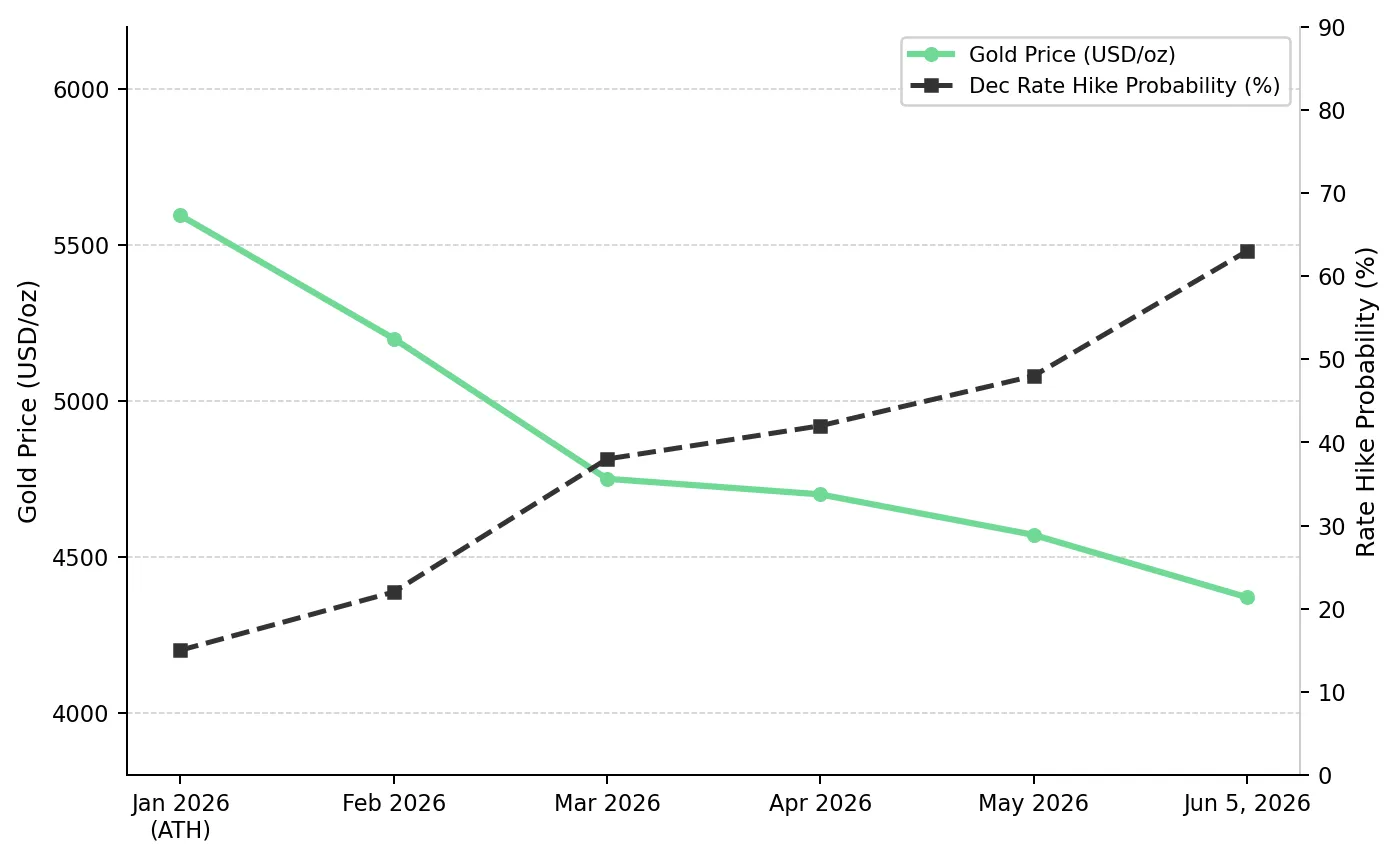
- Gold fell nearly 4% in the week ending June 5, 2026, breaching $4,370 per ounce and erasing all year-to-date gains after May nonfarm payrolls rose by 172,000 versus an 85,000 consensus forecast, lifting December rate hike probability to 63%.
- Fed Chair Kevin Warsh's first Federal Open Market Committee meeting on June 17 will end forward guidance, increasing uncertainty around future rate decisions and reducing visibility on the timing of potential rate cuts.
- While Fed rate-hike expectations are pressuring gold, the IMF has adopted its adverse scenario of 2.5% global growth and 5.4% inflation as its baseline, conditions that have historically increased demand for gold as an inflation hedge and safe-haven asset.
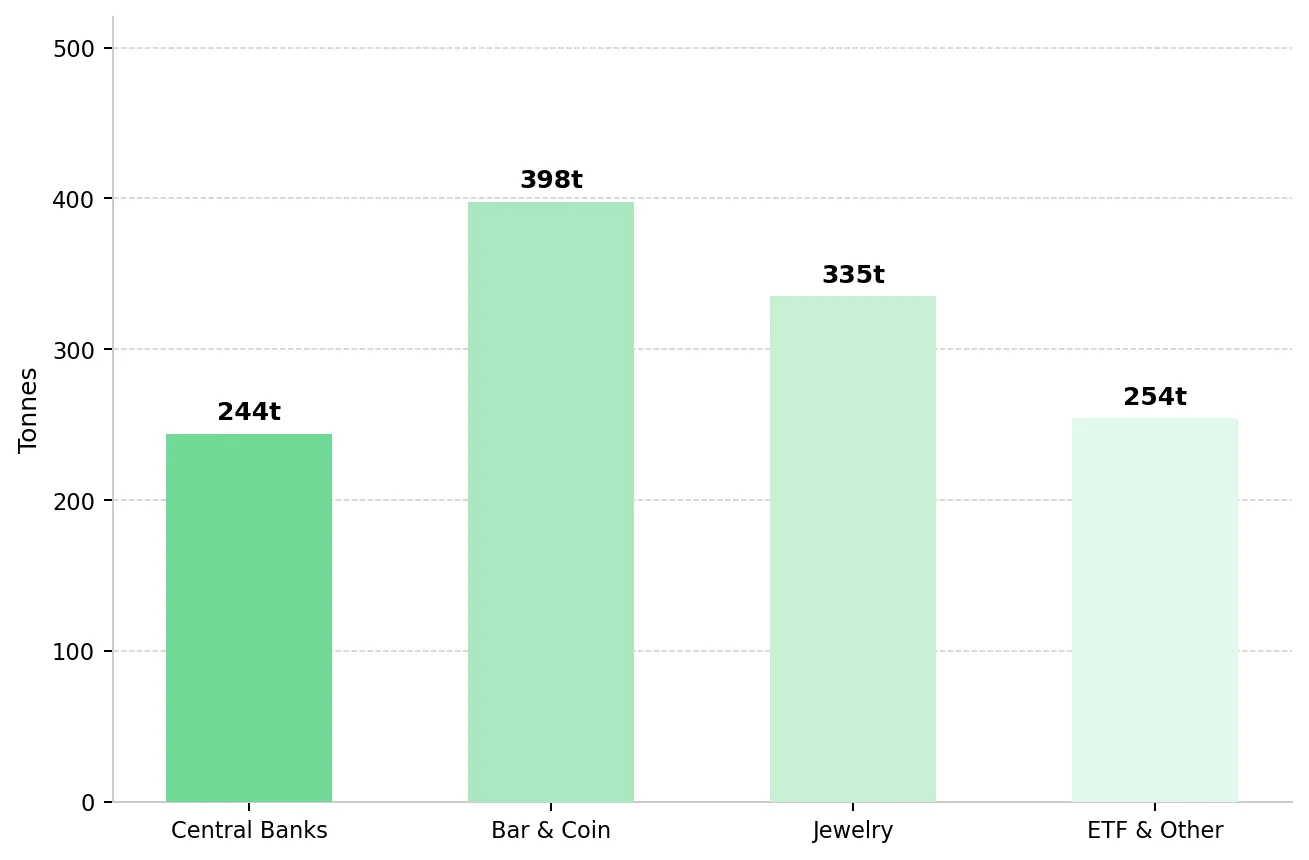
- Western ETF outflows continued in Q1 2026, but global gold demand reached a record 1,231 tonnes, including 244 tonnes of central bank net purchases.
- Development-stage and exploration-stage gold companies with low-cost, fully permitted, or resource-expanding projects offer greater leverage to a recovery in gold prices than physical gold.
Fed Rate Expectations Rise & Gold Reprices Lower
As a non-yielding asset, gold becomes less attractive when rising real yields and higher Fed rate hike expectations increase the opportunity cost of holding it. The May nonfarm payrolls report showed 172,000 jobs added versus an 85,000 consensus forecast, increasing expectations that the Fed could raise rates later this year. In the days that followed, the US Dollar Index reached its highest level since April 9, the probability of a December rate hike rose from 48% to 63%, and spot gold fell below $4,370 per ounce to its lowest level of 2026. Goldman Sachs estimates that each 25-basis-point rate cut adds about 60 tonnes of gold ETF demand within six months. Higher rate expectations therefore reduce the ETF demand that rate cuts would otherwise support.
Kevin Warsh's appointment as Fed Chair introduces a policy change that could increase uncertainty around future rate decisions. By ending forward guidance, Warsh removes advance signals about future Fed policy, making the timing of potential rate cuts harder for markets to predict. Without forward guidance, economic data are likely to have a larger impact on rate expectations, increasing short-term volatility in gold prices.
IMF Shifts to Stagflation Baseline & Reinforces Gold's Inflation-Hedge Role
On May 4, 2026, the IMF adopted its adverse scenario of 2.5% global growth and 5.4% headline inflation as its baseline forecast. IMF Managing Director Kristalina Georgieva warned that if the conflict extends into 2027 and oil remains near $125 per barrel, inflation could remain elevated for longer, supporting demand for inflation hedges such as gold.
The IMF says higher energy prices can slow economic growth, drive wage and inflation pressures, and increase corporate borrowing costs and sovereign risk premiums in emerging markets. Historically, these conditions have increased demand for gold as an inflation hedge and safe-haven asset. Higher oil prices support demand for gold as an inflation hedge but also reduce the likelihood of Fed rate cuts, limiting demand from gold ETFs. If the conflict eases, lower inflation could allow Fed rate cuts and support ETF demand. If inflation remains elevated, demand for gold as an inflation hedge could increase. In both scenarios, a key source of gold demand remains in place.
Record Gold Demand & Central Bank Buying Offset ETF Outflows
Global gold demand in 2026 is being driven by two opposing trends: strong central bank and physical buying, and weaker ETF and jewelry demand. Central bank and physical investment demand remain near record levels. ETF and jewelry demand have weakened as gold prices and rate expectations have risen. Distinguishing between these demand sources is important because they respond to different market drivers.
Central Banks & Retail Buyers Lead Physical Gold Demand
Global gold demand reached a record 1,231 tonnes in Q1 2026, according to the World Gold Council's Q1 2026 Gold Demand Trends report. Central bank net purchases totaled 244 tonnes in the quarter, up 3% year-over-year and above both the prior quarter and the five-year average. Bar and coin demand reached 397.7 tonnes, up 20% quarter-over-quarter and 50% year-over-year. Much of this demand comes from Asian and Middle Eastern investors buying gold to protect against currency depreciation, making it less sensitive to US rate expectations than ETF demand.
ETF Demand & Jewelry Consumption Decline as Gold Prices Rise
US-listed gold exchange-traded funds generated net inflows of only $0.83 billion in April, partially offsetting year-to-date outflows of roughly $1.5 billion. Jewelry demand fell 24% quarter-over-quarter globally in Q1 2026, with China down 32%, India down 18%, and the Middle East down 23%. Higher gold prices and rising rate expectations have reduced demand from ETF and jewelry buyers. If rate expectations ease, ETF and jewelry demand could recover alongside already strong central bank and physical investment demand.
Gold Correction Leaves Project Economics & Resource Growth Intact
Gold has fallen nearly 22% from its January 2026 high of approximately $5,595 per ounce but remains up 32% over the past 12 months. The pullback has reduced valuations across many development-stage gold companies even though their projects remain highly leveraged to gold prices that are still well above most economic study assumptions.
Hycroft Mining provides a clear example of how development-stage gold projects are leveraged to higher gold prices. The June 2026 S-K 1300 Technical Report estimates a post-tax NPV of $4.3 billion at base-case prices and $10.0 billion at spot prices. Every $100 per ounce increase in the gold price adds $300 million to post-tax NPV. The NPV excludes any contribution from the Brimstone and Vortex silver discoveries. Diane Garrett, President and Chief Executive Officer of Hycroft Mining Holding Corporation, explains why the Brimstone and Vortex discoveries have changed investor perceptions of the project:
"Nobody thought there was high-grade at Hycroft. And so, this is the game-changer. And this is what's attracting the attention of the market. All the money that came in and the shareholder register we have now came in for one reason. Let's develop these high-grade systems."
U.S. Gold Corp provides an example of how low operating costs can support project economics across different gold price scenarios. The March 2026 Feasibility Study for the CK Gold Project in Wyoming estimates a life-of-mine all-in sustaining cost of $1,094 per ounce of gold net of by-product credits. Luke Norman, Chairman of U.S. Gold Corp., quantifies how higher gold prices affect CK Gold's project economics:
"Even at $4,500 gold, you're all of a sudden dealing with a $1.4 billion NPV and an IRR of just under 50%. And realistically, $4,500 gold is where we're looking right now and below spot. So this project is so well leveraged to the price of gold."
Resource Growth & Project Development Advance in Parallel
Gold prices remain well above most project study assumptions, while many development-stage gold equities trade below their 2026 highs. Resource growth and project advancement determine future mine supply, and several companies are expanding resources or advancing economic studies in 2026.
Large Resources & High-Grade Discoveries Support Project Growth
Tudor Gold owns an 80% interest in the Treaty Creek Project in British Columbia's Golden Triangle, which hosts 24.9 million ounces of gold in Indicated Resources and is advancing toward a Preliminary Economic Assessment in Q3 2026. Joseph Ovsenek, President and Chief Executive Officer of Tudor Gold Corp., highlights the scale of the Treaty Creek resource base:
"We have 24.9 million ounces of gold in the indicated category, another 4 million ounces of gold in the inferred category. That is one of the biggest undeveloped gold deposits you'll find anywhere around."
New Found Gold's 100%-owned Queensway Project covers 220,000 hectares in Newfoundland and Labrador, and drilling has extended the Appleton Fault Zone Core system to more than 1,000 meters below the current resource estimate. The fully funded $44 million 2026 program will expand to six drill rigs in mid-June to support both resource conversion and new discoveries. With global gold demand reaching a record 1,231 tonnes, investors remain focused on projects capable of generating strong cash flow and adding future supply to the market. Keith Boyle, Chief Executive Officer of New Found Gold, describes the economic potential of the Queensway project:
"Queensway, in the first couple of years, will be processing 10 to over 12 grams per tonne material. We're targeting 100,000 ounces from Queensway alone at an all-in sustaining cost of $1,300 based on the PEA that we put out last year. At today's prices, you're looking at over $300 million of free cash flow."
New Discoveries Support Resource Growth & Development
Cabral Gold is targeting commercial production from its Phase 1 heap leach operation in Brazil in Q4 2026 while continuing to make discoveries outside its current resource base. The Jerimum Cima target, which is not included in the current NI 43-101 resource estimate, returned 107.6 meters at 2.5 g/t gold from 162.7 meters depth, including 3.8 meters at 59.9 g/t gold. Alan Carter, President and Chief Executive Officer of Cabral Gold Inc., explains how recent drilling is expanding mineralization beyond the current resource base:
"We recently drilled 9 and 1/2 meters at 87.4 grams per tonne of gold at Juruena Cima, which is outside the current 1.2 million ounce resource base. It is a new deposit."
While Cabral is advancing toward production, exploration-stage companies rely on resource growth to increase project scale ahead of future economic studies. Strong drill results can expand the resource base supporting future development decisions.
P2 Gold is advancing the Gabbs Project in Nevada toward a Q4 2026 feasibility study. In May 2026, the Lucky Strike Zone returned 183.0 g/t gold and 4.0% copper over 1.52 meters, the highest-grade result reported from the zone and from an area with no previous drilling. Joe Ovsenek, President and Chief Executive Officer of P2 Gold Inc., explains how resource growth could increase the scale of the Gabbs feasibility study:
"Another thing we're doing is we're looking to increase the size of our resource base that will go into that feasibility study. Our target is 5 million ounces of gold equivalent."
Geopolitical Risk Elevates the Importance of Stable Mining Jurisdictions
Geopolitical tensions and supply-chain security concerns have increased investor focus on gold projects in stable mining jurisdictions, where established permitting pathways and lower political risk can reduce development and operating uncertainties. South Australia's Nakara Arc is one such jurisdiction, and Cobra Resources' Manna Hill Project continues to advance there, with the 2026 RC drill campaign at Blue Rose extending mineralization below previously drilled areas.
The Investment Thesis for Gold
- The current gold price correction reflects higher Fed rate expectations, while record Q1 2026 gold demand of 1,231 tonnes and central bank purchases of 244 tonnes indicate continued underlying demand.
- The IMF's adoption of a baseline forecast of 2.5% global growth and 5.4% inflation supports demand for gold as both an inflation hedge and safe-haven asset.
- Developers with completed or near-complete economic studies can provide greater upside to rising gold prices because higher gold prices increase project net present values and expected cash flows.
- Developers and explorers can create value through resource growth and project advancement, even when higher rate expectations weigh on gold prices.
- Projects in Wyoming, Nevada, British Columbia, Newfoundland and Labrador, and South Australia benefit from established mining regulations, which can reduce permitting and development risk.
- Gold-copper developers provide exposure to both gold and copper prices, reducing reliance on a single commodity and adding potential upside from copper demand growth.
- Feasibility-stage projects with low operating costs and by-product credits can remain profitable at gold prices well below current spot levels, providing a buffer against higher operating costs.
The selloff in gold and gold equities during the week of June 1-8, 2026 was driven by higher Fed rate expectations after May nonfarm payrolls rose by 172,000 versus an 85,000 consensus forecast. However, higher rate expectations do not change the longer-term drivers of gold demand, including central bank buying and the IMF's baseline forecast of 2.5% global growth and 5.4% inflation.
Central bank demand remains strong, and Goldman Sachs ($5,400/oz), JPMorgan ($6,300/oz), and UBS ($6,200/oz) have maintained their gold price targets despite the recent correction. The May Consumer Price Index release and the June 17 Federal Open Market Committee meeting could influence expectations for future Fed policy. However, these events are unlikely to affect central bank demand or the IMF's baseline forecast of slower growth and higher inflation.
TL;DR
Gold declined after stronger-than-expected US employment data increased expectations for future Fed rate hikes, raising real yields and weighing on ETF demand. Despite the correction, the broader investment case remains supported by record global gold demand of 1,231 tonnes in Q1 2026, including 244 tonnes of central bank purchases, and the IMF's baseline forecast of 2.5% global growth and 5.4% inflation. While higher rates have created short-term pressure, development-stage and exploration-stage companies continue advancing projects, expanding resources, and improving project economics. Stable mining jurisdictions, resource growth, and low-cost development projects remain important themes for investors seeking leverage to a potential recovery in gold prices.
FAQs (AI-Generated)
Analyst's Notes


Subscribe to Our Channel


Stay Informed