
Gold Equities After the Rally: A Practical Guide for Investors


Bullion hedges, producers pay cash and developers carry build risk, as dilution and realistic odds cut a 44% headline developer return to 12% to 20% a year.
- Gold equities divide into three distinct exposures: bullion, producers and developers, and each behaves differently when markets fall.
- Producer cash flow is the most durable part of the gold equity story, with record margins funding dividends and share buybacks.
- Deep discounts to net asset value among developers reflect the market's estimate of the odds that a mine will be built, not a pricing error by default.
- Low valuations make financing more expensive, so dilution often absorbs much of the gain promised by simple valuation-recovery arithmetic.
- Returns weighted across realistic outcomes run well below best-case returns, and the probabilities matter more than the headline multiple.
Record Gold Prices Make Cheap Developers Look Like Easy Money
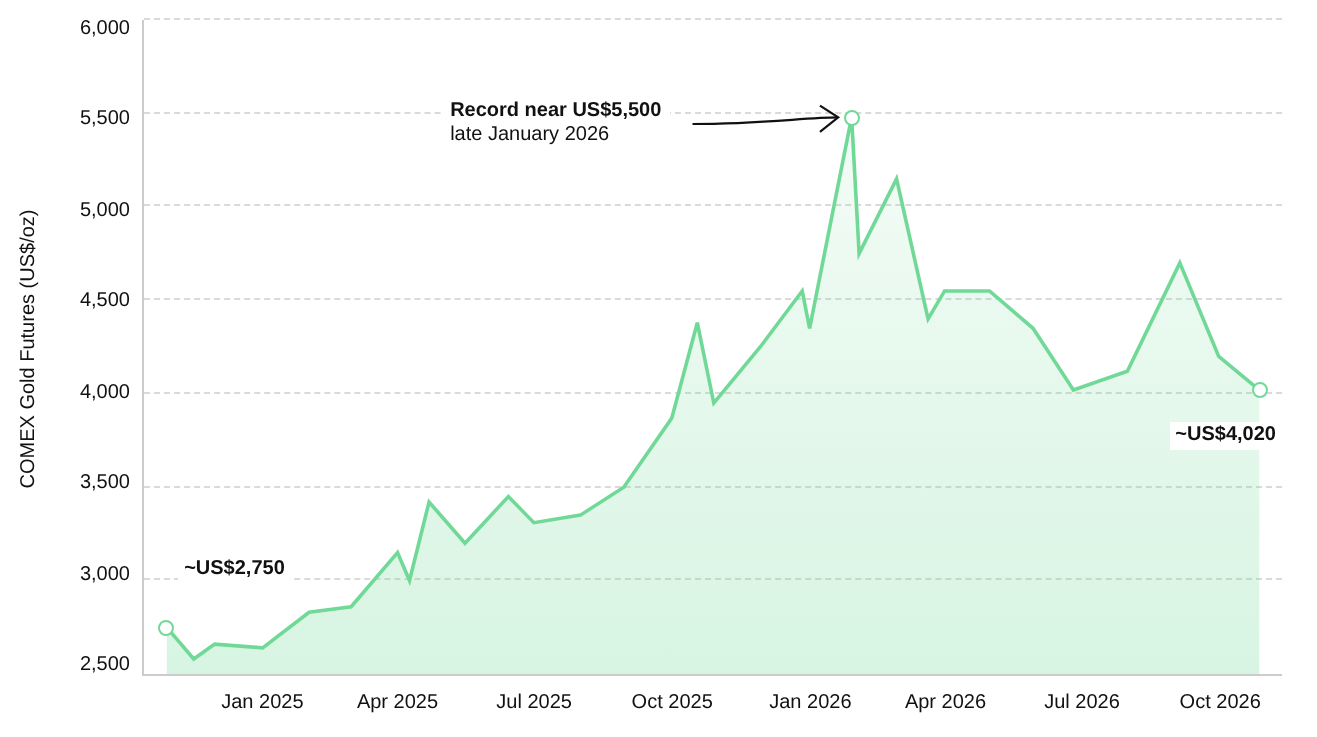
Gold has held above $4,000 an ounce, closing near $4,166 in mid-October. Producers are earning record margins and returning cash to shareholders, while many mine developers trade at a fraction of their projects' value. The gap has produced a popular piece of arithmetic: a developer bought at 0.1x net asset value (NAV) becomes a producer valued at 0.4x within three years and returns roughly 44% a year.
The arithmetic holds, but only when every step goes right. Permits arrive on time, financing closes on reasonable terms, construction stays on budget, and the gold price stays high. Each condition carries its own probability, and the headline return assumes all of them succeed.
The question matters now because the gap between the metal and the miners has widened amid elevated uncertainty, from US midterm elections to geopolitical conflict to stretched technology valuations. The popular argument holds up or fails on three questions: which type of gold exposure delivers which result, which checks separate strong developers from weak ones, and what return remains once realistic odds are applied.
Producer Cash Flow and Takeover Demand Support the Bullish Argument
The gap between the metal and the miners is real. With gold near $4,166 an ounce, many good-quality developers in stable jurisdictions trade at 0.3x to 0.5x NAV, and some well below.
Producers are generating genuine cash. At current prices, well-run miners report margins of roughly 45% to 55% and free cash flow yields of 5% to 10%. Many now pay dividends of 2% to 5% and buy back shares as well. The long-term drivers for the gold price also carry weight: rising government debt, steady central bank buying and a shortage of new mines all support the price.
Takeovers form the most underrated part of the argument. Cash-rich producers need new ounces to replace depleted reserves, and buying a developer is often cheaper than discovering a deposit. At current valuations, analysts estimate an acquirer can pay a premium of 40% to 50% and still complete a deal that adds value per share. A developer therefore, does not need to build its own mine for shareholders to be rewarded.
NAVs may also be understated. Many technical studies still assume long-term gold prices well below spot. If long-term price assumptions rise, the true discount is larger than the reported one.
Bullion, Producers and Developers Are Three Different Bets
The word "gold" covers three distinct investments, and most disappointments come from owning one while expecting the behaviour of another.
Physical gold and bullion funds are a direct exposure to the gold price. They usually hold up best in a market panic, and their main risk is a decline after a long rally. Producers offer leveraged exposure to the gold price, with results also depending on management's cost discipline. Producer shares often fall alongside the wider stock market at first, and they remain exposed to cost inflation, operating problems, and any pullback in gold, which can squeeze margins.
Developers, who are still building their first mine, layer the risks of permitting, financing and construction on top of the same price leverage. They usually fall hardest and recover the slowest in a sell-off, and their main risks are delays, dilution, and a mine that never gets built.
Where the motive is protection, concern over elections, war or an equity bubble points to bullion as the hedge. Producers and developers are growth exposures to gold, and both can fall sharply in precisely the kind of panic driving demand for protection. The job the capital is meant to do, whether hedge, income or high-risk upside, decides which instrument fits.
Five Checks Separate a Real Discount From a Fair Price
Developers offer the largest upside and the largest risk in the sector. A low price-to-NAV (P/NAV) ratio is a starting point rather than a conclusion, and five checks determine whether a discount reflects genuine value or an accurate reading of the odds.
The Gold Price Behind the NAV
A NAV calculated at $2,500 per ounce describes a different asset from one calculated at $4,000 per ounce. The price assumption sits in the latest technical study, and recalculating at a credible long-term price reveals how much of the apparent discount is real. A weak result is a NAV built on a price well away from any defensible long-term level.
Construction Cost Against Market Value
The estimated construction cost, or capex, compared with the market capitalization shows the scale of the financing task. Where capex runs several times the market value, the split between debt, streams, royalties and new equity decides how much value reaches existing shareholders. Capex estimates also tend to drift higher, often by 20% to 30% within two years.
Dilution Consistent With the Valuation
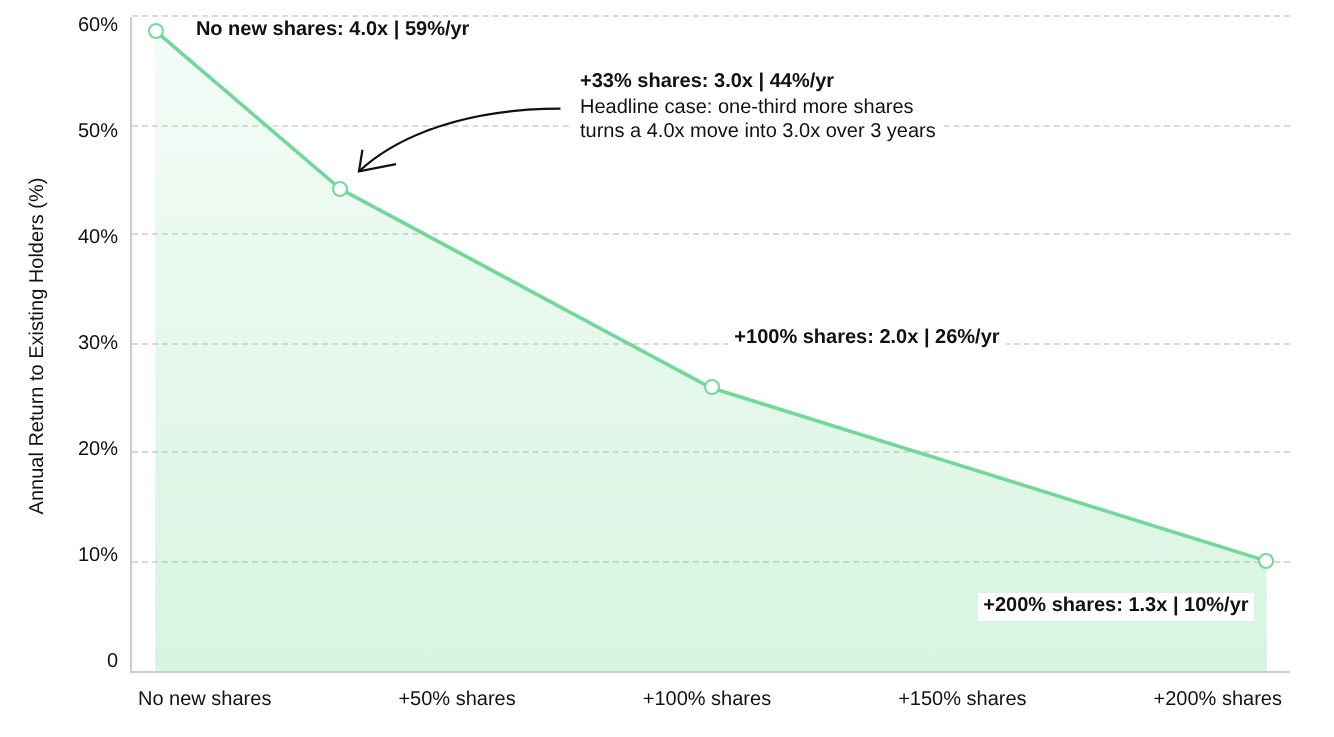
Dilution is the hidden flaw in the simple arithmetic. A company trading at 0.1x NAV must issue far more shares to raise a given sum than one trading at 0.4x. The same cheapness which attracts buyers makes financing expensive. A low dilution usually requires the share price to recover before the main financing, which reverses the order assumed by the headline return.
A Timeline With Room to Slip
Feasibility studies, environmental baseline work, permits, financing and construction all sit between a developer and first production. A stated production date with no allowance for slippage is a best case rather than a forecast. Each additional year sharply reduces the annual return, even when the eventual outcome is unchanged.
Jurisdiction Risk Beyond the Country Name
A stable country is necessary but not sufficient. The local permitting record, water and land access, and community support decide whether a project advances on schedule. Proximity to an existing producer's mill or infrastructure adds value because it raises the likelihood of takeover interest.
Weighting for Realistic Odds Cuts the Headline Return by More Than Half
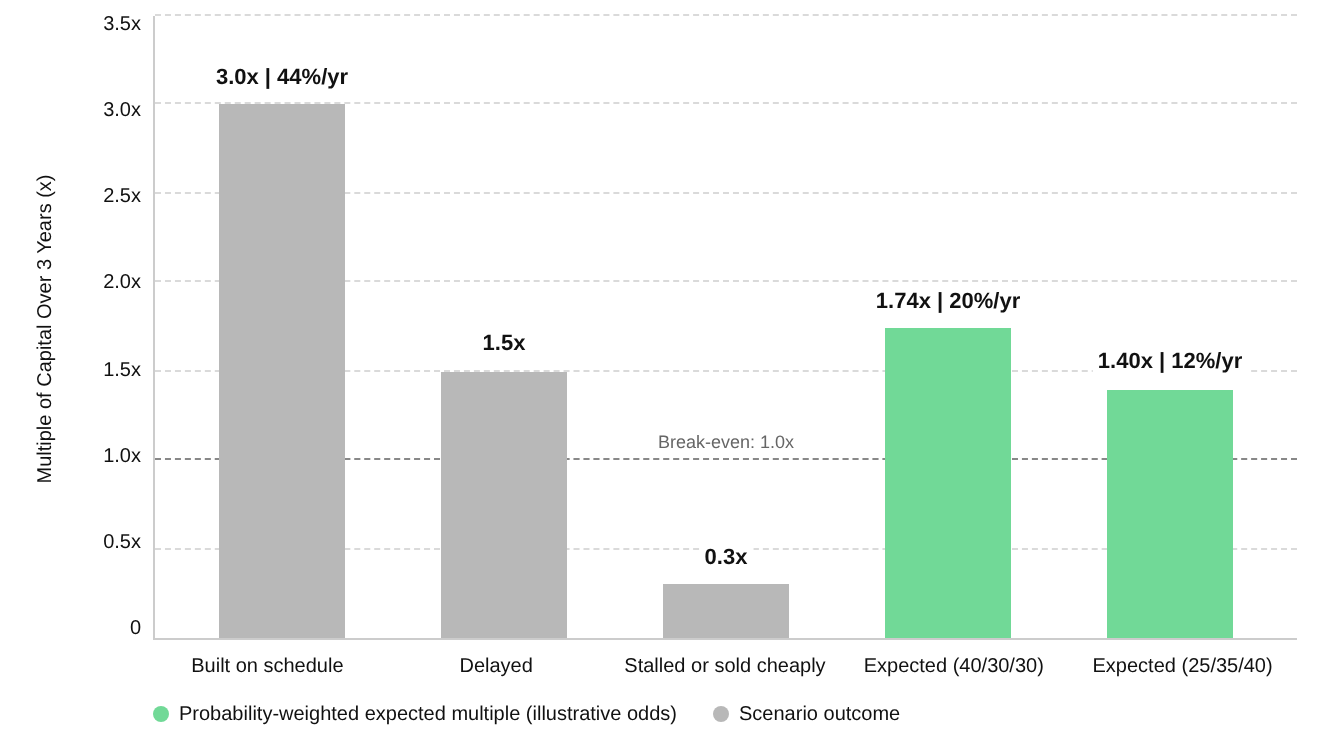
Probability-Weighted Multiples Sit Well Below the On-Time Case. Source: Crux Investor Research. Crux Investor Analysis.
The arithmetic works in three steps. First, a move from 0.1x to 0.4x NAV is a fourfold gain. Second, if shares in issue increase by one-third during financing, existing shareholders retain about 75% of the gain (1 ÷ 1.33), yielding a 3.0x multiple. Third, 3.0x over three years equals an annual return of about 44%, since the cube root of 3.0 is roughly 1.44. The figure describes a mine built on time.
Real outcomes spread across a range. Over roughly three years, three illustrative scenarios apply:
- Built on schedule with modest dilution: about 3.0x.
- Delayed, with heavier dilution: about 1.5x.
- Stalled, failed or sold cheaply: about 0.3x.
With optimistic illustrative probabilities of 40%, 30% and 30%, the expected multiple is (0.40 × 3.0) + (0.30 × 1.5) + (0.30 × 0.3) = 1.74x, or about 20% a year. With more skeptical illustrative probabilities of 25%, 35% and 40%, the expected multiple is (0.25 × 3.0) + (0.35 × 1.5) + (0.40 × 0.3) = 1.40x, or about 12% a year.
The return depends far more on the probabilities than on the headline multiple. A 0.1x valuation is the market's own estimate of the odds, and the discount closes only when a study, permit or financing milestone shifts the odds in a way the share price has not yet reflected.
Portfolio Structure Decides Whether Developer Risk Is Survivable
Producers with low all-in costs, strong balance sheets and a record of returning cash rather than overspending on growth generally form the steadier core of sector exposure, with bullion serving as the genuine hedge.
Individual developer outcomes are close to all-or-nothing, so a basket of five to ten developers across stages and jurisdictions allows winners and takeovers to offset failures. A sector fund achieves a similar spread more simply. Developer exposure sized so a total loss is survivable keeps a single failed project from disrupting wider financial plans, and staggered entry over several months reduces the cost of a badly timed purchase in a volatile, illiquid sector.
Milestones offer a clearer signal for review than share price moves: a missed study, permit or financing date carries more information than a weekly price swing. Leverage also runs both ways. Record margins come from record gold prices, and a meaningful pullback would squeeze margins, dividends and developer NAVs at the same time.
Investment Thesis for Gold Equities
- Producer cash flow at current gold prices is the most dependable return in the sector, and producers with low all-in costs and disciplined capital returns carry the least downside if gold pulls back.
- Developer discounts are driven more by milestones than by the gold price alone, so value sits with projects where a study, permit, or financing decision is near and not yet reflected in the share price.
- Developers trading at deep discounts, with capex several times market value, face expensive financing, and much of the apparent upside accrues to new shareholders.
- Projects near an existing producer’s mill or infrastructure include a second exit via takeover, reducing dependence on a self-funded build.
- NAVs built on gold prices well below spot understate the true discount, so projects with conservative price assumptions hold more value than the headline P/NAV shows.
- Realistic expected returns of roughly 12% to 20% a year, rather than 44%, set the bar that developers have to clear.
- A meaningful gold pullback would hit margins, dividends and developer NAVs together, leaving bullion as the part of gold exposure best placed to hold up in a market panic.
Record gold prices have opened a real gap between the metal and the miners, and the gap rewards discipline more than enthusiasm. Results here depend less on the headline multiple than on the underlying odds: the gold price within each NAV, the dilution needed to finance construction, and the time between study and first gold pour. Producer cash flow anchors the sector, while developer upside belongs in diversified positions sized to survive failure. Milestones, rather than cheapness, decide which discounts close.
Analyst's Notes





Subscribe to Our Channel








Stay Informed