

Rising Mine Costs Shift Salt Equity Returns Toward Cost-Curve Position as Prices Compound 4.2% Annually


Rising mine costs are making cost-curve position more important than salt prices, favouring low-cost producers and developers despite financing risks.
- Legacy North American salt mines are aging and moving deeper underground, raising the cost of new supply and increasing the value of low-cost projects.
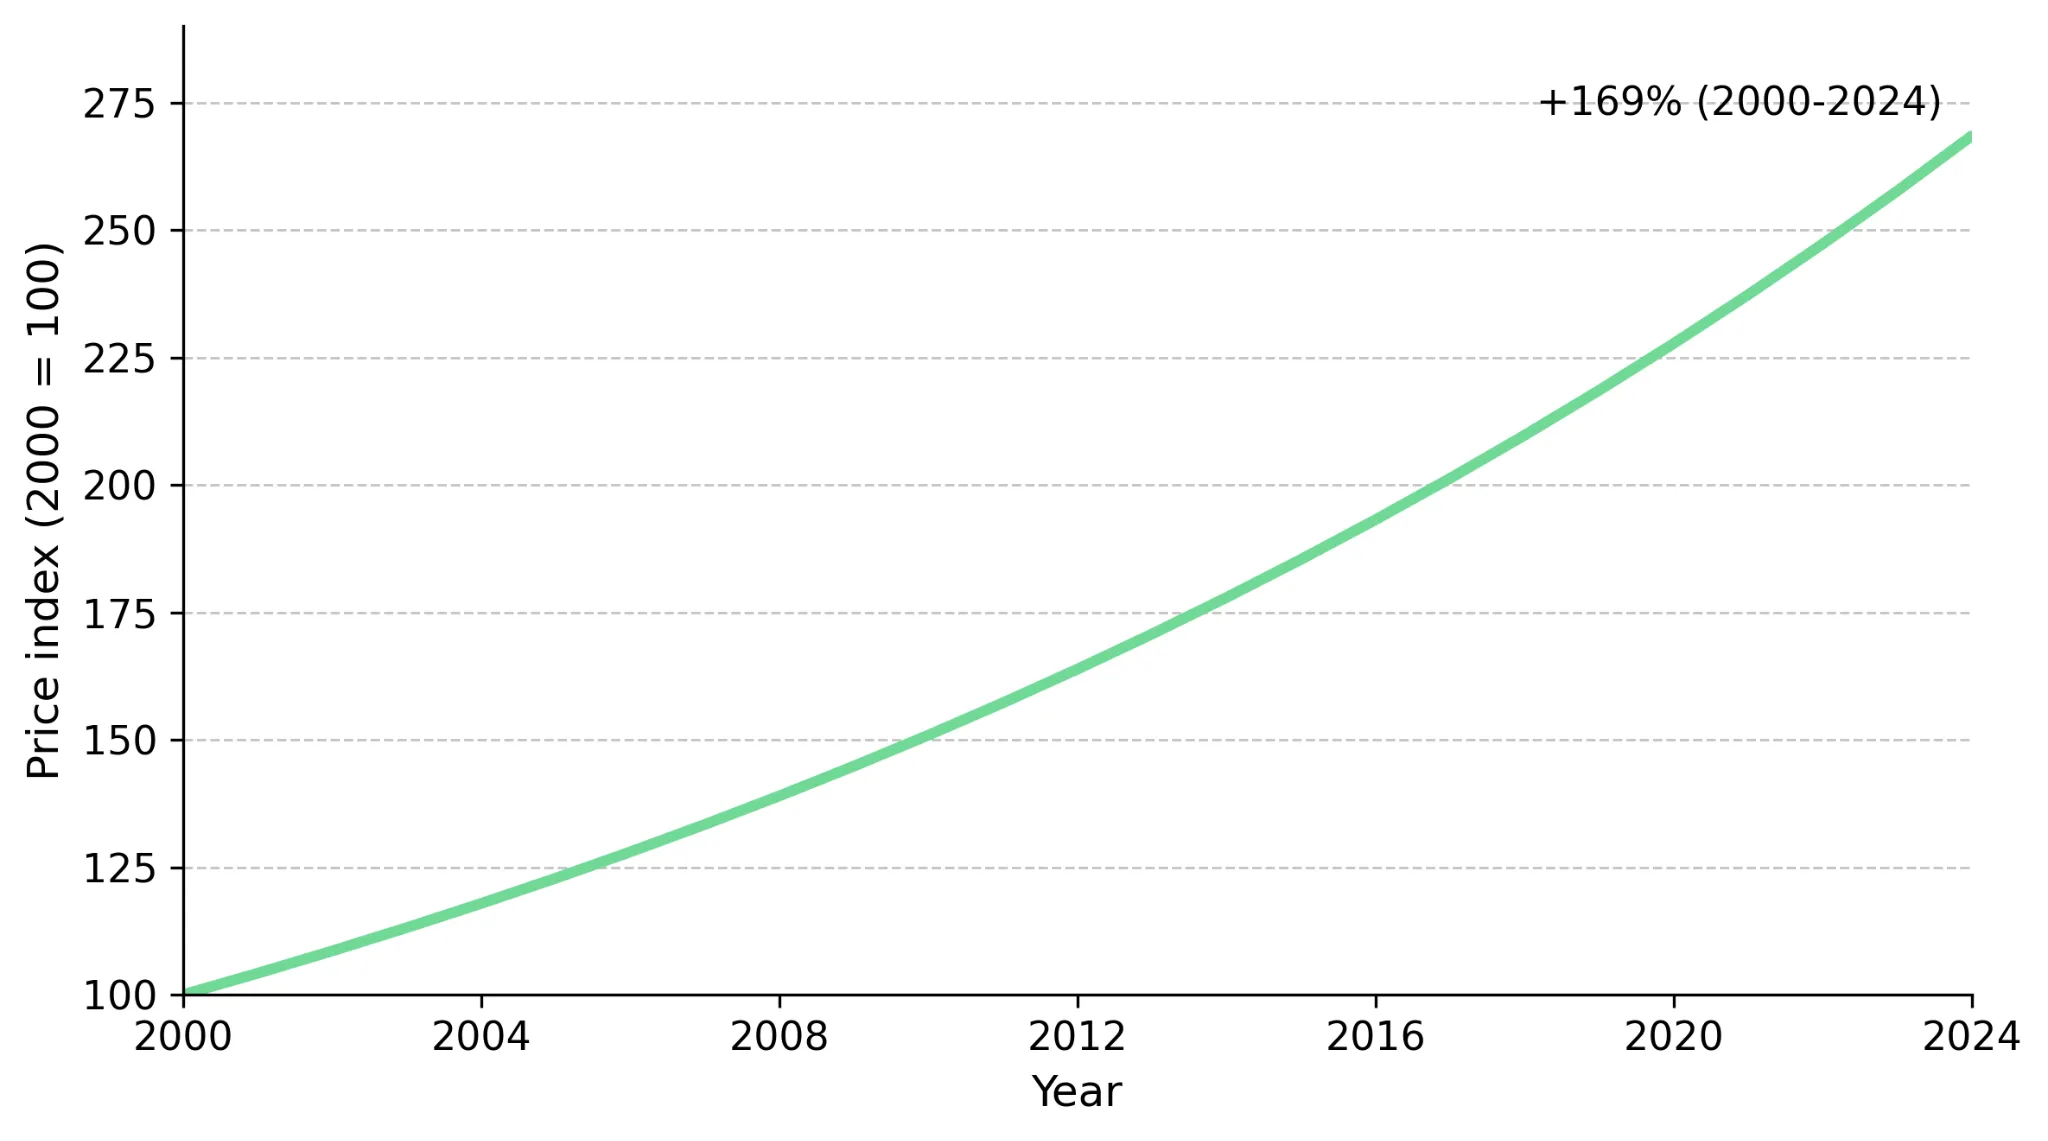
- Average US rock salt prices increased at a 4.2% compound annual rate from 2000 to 2024, according to the United States Geological Survey, but rising energy, labour, and mining costs have limited margin expansion for higher-cost producers.
- Rising costs at ageing brownfield mines are increasing the margin advantage of low-cost greenfield developers.
- Investors are increasingly distinguishing between legacy producers confronting cost inflation and developers pursuing new, potentially lower-cost sources of supply.
- In salt equities, cost-curve position is becoming more important than price forecasts as rising mine costs separate low-cost projects from higher-cost production, while development-stage companies remain exposed to financing, dilution, and construction risk.
Rising Mine Costs Shift Focus to Salt Cost-Curve Position
Salt receives less investor attention than most mined commodities because it lacks a liquid futures market and large price swings. Salt is high-volume, low-value, and purchased for essential uses, which has historically made it a price-taking business with limited speculative interest. Investors have traditionally focused on salt prices when assessing the sector. Demand remains stable, but rising mine costs are increasing the cost of new supply, making cost-curve position more important than price forecasts in valuing salt equities.
Inelastic Demand Makes Cost-Curve Position the Key Profit Driver
A cost curve ranks producers from lowest to highest cost per tonne. The key input is all-in sustaining cost, or AISC, which includes operating costs and sustaining capital required to maintain production. AISC provides a useful estimate of a mine's break-even cost. Cost-curve position matters in salt because demand is relatively inelastic. When lower prices do not increase demand, companies with high costs cannot offset weaker margins through volume growth. Low-cost operators retain margins when prices soften, while high-cost operators see margins compress first.
Salt Prices Rose 4.2% Annually, but Cost Inflation Limited Margin Growth
Average US rock salt prices increased at a roughly 4.2% compound annual rate between 2000 and 2024, according to the United States Geological Survey. The multi-decade price increase supports producer revenues and underpins the investment case for the sector. Input costs have also increased, limiting the benefit of higher salt prices.
Higher energy, labour, haulage, and mining costs have prevented two decades of price growth from translating into uniformly higher margins. Rising costs are increasing the performance gap between low-cost and high-cost producers.
Salt Market Structure Makes Cost Position More Important Than Price Forecasts
Salt differs from gold, copper, and oil because it lacks a liquid market that allows continuous price discovery. Salt has no liquid futures market, exchange-cleared spot benchmark, or widely followed daily price index. Demand is driven by road de-icing and industrial processes rather than investor sentiment, while supply is concentrated in a small number of large mines. As a result, forecasting salt prices offers less insight than identifying producers with durable cost advantages.
Municipal De-Icing Demand Supports Stable Salt Consumption
Inelastic demand means purchase volumes change little when prices rise or fall. In salt, winter de-icing and chlor-alkali production account for much of this inelastic demand. Winter de-icing demand comes from municipalities and provincial governments that must maintain road safety and limit liability risk. Chlor-alkali production also supports demand because salt is the key feedstock for chlorine and caustic soda used in PVC, water treatment, and pharmaceuticals. Because many customers must purchase salt regardless of price, producer cash flows are more defensive than those of most resource businesses. Atlas Salt's investment case depends on converting this non-discretionary demand into long-term sales contracts for future production.
Nolan Peterson, Chief Executive Officer of Atlas Salt, explains how municipal road-safety obligations support recurring salt demand regardless of economic conditions:
"The primary customer for our salt is cities and governments, and they are, in many cases, legally obligated to purchase salt to de-ice roads for liability reasons. This is kind of the best customer anybody could ever ask for, that they're forced to buy your product."
No Published Salt Cost Curve Increases the Value of Company-Level Analysis
Unlike copper, salt has no widely published industry cost curve. Investors must estimate cost-curve position from disclosed AISC, deposit depth, logistics, and sustaining capital requirements. The absence of a published cost curve can create information advantages for investors willing to perform company-level cost analysis. Limited disclosure can lead investors to misjudge a company's cost position and overstate its competitive advantage. Any cost-curve ranking in salt should be treated as analyst interpretation rather than a verified industry benchmark.
Brownfield Depletion Raises Costs Across Established Salt Producers
Rising costs at incumbent producers indicate that the industry's cost floor is increasing. Established producers operate brownfield mines, where costs increase as ore is depleted and mining extends deeper underground. Greater depth increases hoisting, ventilation, and underground haulage costs while raising sustaining capital requirements per tonne. The Goderich mine in Ontario, the world's largest underground salt mine, operates at roughly 600 metres below surface, illustrating how mature mines can face higher costs as mining advances. Cost pressure reported by the largest Western listed salt producer suggests these challenges extend beyond a single operation.
Compass Minerals Data Point to Rising Costs at Mature Salt Mines
Compass Minerals, the largest listed Western salt pure-play, reported in fiscal Q2 2026 that salt segment pricing increased about 10% year over year despite lower de-icing volumes, indicating producers can maintain pricing during weaker demand periods. The company reported higher per-unit production and distribution costs and said targeted mining efficiency gains had not yet been achieved.
Brownfield depletion increases mining costs as operations move deeper and require more sustaining capital. Unless automation or mine planning reduces costs, ageing brownfield mines are likely to face rising unit costs, increasing the margin advantage of low-cost greenfield projects.
Greenfield Salt Projects Offer a Potential Cost Advantage Over Brownfield Mines
As incumbent mine costs rise, new supply can enter the market at a lower cost position. A greenfield project built on a shallow, high-purity deposit can operate at lower cost than an ageing mine that must extend deeper to access ore. This cost advantage can allow a development-stage company to compete with established producers if it secures financing and reaches production.
Shallow Deposit Depth Reduces Capital Requirements at Atlas Salt
Atlas Salt, a pre-construction and pre-revenue developer, provides an example of how new supply could enter the market at a lower cost position. Its deposit sits at roughly 180 metres, versus about 600 metres at Goderich, and grades approximately 95.9% sodium chloride. The shallow depth allows decline access rather than a vertical shaft, reducing initial construction capital requirements. The company has completed a feasibility study and received environmental assessment clearance but has not yet approved construction, so it remains a development-stage company.
Financing Risk Remains the Key Variable in Atlas Salt's Project Valuation
Atlas Salt's feasibility study models an AISC of about US$34.90 per tonne, an after-tax NPV of roughly US$920 million at an 8% discount rate, an after-tax IRR of about 21.3%, and a payback period of roughly 4.2 years. At salt prices between roughly US$73.50 and US$89.84 per tonne, the modelled after-tax NPV ranges from about US$500 million to US$1.5 billion, making project value highly sensitive to salt-price assumptions. The primary risk is project financing. Pre-production capital expenditure of about US$589 million exceeds an enterprise value of roughly US$138.5 million, and projected operating costs remain unproven until financing is secured and the project is built. Failure to secure financing could result in shareholder dilution or capital loss.
Key Risks to the Salt Cost-Curve Investment Case
The cost-curve thesis depends on demand remaining stable and incumbent costs continuing to rise. A sustained downturn in chlor-alkali and PVC demand, potentially driven by weaker Chinese industrial activity, would weaken the inelastic-demand characteristics that support salt producer revenues. Consecutive mild North American winters could reduce de-icing volumes and compress producer margins. Rising energy, steel, and labour costs could increase projected AISC for new projects before production begins, reducing their cost advantage over existing operations.
If a developer cannot secure project financing, or can do so only on highly dilutive terms, the equity case may fail regardless of asset quality. Successful cost reductions by incumbent producers could narrow the cost gap with greenfield projects and reduce the margin advantage of new supply. The clearest falsifier would be declining mine-level costs while salt prices remain flat. In that scenario, current margin pressure would appear temporary, weakening the case for assigning a valuation premium to low-cost producers.
The Investment Thesis for Salt
- Salt offers a defensive revenue base because demand for de-icing and industrial uses supports relatively stable cash flows across economic cycles.
- Average US rock salt prices increased at a roughly 4.2% compound annual rate between 2000 and 2024, providing a favourable backdrop for producers with competitive cost positions.
- Average US rock salt prices increased at a roughly 4.2% compound annual rate between 2000 and 2024, supporting margins for producers with competitive cost positions.
- Greenfield developers with shallow deposits and low capital requirements can target lower-cost production than incumbent mines, though financing and construction risks remain until production begins.
- In a market without a published cost curve, company disclosures on costs, mine depth, and capital requirements may provide more insight than salt-price trends alone.
- Position sizing should reflect that development-stage and exploration-stage companies face financing, dilution, and execution risks before reaching production.
For most of the last twenty-five years, rising salt prices supported revenues and margins across the sector. Rising mine costs are making cost-curve positions more important than salt-price forecasts in identifying potential equity winners. Compass Minerals has reported cost pressure at deep, mature mines, while Atlas Salt is advancing a project designed around lower projected operating costs. Because no published industry cost curve exists, investors must assess cost position from company disclosures rather than rely solely on commodity-price trends.
TL;DR
Average US rock salt prices increased at a 4.2% annual rate from 2000 to 2024, but rising energy, labour, haulage, and mining costs are increasingly determining which companies create value. As mature North American salt mines age and move deeper underground, costs are rising for incumbent producers, while shallow greenfield projects may offer lower-cost production. The key investment question is no longer where salt prices are headed, but which companies occupy the strongest position on the cost curve. Low-cost operators may retain margins as industry costs rise, although development-stage projects remain exposed to financing, dilution, and construction risk.
FAQs (AI-generated)
Analyst's Notes


Subscribe to Our Channel


Stay Informed


