US 4.5% Inflation & Fed Rate-Cut Expectations Support Gold Developer Re-Ratings


Kevin Warsh's trimmed mean PCE preference and US stagflation create a defined rate-cut trigger that could re-rate development-stage gold equities in 2026.
- US Q1 2026 GDP grew at a 2.0% annualized rate while the PCE deflator rose 4.5%, creating a stagflation backdrop in which both rate cuts and further tightening carry economic risks. With inflation above policy rates, real cash returns remain negative, reducing the opportunity cost of holding gold.
- Warsh’s preference for the Dallas Fed’s trimmed mean PCE at 2.3%, versus official core PCE at 3.0%, narrows the inflation signal by 70 basis points and increases the probability of rate cuts at the June 16-17 FOMC meeting.
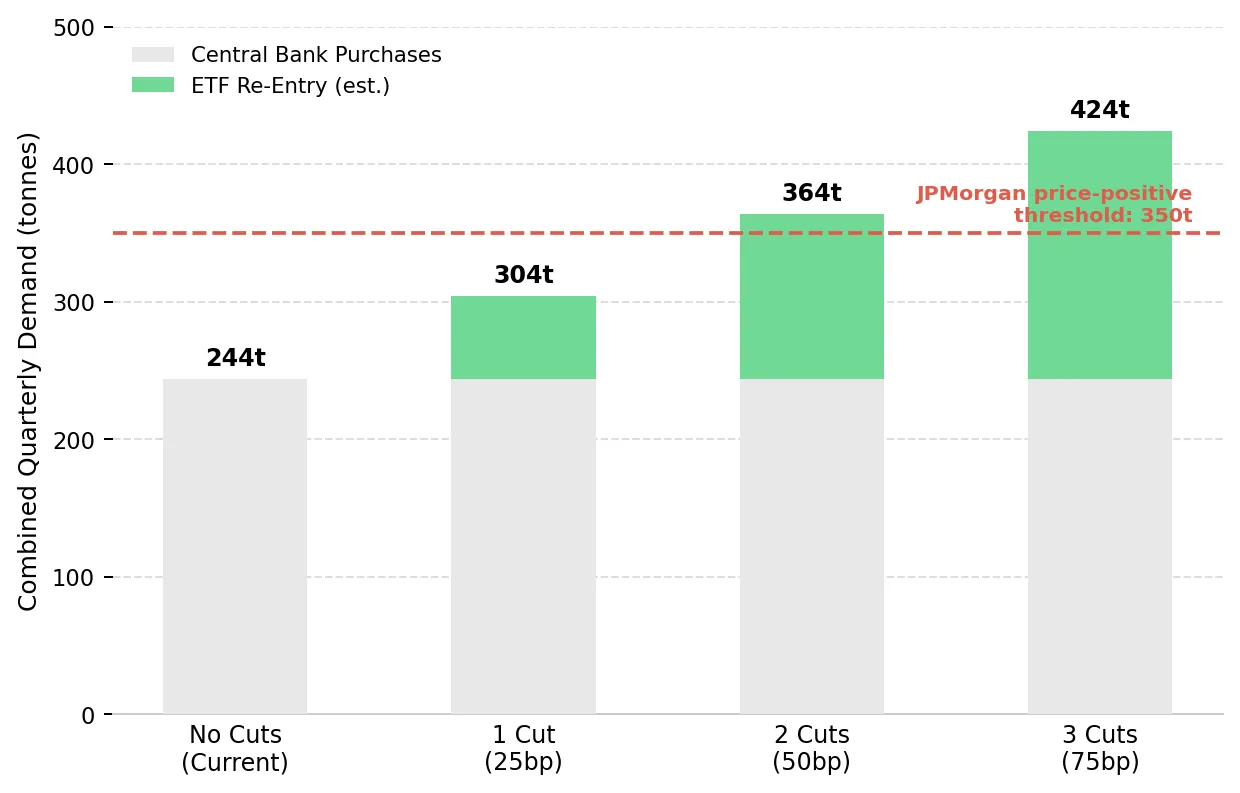
- Goldman Sachs estimates that each 25-basis-point rate cut adds roughly 60 tonnes of gold ETF demand within six months. Western gold ETFs added 500 tonnes in 2025 before shifting to net outflows in Q1 2026, leaving positioning below prior levels ahead of potential rate cuts.
- Development-stage gold equities can deliver disproportionate valuation gains during rising gold prices because feasibility-stage capital assumptions are largely fixed while projected cash flow increases with higher margins. Because upfront capital is largely defined before construction, higher gold prices can expand project NPVs through stronger projected margins and cash flow.
- Global mine supply grew 2% in Q1 2026, according to the World Gold Council’s Gold Demand Trends Q1 2026 report. With large gold projects typically requiring 15 to 20 years from discovery to production, the industry cannot rapidly increase supply in response to higher prices.
Slowing growth and elevated inflation contributed to an 8-4 FOMC vote to hold rates on April 29, the most divided Fed decision since October 1992, according to Fed Board records. Kevin Warsh’s expected confirmation would place a new inflation framework at the center of the June 16-17 FOMC meeting, increasing market focus on the timing of potential rate cuts.
Elevated inflation alongside slowing growth increases pressure on the Fed to balance inflation control against economic weakness, making Warsh’s preferred inflation measure important for 2026 rate-cut expectations. Goldman Sachs, JPMorgan Global Research, and Morgan Stanley have published year-end 2026 gold targets of US$5,400/oz, US$6,300/oz, and US$5,200/oz respectively, reflecting expectations that lower real rates and sustained central bank demand will continue supporting gold prices. Developers advancing toward feasibility, permitting, or production milestones could see the strongest valuation expansion if higher gold prices improve project economics and investor capital flows return to the sector.
US Stagflation & Fed Policy Constraints Support Gold Prices
Warsh will chair his first FOMC meeting against a stagflation backdrop of slowing economic growth and persistent inflation. Unlike most post-2008 periods, both additional rate hikes and rate cuts now carry economic risks, limiting the Fed’s policy flexibility. With policy flexibility constrained and real yields under pressure, the opportunity cost of holding non-yielding gold declines.
With PCE inflation at 4.5%, rate cuts risk sustaining inflation while additional tightening could further slow economic growth. Stagflation supports gold prices because elevated inflation reduces real returns across cash and fixed-income assets. With policy rates at 3.50% to 3.75% and inflation at 4.5%, real cash returns remain negative, reducing the opportunity cost of holding gold.
Warsh’s Inflation Framework & Fed Rate-Cut Expectations
Warsh stated a preference for the Dallas Fed’s trimmed mean PCE reading of 2.3% over official core PCE at 3.0%. The 70-basis-point difference implies a lower inflation backdrop than core PCE suggests, increasing the likelihood of rate cuts beyond the CME FedWatch Tool’s implied 4% probability for a December 2026 move. Goldman Sachs estimates that every 50 basis points of easing adds roughly US$120/oz to gold prices by reducing the opportunity cost of holding a non-yielding asset.
Fed Rate Cuts & Rising Gold ETF Demand
Goldman Sachs estimates that each 25-basis-point rate cut could add roughly 60 tonnes of gold ETF demand within six months. Three rate cuts would raise projected ETF demand to roughly 424 tonnes per quarter. Combined with the 244 tonnes of central bank purchases recorded in Q1 2026, total demand would exceed JPMorgan Global Research’s 350-tonne threshold historically associated with stronger gold prices.
Cabral Gold is commissioning Phase 1 of its oxide heap leach operation at the Cuiú Cuiú Gold District in Pará, Brazil. The July 29, 2025 pre-feasibility study reported a 78% after-tax IRR at a US$2,500/oz gold price assumption and AISC of roughly US$1,200 to US$1,300/oz. With gold prices above US$4,700/oz, implied operating margins exceed US$3,300/oz. Alan Carter, President and Chief Executive Officer of Cabral Gold, argues that accelerating resource growth and demonstrating Phase 2 economics could drive faster valuation expansion as gold prices rise:
"We think we can increase the value of this company faster if we can grow the global resource base here faster and we can demonstrate the economic viability of stage two through a PEA faster. "
Developer NPV Sensitivity to Real Yield Compression
Development-stage gold equities can deliver stronger valuation growth during rising gold prices because major capital assumptions are largely defined at feasibility, while projected cash flow expands with higher margins. If lower interest rates increase investor demand for gold equities, projects with completed feasibility studies and defined funding requirements could attract the strongest valuation re-ratings.
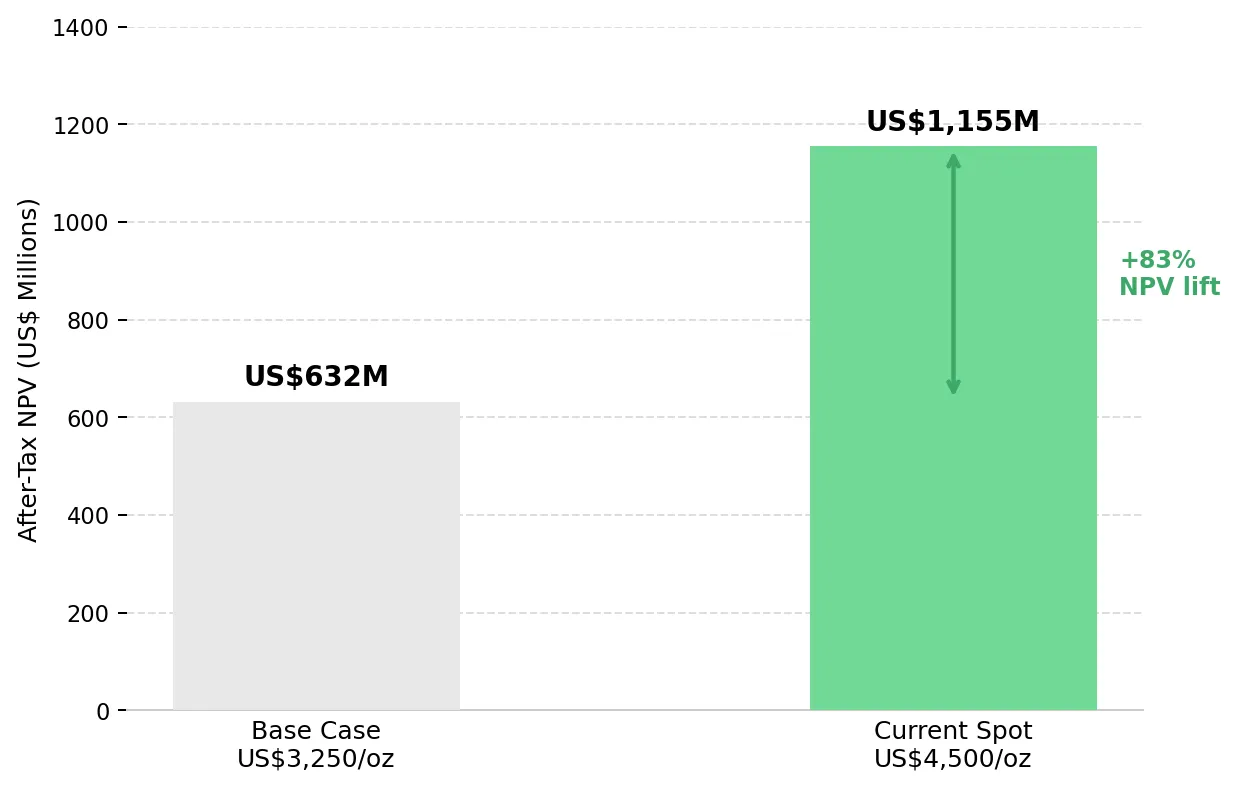
Once a project reaches feasibility, major capital assumptions are largely defined, allowing higher gold prices to expand projected margins and cash flow. U.S. Gold Corp published a March 2026 Feasibility Study for the CK Gold Project reporting an after-tax NPV5 of US$632 million at a US$3,250/oz gold price assumption. At gold prices above US$4,500/oz, the project NPV increases to roughly US$1.16 billion, an 83% increase from a 38% rise in gold prices. Luke Norman, Executive Chairman of U.S. Gold Corp, identifies the interest a fully permitted asset attracts:
"When you do go to project financing at this juncture, when you've got a positive definitive feasibility study out, clearly the hawks start circling. There are companies interested in M&A activity or pure takeouts on the project."
Economic Studies and Gold Developer Valuation Re-Ratings
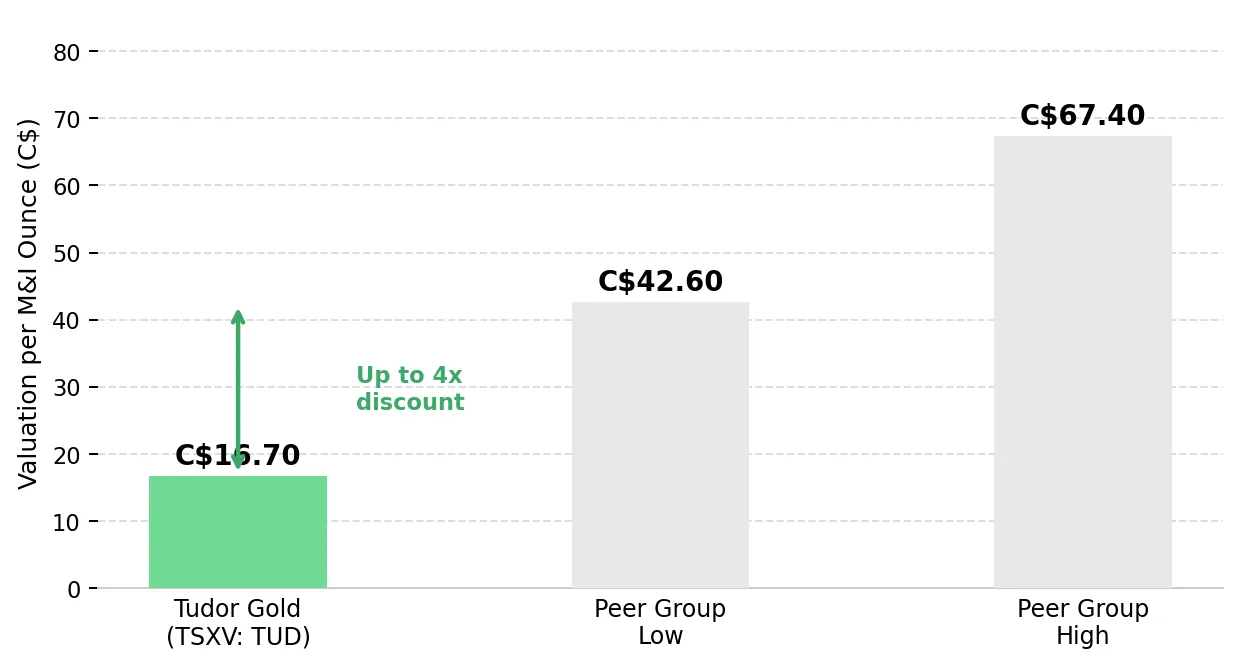
Tudor Gold holds an 80% interest in the Treaty Creek Project in British Columbia’s Golden Triangle. The 2025 NI 43-101 Technical Report for Treaty Creek reported an Indicated Mineral Resource at the Goldstorm Deposit of 24.9 million ounces of gold grading 0.85 g/t, alongside 148.7 million ounces of silver and 3.048 billion pounds of copper. Tudor Gold trades at roughly C$16.70 per measured and indicated ounce versus a peer range of C$42.60 to C$67.40. The company is targeting completion of a PEA for an underground starter mine in summer 2026. Projects without published economic studies typically trade at lower per-ounce valuations because investors have limited visibility into project economics and capital requirements. Joseph Ovsenek, President and Chief Executive Officer of Tudor Gold, frames the PEA as the re-rating catalyst:
"The big one for us is getting that PEA. Show people that this Treaty Creek is not just a big gold discovery, but actually it's going to be a mine."
P2 Gold is advancing the Gabbs gold-copper project in Nevada’s Walker Lane Trend toward a Feasibility Study targeting Q4 2026. The October 2025 PEA outlined annual production of 109,000 ounces of gold and 15,000 tonnes of copper over a 14.2-year mine life. Copper by-product revenue lowers net gold production costs, improving project margins during periods of higher copper prices. Joseph Ovsenek, President and Chief Executive Officer of P2 Gold, quantifies the project at current spot prices:
"If you look at spot prices right now, our rate of return is over 100%. Our NPV5 is 3 billion plus and our NPV15 is around 1.5 billion which is very robust."
Permitting Risk & Gold Developer Valuations
Permitting remains one of the largest development risks for mining projects because delays can materially extend timelines and increase capital costs. Permit delays or denials can reduce project value by extending construction timelines, increasing financing costs, and delaying cash flow generation. Projects with advanced permits or regulatory approvals typically trade at lower risk discounts, particularly when lower interest rates improve financing conditions for developers.
Hycroft Mining holds permits for both heap leach and milling operations at its northern Nevada project. The February 18, 2026 Initial Assessment Technical Report reported measured and indicated resources of 16.4 million ounces of gold and 562.6 million ounces of silver. Nevada ranked first globally for mining investment attractiveness in the Fraser Institute’s 2025 Annual Survey of Mining Companies, supporting faster permitting and lower jurisdictional risk. Diane Garrett, President and Chief Executive Officer of Hycroft Mining, quantifies the brownfields advantage over greenfield peers:
"The infrastructure that we have on site today would cost us over a billion dollars to build. We have two Merrill-Crowe facilities, a heap leach ready to receive ore. We have all of the admin buildings, fully operational labs, power, and water."
Provincial Approval Frameworks & Shorter Gold Development Timelines
New Found Gold is advancing the Queensway Gold Project in Newfoundland and Labrador, a jurisdiction where recent mining projects have received environmental assessment approvals in as little as 45 days. Queensway is targeting first ore to mill by end-2027 with initial capital of C$155 million. The acquired Pine Cove Mill removes the need for new mill construction, shortening the development timeline by roughly three years. Keith Boyle, Chief Executive Officer of New Found Gold, quantifies the cash flow profile at current gold prices:
"The first couple of years we're looking at about 100,000 oz a year at an all-in sustaining of about $1,300. That's 300 plus million dollars of cash flow a year."
In April 2026, British Columbia’s Major Mines Office paused Seabridge Gold’s permit amendment process pending resolution of a mineral title overlap involving Tudor Gold’s Treaty Creek claims. The clarification reduced uncertainty around Treaty Creek’s ownership position, a factor that had weighed on Tudor Gold’s valuation relative to peers. Regulatory clarity can improve project valuations by reducing perceived permitting and ownership risk, even without changes in gold prices or broader macroeconomic conditions.
Simpler Gold Project Profiles & Investor Capital Allocation
As financing conditions improve, investors are increasingly prioritizing projects with shorter development timelines, scalable mineral systems, and lower upfront infrastructure requirements. During a recent project update, Cobra Resources Managing Director Robert Vero highlighted the economic importance of shallow mineralization:
“These intersections start from tens of meters below the surface which is a really great economic sign. Porphyry exploration sometimes is not that cheap, particularly when you're having to drill deep holes. So, being able to define economic mineralization at these depths, with these widths, is really encouraging for something pretty big underneath it. ”
Projects with near-surface mineralization and simpler development profiles may attract stronger investor interest during periods of rising metal prices and improving financing conditions.
The Investment Thesis for Gold
- Warsh’s preference for trimmed-mean inflation data creates a 70-basis-point gap versus core PCE, increasing the probability of rate cuts at the June 16-17 FOMC meeting. Goldman Sachs estimates that each 25-basis-point cut could add roughly 60 tonnes of Western gold ETF demand within six months.
- Developers with largely defined capital requirements and near-term production timelines can experience significant NPV growth as gold prices rise. The U.S. Gold Corp feasibility study showed that a 38% increase in gold prices increased project NPV by 83%, highlighting the valuation leverage development-stage assets can generate during rising gold markets.
- Development projects with advanced permits in Wyoming, Nevada, Newfoundland, and British Columbia’s Golden Triangle carry lower regulatory risk and may attract greater investor interest if lower interest rates improve financing conditions for the sector.
- Annual gold mine supply growth of roughly 2% remains slow relative to the 15-to-20-year timeline required to develop new projects. If ETF and central bank demand continue rising in 2026, developers with advanced project timelines could benefit from tighter long-term supply conditions.
- Exploration companies targeting feasibility studies in Q4 2026 and developers targeting production during the same period could attract greater investor interest if lower interest rates improve financing conditions and gold demand.
The 70-basis-point gap between trimmed mean PCE and core PCE materially changes how restrictive current monetary policy appears. If the Fed adopts trimmed mean inflation data more heavily at the June 16-17 FOMC meeting, lower rate expectations could support renewed ETF demand at a time when global mine supply is growing by only about 2% annually. Developers advancing toward feasibility, permitting, or production could benefit most if lower inflation readings increase expectations for Fed easing in 2026.
TL;DR
US GDP growth of 2.0% in Q1 2026 alongside a 4.5% PCE deflator has increased pressure on the Fed, as rate cuts risk sustaining inflation while further tightening could weaken growth. Elevated inflation also keeps real returns on cash and fixed-income assets under pressure, reducing the opportunity cost of holding gold. Incoming Fed Chair Kevin Warsh’s preference for the Dallas Fed’s trimmed mean PCE at 2.3%, versus official core PCE at 3.0%, could increase expectations for rate cuts in 2026. Goldman Sachs estimates that each 25-basis-point cut could add roughly 60 tonnes of gold ETF demand within six months. Development-stage gold companies with advanced permits and defined capital requirements in Wyoming, Nevada, Newfoundland, and British Columbia could benefit most if lower rates support higher gold prices and renewed investor demand. With new gold projects typically requiring 15 to 20 years from discovery to production, mine supply remains slow to respond.
FAQs (AI-Generated)
Analyst's Notes


Subscribe to Our Channel


%20(1).png)


Stay Informed