Real Yield Constraints & ETF Reversibility Raise Discount Rates on Gold Equities, Redirecting Capital Toward Permitted Developers


Real yields raise discount rates on gold equities despite $4,300/oz prices, shifting capital toward permitted developers with near-term cash flow.
- Gold traded above $4,300 per ounce in April 2026 but did not produce uniform equity re-rating, as elevated real yields on US Treasury Inflation-Protected Securities increased discount rates applied to long-dated project cash flows.
- Brent crude above $100 per barrel from the United States-Israel-Iran conflict, a firmer United States dollar, and a Federal Reserve 2026 dot plot revised from two rate cuts to one have redirected capital toward yield-bearing and energy-linked assets.
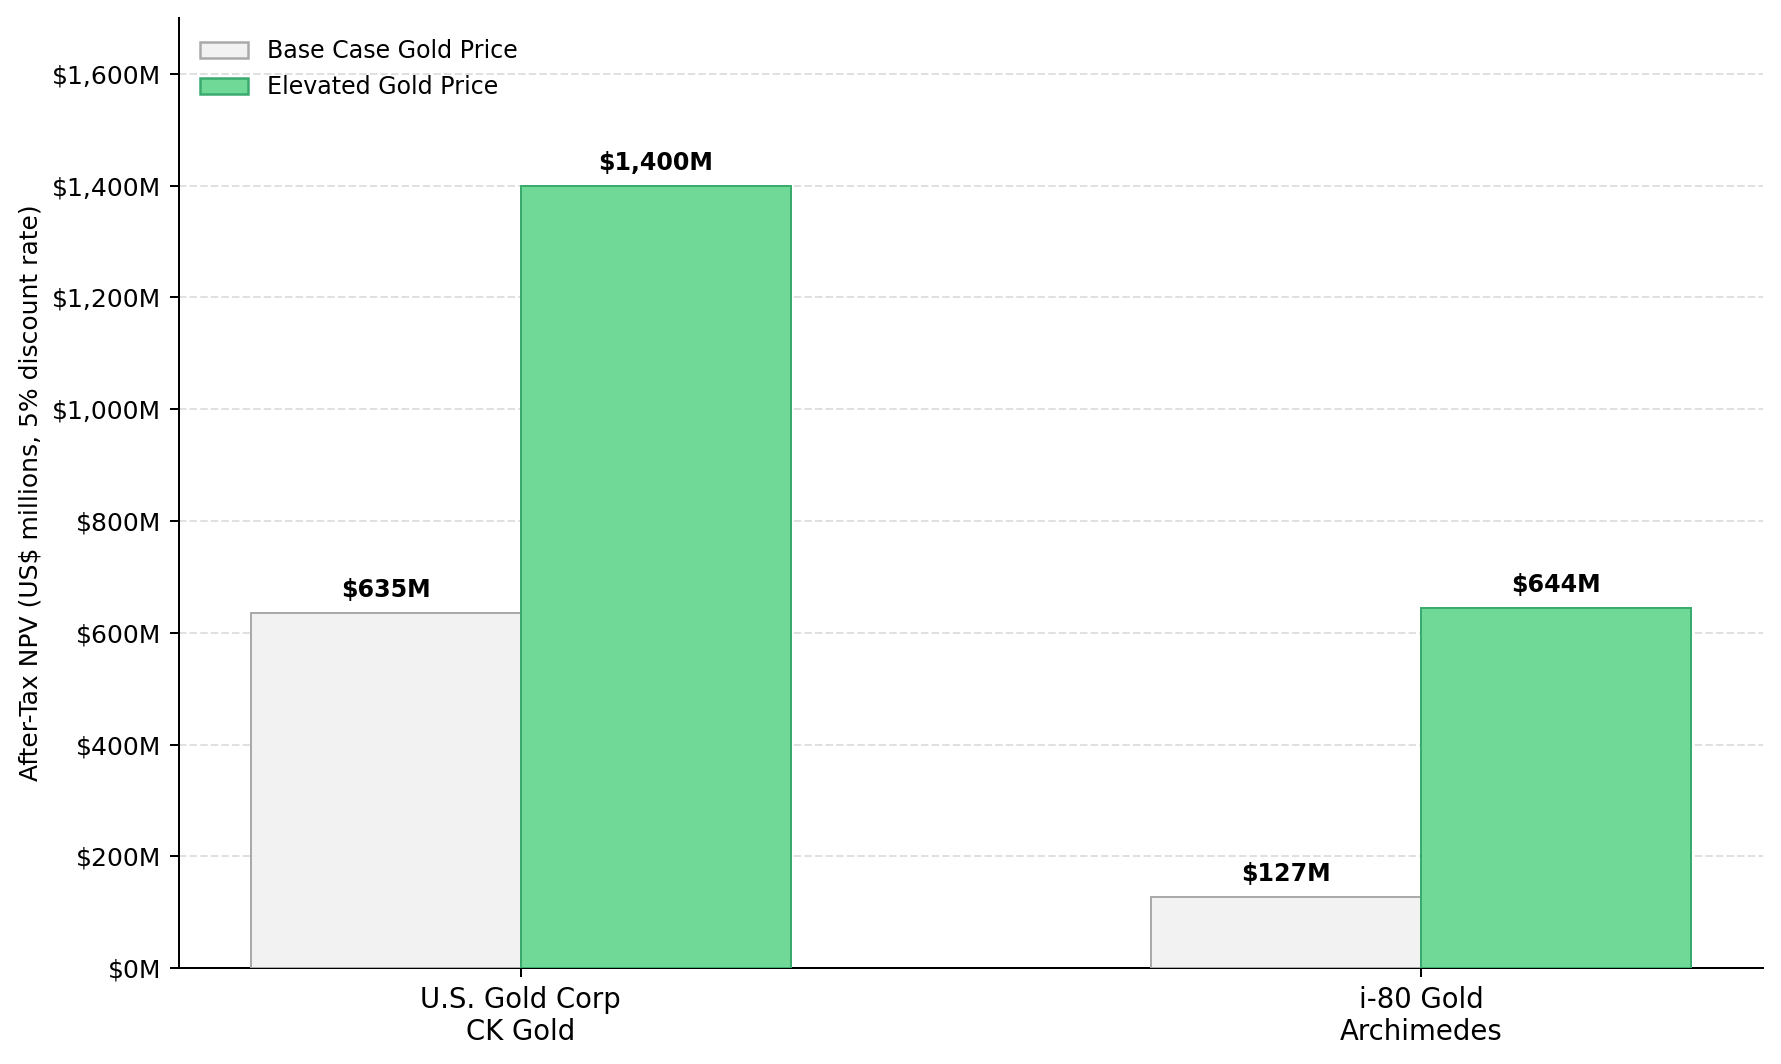
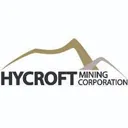
- U.S. Gold Corp's CK Gold project carries an after-tax Net Present Value of US$635 million and an Internal Rate of Return of 27% at $3,250 per ounce per its Definitive Feasibility Study, expanding to US$1.4 billion and approximately 50% Internal Rate of Return at $4,500 per ounce, below current spot prices.
- Serabi Gold produced 12,042 ounces in the first quarter of 2026 (up 20% year-over-year), closed the quarter debt-free with US$64.4 million in cash, and guided to 53,000 to 57,000 ounces for full-year 2026 per its April 14, 2026 release.
- i-80 Gold's Archimedes Underground targets first gold in the third quarter of 2026 at mine construction capital of US$49 million, with after-tax Net Present Value rising from US$127 million at $2,175 per ounce to US$644 million at $3,000 per ounce per its 2025 Preliminary Economic Assessment.
Macro Capital Rotation Suppresses Gold's Rally Despite Geopolitical Tension
Gold slipped from a one-month high in April 2026 on firmer dollar conditions as US-Iran talks remained in focus, per Reuters April 15, 2026, confirming that real yield direction and dollar strength determine near-term pricing more than geopolitical headlines. Central bank net purchases of 1,037 tonnes in 2023 per the World Gold Council provide a demand floor, but that floor does not compress the discount rates applied to gold equity Net Present Values.
For gold equity investors, rallies anchored in risk aversion rather than rate cuts produce uneven valuation support. Issuers requiring further spot price appreciation to justify Net Present Value assumptions carry elevated discount rate risk; issuers with permitted assets and near-term cash flow are positioned to re-rate independent of further spot gains.
Oil, Dollar Strength & Rate Expectations Raise Real Yields, Redirecting Capital Away from Gold Equities
Brent crude above $100 per barrel, a firmer United States dollar, and a Federal Reserve 2026 dot plot revised from two rate cuts to one. Each raises the real yield on US Treasury Inflation-Protected Securities, increasing the opportunity cost of holding a non-yielding asset. The Guardian reported on April 14, 2026 that the International Monetary Fund flagged the Iran war as a downside risk to global growth, tightening financial conditions even as safe-haven flows enter gold exchange-traded funds.
ETF demand introduces valuation volatility because it is reversible, unlike central bank buying which represents permanent reserve allocation. ETF inflows reverse with rate expectations, inflating enterprise value-to-resource ratios (market capitalization plus net debt divided by total gold resources in ounces) without improving project fundamentals. Reversals disproportionately impact development-stage equities dependent on equity market access for financing.
Producer Cost Discipline & Capital Execution Determine Returns Under Elevated Real Yields
Producer returns in the current regime are generated by cost per ounce, on-schedule delivery of capital projects, and avoidance of dilutive financings rather than by spot price. Serabi Gold produced 12,042 ounces of gold at its Palito and Coringa operations in Brazil in the first quarter of 2026, a 20% year-over-year increase, and closed the quarter debt-free with US$64.4 million in cash after repaying US$5.3 million to Itaú Bank per its April 14, 2026 release. Full-year 2026 guidance of 53,000 to 57,000 ounces is underwritten by a US$5.0 million fourth ball mill at Palito, funded from existing cash, targeting 330,000 tonnes per annum throughput in 2027.
Mike Hodgson, Chief Executive Officer of Serabi Gold, quantifies the self-funded position:
"We're generating so much cash... we can fund it all out of cash flow comfortably."
George Salamis, President and Chief Executive Officer of Integra Resources, frames the capital investment cycle:
"2026 is about building capacity today... to deliver more ounces, stronger cash flow, lower costs tomorrow."

Discovery Economics & Low-Capital Development Pathways Signal Early-Stage Re-Rating
Cabral Gold is advancing Stage 1 construction at its oxide heap leach project within the Cuiú Cuiú gold district of Brazil at approximately 60% completion, targeting commissioning in the third quarter and commercial production in the fourth quarter of 2026. The July 2025 Pre-Feasibility Study at the MG gold deposit reports an after-tax Internal Rate of Return of 78% at $2,500 per ounce gold and all-in sustaining costs of approximately $1,200 per ounce against initial capital of US$37.7 million, with approximately 25,000 ounces targeted in the first 12 months of production.
Alan Carter, President and Chief Executive Officer of Cabral Gold, frames the cash flow potential relative to current valuation:
"We are looking at 60 to 65 million dollars US a year, and our current market cap is right about 200 million."
Cobra Resources is advancing a copper-rare earths discovery at Nanadie Well in Western Australia with drill results returning 74 meters at over 1% copper and an 84-meter intersection across 1.6 kilometers of strike, with estimated contained copper approaching half a million tonnes and preliminary metallurgical work supporting a low-capital heap leach startup ahead of a flotation circuit for primary sulfide ore. Robert Vero, Managing Director of Cobra Resources, quantifies the phased development pathway:
"You've probably got a low capex startup and then flotation circuit to treat your primary sulfide mineralization."
Development Timelines Drive Valuation as Real Yields Elevate Discount Rates
Elevated real yields increase discount rates, making time to production the central variable in resource equity valuation. A project targeting first production in 24 months carries a higher Net Present Value multiple than an equivalent resource requiring 72 months, because future cash flows are discounted more aggressively at higher risk-free rates.
U.S. Gold Corp's CK Gold project in Wyoming holds all required federal and state permits, non-revocable under Wyoming state law. The April 2026 Definitive Feasibility Study reports an after-tax Net Present Value of US$635 million at a 5% discount rate and Internal Rate of Return of 27% at $3,250 per ounce, against initial capital of over US$400 million for approximately 90,000 gold equivalent ounces per year over an 11-year mine life.
Luke Norman, Executive Chairman of US Gold Corp, quantifies leverage at gold prices below current spot:
"At $4,500 gold... you're dealing with a $1.4 billion NPV and an IRR of just under 50%."
High-Grade Capital Efficiency & Financing Certainty Reduce Dilution Risk
i-80 Gold is advancing Archimedes Underground at Ruby Hill in northeastern Nevada toward first gold in the third quarter of 2026 at US$49 million of mine construction capital. The 2025 Preliminary Economic Assessment reports an after-tax Net Present Value of US$127 million at $2,175 per ounce, rising to US$644 million at $3,000 per ounce. New Found Gold is advancing Queensway in Newfoundland toward first production targeting late 2027, with a Phase 1 Preliminary Economic Assessment reporting 100,000 ounces per year in the first two full years at Phase 1 all-in sustaining costs of US$1,282 per ounce against initial capital of C$155 million, and a US$75 million debt package closing in mid-April 2026 funding construction without equity dilution.
Paul Chawrun, Chief Operating Officer of i-80 Gold, frames the institutional validation underpinning the financing:
"We went through comprehensive due diligence... there were a lot of interested parties to be part of this story."
Keith Boyle, Chief Executive Officer of New Found Gold, addresses the execution mandate:
"We want to keep the momentum... get to cash flow by the end of next year."
Exploration That Converts Resources to Reserves Replaces Discovery as the Primary Capital Allocation Driver
Exploration is no longer rewarded for discovery scale alone. Capital is allocated to programs that convert resources from inferred to indicated classification or shorten the development timeline, separating geological interest from direct advancement toward a financing or feasibility decision.
P2 Gold's Lucky Strike zone in British Columbia is targeting a resource estimate by the end of the third quarter of 2026 and a feasibility study in the fourth quarter of 2026, with a profile of approximately 110,000 ounces per year at 9 million tonnes per annum throughput and optionality to scale toward 150,000 ounces per year. The tight resource-to-feasibility sequencing eliminates the stage-gate delay that typically introduces the largest institutional discount.
Joe Ovstinek, President and Chief Executive Officer of P2 Gold, ties the resource estimate to the feasibility schedule:
"We'd like to get a resource estimate out by the end of the summer, and that will feed right into our schedule to have that feasibility done by year end."
Large-Scale Indicated Resources Advance Underground Scenario Studies
Tudor Gold's Treaty Creek project in British Columbia's Golden Triangle hosts indicated resources of 24.9 million ounces of gold, 148.7 million ounces of silver, and 3.048 billion pounds of copper at the Goldstorm Deposit per its April 15, 2026 update, with a 10,000-metre-plus 2026 drill program targeting the CBS Zone (2,000 meters) and Perfectstorm Zone (8,000 meters) as a Preliminary Economic Assessment advances for an underground mining scenario. A permitting overlap with Seabridge Gold's proposed KSM Mitchell Treaty Twin Tunnels remains subject to active British Columbia Supreme Court proceedings filed in September and October 2025, with no court dates set.
Joe Ovsenek, President and Chief Executive Officer of Tudor Gold, quantifies the infrastructure cost advantage:
"40 kilometers by road... no glaciers to cross... that is a big cost saving."
Tier-1 Jurisdictions Reduce Discount Rates & Accelerate Permitting Timelines
Jurisdictional quality is a first-order variable in Net Present Value modelling under elevated real yields. Permitted projects in established US mining districts carry lower country risk premiums, predictable permitting timelines, and accessible power and water, which reduce the discount rate applied to forward cash flows.
Hycroft Mining Holding Corporation holds one of the world's largest precious metals deposits in northern Nevada and is completing technical studies to transition the Hycroft Mine from oxide heap leach to sulfide milling. The April 16, 2026 appointment of Eric Colby, a 15-year Newmont veteran with over US$20 billion in transaction experience, as Executive Vice President, Corporate Development, adds transactional capacity at the transition to development execution.
Diane Garrett, President and Chief Executive Officer of Hycroft Mining, addresses the resource expansion underpinning the sulfide milling pathway:
"We had an overall significant increase in the resources... and the system is still open in all directions and at depth."
The Investment Thesis for Gold
- Central bank net purchases of 1,037 tonnes in 2023 per the World Gold Council provide a demand floor, while real yields elevated by Brent crude above $100 per barrel and a Federal Reserve 2026 dot plot revised from two cuts to one suppress valuation multiples for long-dated project cash flows.
- Permitted developers with completed feasibility studies and defined construction timelines carry lower discount rates and financing risk, positioning them for re-rating independent of further spot price increases.
- Producers with defined all-in sustaining cost structures and self-funded growth generate free cash flow at current gold prices, allowing expansion without equity dilution and preserving shareholder value.
- Developers with low initial capital intensity and high internal rates of return provide asymmetric upside to gold price increases while limiting downside through defined economic parameters.
- Exploration programs only support valuation where they convert inferred resources to indicate classification or shorten development timelines, directly advancing projects toward economic studies and financing decisions.
- Jurisdictions with established permitting frameworks, infrastructure access, and legal stability reduce project risk and lower discount rates applied to future cash flows.
Gold's April 2026 rally is driven by geopolitical hedging rather than rate cuts, producing investment flows that support price but do not reduce discount rates applied to gold equities. Real yields elevated by Brent crude above $100 per barrel, a firmer dollar, and a Federal Reserve 2026 dot plot revised from two cuts to one are redirecting capital toward yield-bearing assets. Returns are concentrated in issuers with permitted assets, defined cash flow timelines, and Tier-1 jurisdictional exposure; the next leg of the gold equity rally will be set by central bank policy and real yield direction rather than geopolitical headlines.
TL;DR
Gold above $4,300 per ounce in April 2026 has failed to deliver uniform equity re-rating because Brent crude above $100 per barrel, a firmer US dollar, and a Federal Reserve 2026 dot plot revised from two cuts to one have raised real yields. The equity curve has fragmented: permitted developers with completed feasibility studies are re-rating on execution certainty rather than spot, with U.S. Gold Corp carrying US$635 million Net Present Value and i-80 Gold's Archimedes at US$127 million rising to US$644 million at $3,000 per ounce. Near-term producers with US$64.4 million in cash and debt-free balance sheets are funding expansion without dilution. Returns are concentrated where execution, financing, and jurisdiction align.
FAQs (AI-Generated)
The rally is being driven by geopolitical risk aversion rather than monetary easing, which means it produces ETF-driven flow support but not the falling-rate backdrop that compresses discount rates on gold equity Net Present Value models. Brent crude above $100 per barrel, a firmer United States dollar, and a Federal Reserve 2026 dot plot revised from two rate cuts to one have raised real yields and redirected capital toward yield-bearing and energy-linked assets. Developers with long-dated project cash flows face elevated discount rates that offset the benefit of higher spot prices.
Permitted developers with completed Definitive Feasibility Studies, issued permits, and construction timelines within 24 months are best positioned. U.S. Gold Corp's CK Gold project carries an after-tax Net Present Value of US$635 million and a 27% Internal Rate of Return at $3,250 per ounce with non-revocable Wyoming permits. i-80 Gold's Archimedes Underground targets first gold in the third quarter of 2026 at US$49 million of mine construction capital. Both reduce the discount rate and financing risk that weigh on pre-feasibility explorers under elevated real yields.
Jurisdictional quality is now a first-order input into Net Present Value modelling rather than a qualitative overlay. Established US mining districts, including Wyoming for U.S. Gold Corp and Nevada for i-80 Gold and Hycroft Mining, carry codified permitting frameworks, accessible power and water, and lower country risk premiums. These factors reduce the discount rate applied to forward cash flows and accelerate the time to first production, directly expanding equity valuation multiples relative to frontier jurisdictions.
Serabi Gold produced 12,042 ounces in the first quarter of 2026, a 20% year-over-year increase, and closed the quarter debt-free with US$64.4 million in cash after repaying US$5.3 million to Itaú Bank per its April 14, 2026 release. Full-year 2026 guidance of 53,000 to 57,000 ounces is supported by a US$5.0 million fourth ball mill at Palito, funded from existing cash, targeting 330,000 tonnes per annum processing throughput in 2027. The self-funded expansion model removes equity market dependence through the ramp.
New Found Gold secured a US$75 million debt package expected to close in mid-April 2026, which funds Queensway construction advancement without equity dilution. The Phase 1 Preliminary Economic Assessment reports 100,000 ounces per year in the first two full years at grades above 12 grams per tonne gold, at Phase 1 all-in sustaining costs of US$1,282 per ounce and initial capital of C$155 million. The Hammerdown Mine, trucking ore 95 kilometers to the Pine Cove Mill acquired in November 2024, generates bridge cash flow that reduces net capital requirements ahead of Queensway first production targeting late 2027.
Analyst's Notes


Subscribe to Our Channel


.jpg)


Stay Informed