Gold Declined 10% Over Two Weeks on Rising Oil Prices and Interest Rate Pressure: Is the Safe-Haven Case Still Valid?


Gold dropped 10% in a week to $4,440/oz as oil-driven inflation forces central bank tightening - challenging the safe-haven thesis and reshaping mining equity positioning.
- Gold has entered a high-volatility regime, falling over 10% in a single week to approximately $4,440 per ounce as of March 23, 2026, despite ongoing geopolitical tension, challenging its traditional safe-haven role and the positioning strategies built around it.
- The primary driver is not risk aversion but inflation transmission via rising oil prices, forcing major central banks toward a more hawkish policy stance that prioritizes inflation control through higher interest rates.
- Higher interest rates increase the opportunity cost of holding gold, a non-yielding asset, shifting institutional capital toward yield-bearing instruments that now offer meaningful return.
- Gold is no longer reacting linearly to geopolitical risk but instead to monetary policy expectations and real yield movements, requiring a more disciplined analytical framework than crisis monitoring alone.
- Mining equities are diverging sharply, with low-cost producers and near-term developers demonstrating margin resilience while higher-cost and capital-intensive projects face free cash flow compression.
A Breakdown in the Traditional Safe-Haven Narrative
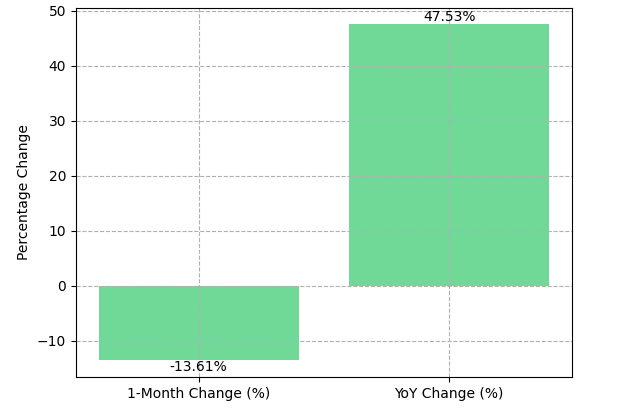
As of March 23, 2026, gold trades at $4,440.32 per ounce, down 13.61% over the prior month despite sustained Middle East tensions that would historically have supported prices. The asset remains up 47.53% year-over-year, indicating the longer-term structural bid is intact while short-term behavior is now governed by a different set of inputs.
The mechanism operates through a four-stage transmission channel: geopolitical conflict elevates oil prices, sustained energy costs drive inflation persistence, persistent inflation forces central banks toward tighter monetary policy, and tighter monetary conditions increase the opportunity cost of holding non-yielding assets. This produces a macro tug-of-war in which geopolitical risk supports gold while monetary tightening suppresses it and in the current cycle, the tightening signal is dominant.
Understanding the Mechanism: Oil, Inflation & Hawkish Central Banks
A hawkish central bank prioritizes inflation control through interest rate increases and balance sheet reduction. The US Federal Funds Rate currently stands at approximately 3.75%, while headline inflation runs at approximately 2.40%, with energy-driven cost pressure pushing realized inflation higher than lag-adjusted models have fully captured. The Federal Reserve, European Central Bank, Bank of England, and Bank of Japan have each signaled readiness to respond with additional tightening, creating a synchronized restrictive posture not seen since 2022.
Gold generates no income, making its attractiveness a function of real interest rates - the difference between nominal rates and inflation. When nominal rates rise faster than inflation, real yields increase and gold's risk-adjusted return deteriorates relative to bonds and money market instruments. Gold pricing spans three venues, the London Bullion Market Association for physical settlement, COMEX 100-ounce futures contracts for leveraged price discovery, and the Shanghai Gold Exchange for Eastern physical demand - meaning short-term moves can be amplified by futures positioning that has limited relationship to underlying supply-demand fundamentals.
Policy Sensitivity: When Interest Rates Override Geopolitics
The bull case for gold requires one of three conditions: major central banks pivot to a dovish stance before inflation is fully controlled, inflation moderates without aggressive rate increases, or real yields decline as a result of sufficient economic weakness. None of these conditions is currently priced as the base case by futures markets.
An additional tail risk exists in the form of sovereign reserve liquidation. As of December 2025, the United States, Germany, and Italy hold approximately 8,133 tonnes, 3,350 tonnes, and 2,451 tonnes of official gold reserves respectively. If any major sovereign required asset sales to stabilize public finances, the resulting supply shock would weaken the structural price floor that central bank accumulation has supported over the past three years.
Scenario Sensitivities: Bull Case & Bear Case
The current market is pricing a sustained tightening cycle as its base case, but two scenarios carry material implications for gold allocation. The bull case requires one of three triggers: major central banks pivot to a dovish stance before inflation is fully controlled, inflation moderates without requiring aggressive rate increases, or real yields decline as economic weakness outpaces policy response. Under any of these conditions, the opportunity cost of holding gold falls and capital rotates back into the asset. The bear case - which futures positioning currently reflects - assumes oil-driven inflation persists through mid-2026, central banks across the Federal Reserve, European Central Bank, Bank of England, and Bank of Japan maintain or extend their tightening cycles, and real yields continue rising. Under the bear case, gold faces sustained valuation pressure regardless of geopolitical developments. Investors should model both scenarios explicitly rather than defaulting to a single directional view of monetary policy trajectory.
Gold Mining Equities: Margin Compression vs Operational Leverage
Gold price volatility affects mining equities through margin sensitivity, but the magnitude varies substantially by cost structure, development stage, and balance sheet strength.
Producers: Cash Flow Resilience
Perseus Mining carries total liquidity of US$1.2 billion, comprising US$755 million in net cash, a US$400 million undrawn debt facility, and US$229 million, providing balance sheet depth that insulates operations from short-term price dislocations. Serabi Gold's Brazil operations produce grades up to 9.9 grams per tonne gold at an All-In Sustaining Cost of approximately $1,241 per ounce, illustrating the margin protection available through high-grade, low-footprint production.
Integra Resources produces gold at Florida Canyon while advancing the DeLamar project with a consolidated resource which totals 6.9 million gold-equivalent ounces measured and indicated. The DeLamar feasibility study, published February 2, 2026, using a US$3,000 per ounce base case, reports a 97% internal rate of return and a $1.9 billion net present value. George Salamis, President and Chief Executive Officer, describes the treasury position:
"In terms of our current cash position, it now sits at over $110 million in the treasury. We've got 60 to 70 to spend on the asset, and that leaves plenty of free cash."
West Red Lake Gold Mines restarted the Madsen Mine in Ontario's Red Lake district in May 2025, targeting approximately 50,000 ounces per year from 2026 onward. The restart leverages approximately $350 million in prior sunk capital, reducing construction risk relative to greenfield projects.
i-80 Gold is processing refractory ore through its own Lone Tree autoclave, enabling PEA IRRs of 81% for Archimedes and 52% for Cove. Paul Chawrun, Chief Operating Officer, outlines the production trajectory under the company's long-term three-phase development plan:
"In terms of production, we'll have the Lone Tree plant producing gold by the end of 2027, with a bit of a ramp-up in 2028 and in the range of about 150,000 - depending on the grade - to 160,000 ounces per year... The final number we're chasing is about 500,000 to 600,000 ounces, and it varies year to year."
Trading Structure, Leverage & the Retail Risk Implication
Gold's price is formed across three distinct venues, each with different liquidity characteristics and risk profiles that retail investors must understand before interpreting short-term moves as signals of fundamental value. The over-the-counter London Bullion Market Association market handles the majority of physical settlement. COMEX 100-ounce futures contracts provide leveraged price discovery, where positioning shifts can move the spot price independent of any change in physical offtake.
The Shanghai Gold Exchange drives Eastern physical demand and introduces a time-zone-sensitive liquidity dynamic during Asian trading hours. The practical consequence is that a 10% single-week price decline may reflect a rapid unwind of leveraged futures positioning rather than a deterioration in long-term physical demand fundamentals. Retail investors who interpret such moves as a structural breakdown in gold's investment case risk making allocation decisions based on financial market mechanics rather than underlying supply and demand conditions. Price volatility is not equivalent to value destruction.
Gold Developers & Near-Term Cash Flow
Hycroft Mining's 2026 Mineral Resource Estimate totals 16.41 million ounces of gold and 562.57 million ounces of silver in the measured-and-indicated categories, with an additional 5.03 million gold ounces and 132.84 million silver ounces inferred. The company reported US$194.1 million in cash as of February 28, 2026, backed by institutional shareholders including BlackRock, Schroders, Franklin, and Pala.
U.S. Gold Corp holds a fully permitted CK Gold project holding 1.022Moz of gold and 259.7Mlbs of copper in reserves, complemented by the district-scale Keystone project situated on Nevada's prolific Cortez Trend. George Bee, President, Chief Executive Officer, and Director, describes U.S. Gold’s near-term path:
"We're one of the few projects with a fully permitted project in a stable jurisdiction ready to go... We've got an 18-to-24-month build, we can be up into operation by the end of 2027 or 2028."
Cabral Gold is advancing the Cuiú Cuiú project in Brazil's Tapajós Gold Province, fully funded through a US$45 million gold loan closed November 2025. Phase 1 operation reports an after-tax internal rate of return of 78%, a net present value of US$74 million at US$2,500 per ounce gold, an All-In Sustaining Cost of US$1,210 per ounce, and a 10-month payback period, with first gold pour targeted for the second half of 2026.
High-Grade Optionality & Exploration
New Found Gold is advancing its Queensway project in Newfoundland toward Phase 1 ore delivery to the Pine Cove Mill, with the Queensway preliminary economic assessment reporting an All-In Sustaining Cost of US$1,256 per ounce. Keith Boyle, Chief Executive Officer, describes the cash flow standing:
"You look at the different timelines to get to cash flow and not have to keep financing to keep things going and dilute shareholders... We're trucking 9 to 10 gram material, at today's price you're looking at over $250 million of free cash flow over that first four years while we build the mill on site."
Tudor Gold's Treaty Creek project in British Columbia hosts approximately 24.9 million indicated ounces and 4 million inferred ounces of gold, per a resource estimate. The deposit sits approximately 40 kilometers by road from Highway 37 and the Northwest Transmission Line, materially reducing projected site access costs relative to comparable Golden Triangle assets.
P2 Gold is advancing the Gabbs Project in Nevada, a polymetallic gold-copper asset at the preliminary economic assessment stage with exploration targets exceeding five million gold-equivalent ounces. Management holds a 16.5% equity ownership stake, providing direct alignment with shareholder outcomes.
Global Supply Base & Structural Demand Anchors
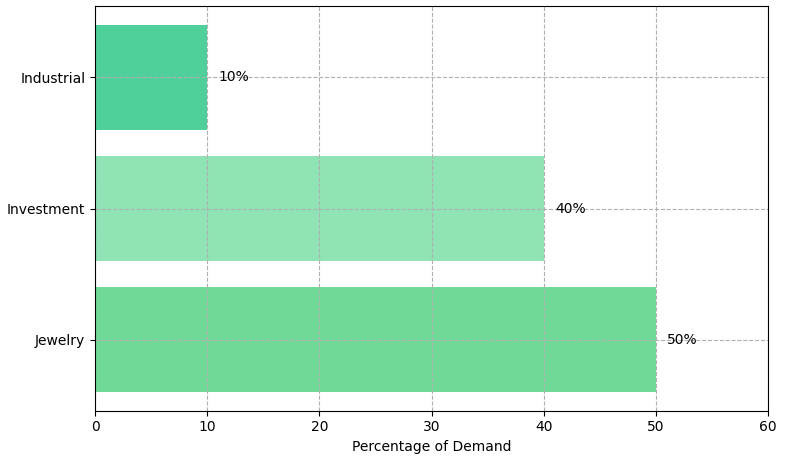
Physical gold supply is concentrated among a small number of major producing nations - China, Australia, the United States, and Russia - with no single country controlling sufficient market share to exert sustained pricing influence. This geographic dispersion limits the risk of a supply-driven price shock under normal operating conditions. On the demand side, jewelry consumption accounts for approximately 50% of annual offtake, investment demand for approximately 40%, and industrial applications for approximately 10%.
The critical implication for investors is that short-term price weakness driven by ETF outflows and futures positioning does not necessarily reflect a deterioration in physical demand, which remains structurally supported by population growth, rising middle-class wealth in Asia, and ongoing central bank accumulation programs across emerging market economies.
The Investment Thesis for Gold
- Gold's macro sensitivity has increased, making it more responsive to real interest rate movements than to geopolitical headlines in isolation, requiring investors to model monetary policy transmission as a primary analytical input rather than a secondary consideration.
- Margin resilience favors companies with All-In Sustaining Costs below $1,400 per ounce, where operating cash flow is preserved even if gold prices retrace further in a sustained tightening scenario.
- Producers with low-cost operating foundations offer cash flow exposure with reduced construction risk relative to greenfield development.
- Developers with high internal rates of return confirmed by technical studies provide leveraged upside to a price recovery without requiring equity financing at compressed valuations.
- Near-term developers with confirmed permitting packages, including U.S. Gold Corp at CK Gold in Wyoming, reduce timeline and regulatory risk for investors seeking production growth within a defined construction window.
- Balance sheet strength is a critical differentiator in volatile cycles positioned to advance drill programs without dilutive equity issuances at trough valuations.
- Tier-1 jurisdictions including Nevada, Wyoming, British Columbia, Ontario, and Newfoundland attract institutional capital during periods of uncertainty because they offer regulatory predictability and materially reduced political risk relative to many producing regions globally.
- Large-scale resource optionality provides disproportionate upside exposure to a multi-year gold price recovery without requiring near-term capital deployment at distressed valuations.
A Market Redefined by Policy, Not Panic
Gold's 10% decline in a single week reflects a fundamental change in the asset's behavioral drivers that cannot be analyzed through prior-cycle frameworks. The geopolitical risk that once provided an automatic price floor now competes against a monetary policy transmission mechanism that, in the current cycle, is more powerful. The relationship between the Federal Funds Rate and realized inflation will determine whether gold's structural bid reasserts itself through 2026. Differentiated exposure to low-cost producers, funded developers with near-term cash flow visibility, and large-scale resource holders in stable jurisdictions offers a more defensible portfolio structure than undifferentiated gold price exposure. Gold remains a strategic asset.the current volatility refines the criteria for how that exposure must be constructed and evaluated.
TL;DR
Gold has declined over 10% in a single week to approximately $4,440 per ounce as of March 23, 2026, despite persistent geopolitical tension. The primary driver is a four-stage transmission mechanism: rising oil prices sustain inflation, inflation forces central banks toward higher interest rates, and higher rates increase the opportunity cost of holding a non-yielding asset. The Federal Reserve, ECB, Bank of England, and Bank of Japan have each signaled further tightening readiness. Within mining equities, low-cost producers and funded near-term developers with confirmed permitting and high internal rates of return offer more defensible exposure than undifferentiated gold price positioning. The structural demand case - anchored by central bank accumulation, Asian wealth growth, and jewelry consumption - remains intact, but monetary policy transmission has become the dominant short-term pricing variable.
FAQs (AI-Generated)
Gold's decline reflects a shift in the dominant pricing driver. Rising oil prices have sustained inflation, prompting major central banks to signal additional interest rate increases. Higher rates raise the opportunity cost of holding gold, a non-yielding asset, making yield-bearing instruments comparatively more attractive. In the current cycle, this monetary policy transmission is overriding the traditional geopolitical safe-haven bid.
Three conditions could restore gold's upward trajectory: major central banks pivot to a dovish stance before inflation is fully contained; inflation moderates without requiring further aggressive rate increases; or real yields decline as economic weakness outpaces central bank policy response. None of these is currently priced as the base case by futures markets.
Not necessarily. A sharp single-week decline can reflect the rapid unwinding of leveraged futures positions on COMEX rather than any deterioration in physical demand fundamentals. Jewelry consumption, central bank accumulation, and investment demand remain structurally supported by long-term demographic and wealth growth trends, particularly across Asia.
Impact varies significantly by cost structure. Producers with All-In Sustaining Costs below approximately $1,400 per ounce maintain meaningful operating margins even under a sustained tightening scenario. Developers with high internal rates of return confirmed by feasibility studies, full permitting packages, and strong treasury positions are better insulated from valuation compression than capital-intensive greenfield projects that require ongoing equity financing.
Tier-1 jurisdictions—including Nevada, Wyoming, British Columbia, Ontario, and Newfoundland—attract institutional capital during periods of uncertainty because they offer regulatory predictability and lower political risk. Projects in these regions face materially reduced permitting and operational risk relative to assets in less stable jurisdictions, providing a valuation premium that is particularly relevant when gold price volatility compresses sector-wide multiples.
Analyst's Notes


Subscribe to Our Channel


.jpg)


.jpg)

Stay Informed