Gold's Reserve Demand Broadens Beyond Fed-Driven Price Swings



Central bank gold buying broadens as 89% expect global reserves to rise, supporting demand beyond near-term Fed-driven price moves.
- Central banks bought 288.9 tonnes of gold in the second quarter of 2026, up 62% year over year and a record for any second quarter on file.
- Buying extended across 4 central banks, Poland, China, Uzbekistan, and Kazakhstan, even as Russia and Turkey reduced holdings, lowering the concentration risk behind quarterly demand.
- A World Gold Council survey of 76 central banks found that 89% expect global gold reserves to rise over the next 12 months, supporting the case that reserve accumulation could extend beyond second-quarter flows.
- Featured development-stage studies use base-case gold prices of $2,500 to $3,250 per ounce, below spot near $4,400 per ounce, reducing their dependence on current prices to support project economics.
- The Fed's August 19 meeting minutes and Chair Kevin Warsh's August 28 Jackson Hole address could shift rate expectations and gold prices within days without changing the central-bank reserve purchases already recorded across multiple quarters.
Four Central Banks Broaden Gold Demand & Reduce Concentration Risk
Concentration risk has been a key weakness in the central-bank gold demand thesis because reliance on 1 or 2 large buyers would leave aggregate purchases vulnerable to a policy shift by either institution. Second-quarter purchases came from 4 reserve managers, Poland, China, Uzbekistan, and Kazakhstan, while sales by Russia and Turkey still left aggregate central-bank purchases at 288.9 tonnes.
With purchases distributed across 4 reserve managers, aggregate demand was less dependent on any single country's reserve policy than it would have been under a 1- or 2-buyer concentration, reducing the risk that one policy reversal could undermine the broader central-bank demand thesis.
Four Central Banks Add Gold as Net Buying Reaches 288.9 Tonnes
Poland added 51 tonnes in the quarter, lifting reserves to 632 tonnes and leaving holdings about 68 tonnes below its stated target of roughly 700 tonnes. China's central bank added 33 tonnes, its largest quarterly increase since the fourth quarter of 2023, taking official holdings to 2,346 tonnes and extending its buying streak to 21 consecutive months.
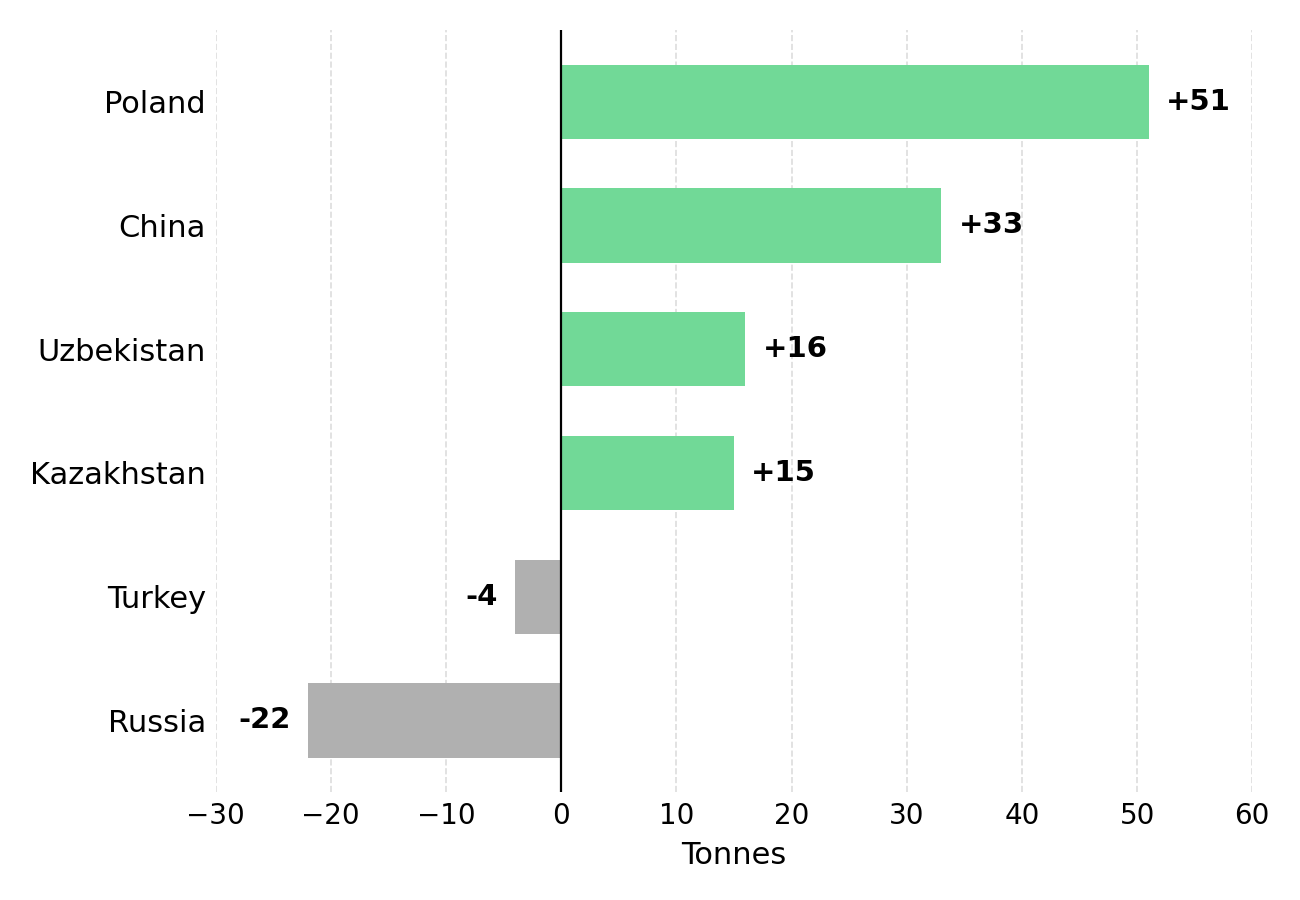
Uzbekistan and Kazakhstan added 16 tonnes and 15 tonnes, respectively, bringing the number of central banks adding reserves during the quarter to 4 and broadening the buying base beyond Poland and China.
Russia sold 22 tonnes in the second quarter, while Turkey sold 4 tonnes. Despite the combined 26 tonnes of sales from Russia and Turkey, net central-bank purchases reached 288.9 tonnes, showing that additions elsewhere more than offset disposals during the quarter.
89% Reserve Outlook Extends Central-Bank Gold Demand Beyond Q2
Unlike realized purchase data, the World Gold Council's survey of 76 central banks provides a forward-looking measure, with 89% expecting global gold reserves to rise over the next 12 months. The survey complements the second-quarter purchase data because it measures stated reserve expectations rather than relying solely on already completed transactions.
Survey responses are not commitments to future purchases, and reserve strategies can change before those expectations translate into realized demand. The 89% survey result therefore supports, but does not guarantee, continuation of the direction seen in the second quarter, when net central-bank purchases reached 288.9 tonnes.
Broad second-quarter purchases and the 89% survey result together support a demand thesis extending beyond one quarter, while neither data set alone establishes the duration or scale of future buying. Gold exposure over a multi-quarter horizon should therefore distinguish between short-term price risk from Fed policy and longer-duration demand evidence from central-bank reserve activity.
Fed Rate Signals Drive Near-Term Gold Prices, Not Central-Bank Demand
Broad central-bank reserve buying does not remove Fed policy as a near-term gold price driver because changes in rate expectations alter the opportunity cost of holding non-yielding gold. Spot gold rose roughly 9%, from about $4,050 per ounce on August 3 to $4,400-$4,420 per ounce by August 16, while the priced-in probability of a 25 basis point September rate hike fell from about 55% to 35% following softer July inflation data. Lower rate expectations reduce the opportunity cost of holding non-yielding gold and can move prices within days, while central-bank reserve purchases are measured over quarterly reporting periods.
The Fed's August 19 meeting minutes and Chair Kevin Warsh's August 28 Jackson Hole address both precede the September 16 rate decision and could shift market expectations for a September hike. A more hawkish signal could raise rate expectations and gold's opportunity cost, creating near-term downside pressure on the metal.
Fed-driven price risk and central-bank reserve demand operate through different mechanisms and over different time horizons. A hawkish Jackson Hole message could raise expected interest rates and increase the opportunity cost of holding gold over the following weeks. The same message would not change Poland's stated 700-tonne reserve target or reverse China's already recorded 21-month buying streak. Treating the two as a single risk factor obscures that Fed policy can move gold prices without directly determining the reserve targets and purchases of other central banks.
Below-Spot Gold Assumptions Preserve Project Economics as Reserve Demand Broadens
If central bank demand is broadening rather than concentrating, and the survey data suggests that pattern is expected to continue, the more useful question for equity investors becomes which producers, developers, and explorers are structured to deliver ounces into that demand base without depending on gold holding near current spot prices. Several development-stage and exploration-stage companies illustrate different answers to that question.
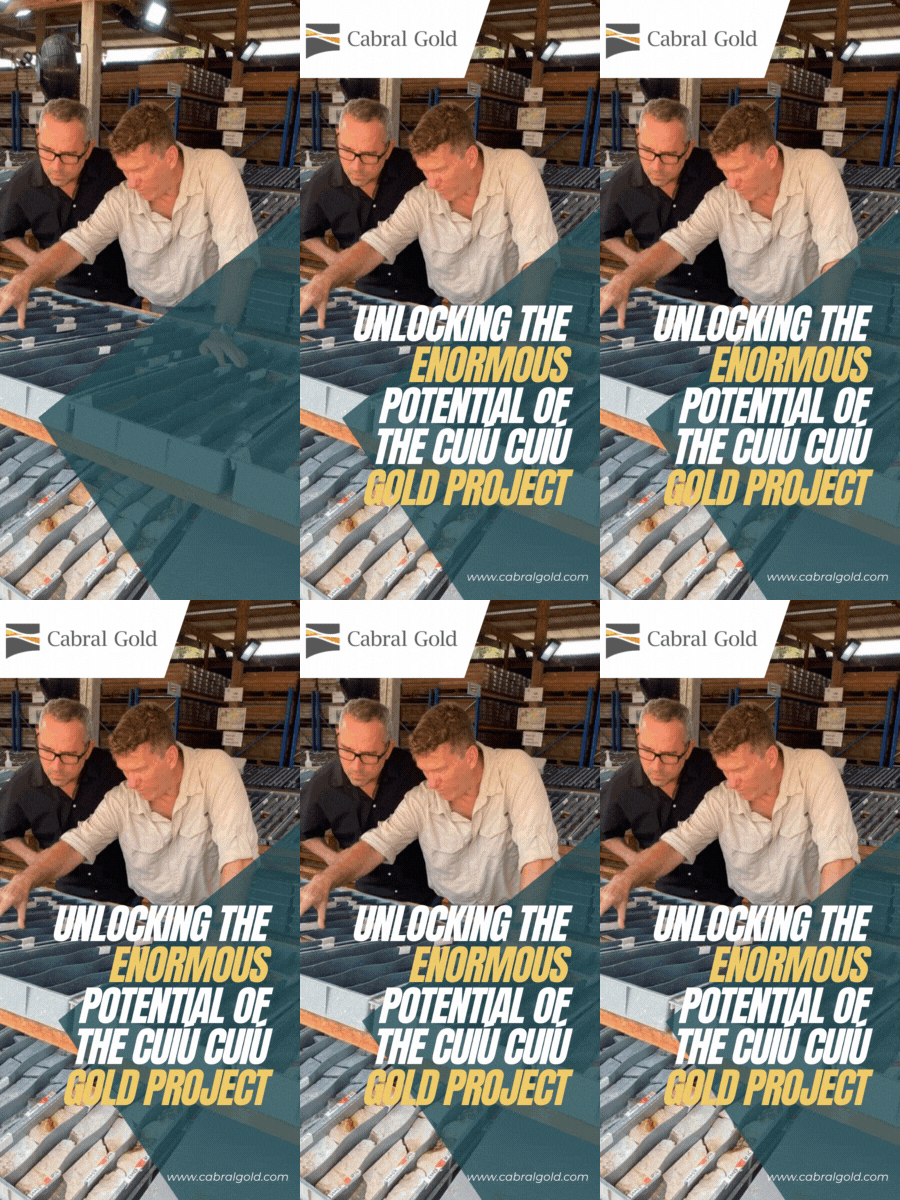
Cabral Gold, a development-stage company advancing its Cuiú Cuiú project in Brazil, models its initial oxide heap-leach phase at a $2,500 per ounce base-case gold price and reports a 78% after-tax internal rate of return (IRR) at that assumption, with sensitivity analysis showing a 59% after-tax IRR at $2,250 per ounce and a 151% after-tax IRR at $3,500 per ounce.
Alan Carter, President and Chief Executive Officer of Cabral Gold, ties that resilience to the operation's cost base:
"We should be producing gold at an all-in sustaining cost of about $1,200 an ounce, even with the pullback in the gold price. There's an enormous profit margin on that gold that we expect to be producing very quickly."
Resource Scale and Infrastructure Reinforce Project Resilience
US Gold Corp, advancing its CK Gold project in Wyoming, reports a similar cushion at the project level. Its March 2026 feasibility study uses a $3,250 per ounce base case, about 26% below spot near $4,400 per ounce, generating a net present value at a 5% discount rate (NPV5%) of $632 million and a 27% after-tax IRR, with the study's own $3,000 per ounce downside case still producing a positive $528 million NPV5% and a 23.8% IRR.
Hycroft Mining Holding Corporation ended the second quarter of 2026 with $220.5 million in unrestricted cash and no debt, funding its Vortex and Brimstone underground evaluation without near-term reliance on external financing.
Tudor Gold, a development-stage company advancing its Treaty Creek project in British Columbia, holds a resource base large enough to represent a meaningful future supply source on its own. Joseph Ovsenek, President and Chief Executive Officer, describes the project scale:
"We have over 24.9 million ounces of gold in the indicated category, another 4 million ounces of gold in the inferred category. That is one of the biggest undeveloped gold deposits you'll find anywhere around."
Owned Processing & Feasibility Progress Reduce Development Risk
New Found Gold, a development-stage company advancing its Queensway and Hammerdown projects in Newfoundland and Labrador, is converting its owned Pine Cove mill to a gravity carbon-in-leach circuit targeting a recovery increase from 87% to approximately 92%, processing material from both projects through the same facility rather than relying on third-party toll milling. P2 Gold, an exploration-stage company advancing its Gabbs project in Nevada, sits earliest on this curve, with a 2025 preliminary economic assessment reporting a $942.9 million after-tax NPV5% and a 33.8% after-tax IRR, and an updated resource estimate and full feasibility study both targeted for later in 2026.
Central-Bank Gold Demand Extends Beyond Fed Risk but Needs Continued Confirmation
Gold's near-term price signals can change within days, while central-bank reserve demand is measured over quarters and supported by a 12-month survey outlook. Fed communication can shift rate expectations within days, contributing to short-term gold price moves such as the roughly 9% rise recorded earlier in August. Central-bank reserve demand operates over a longer reporting horizon, with purchases across 4 reserve managers in the second quarter reinforced by a World Gold Council survey in which 89% of 76 central banks expect global gold reserves to rise over the next 12 months.
The reserve-demand thesis would weaken if future surveys showed fewer central banks anticipating higher global gold reserves, if disclosed accumulation plans were reduced, or if central banks recorded net selling across multiple consecutive quarters. The second-quarter purchase data and current World Gold Council survey show none of those conditions.
The Investment Thesis for Gold
- Central-bank gold demand extended across 4 reserve managers in the second quarter of 2026, reducing the dependence of aggregate purchases on any single country's reserve policy.
- A World Gold Council survey of 76 central banks found that 89% expect global gold reserves to rise over the next 12 months, providing forward-looking support for demand beyond the second-quarter purchase data.
- Fed policy remains a near-term gold price driver because the August 19 meeting minutes and August 28 Jackson Hole address could shift rate expectations ahead of the September 16 decision.
- Selected development-stage studies use base-case gold prices of $2,500 to $3,250 per ounce, below spot near $4,400 per ounce, reducing their dependence on current prices to support project economics.
- Cash reserves and owned processing infrastructure reduce near-term external funding needs at selected projects, limiting reliance on new equity issuance if gold prices weaken.
- Position sizing should treat near-term Fed-driven price volatility and longer-duration central-bank reserve demand as separate risks because a hawkish policy signal can pressure gold without changing already recorded reserve purchases or stated reserve targets.
Central banks bought 288.9 tonnes of gold in the second quarter of 2026, up 62% year over year, as Poland, China, Uzbekistan, and Kazakhstan added reserves even while Russia and Turkey sold. A World Gold Council survey of 76 central banks found that 89% expect global gold reserves to rise over the next 12 months, supporting a longer-duration demand thesis even as Fed policy can shift gold prices through near-term rate expectations. Selected development-stage studies use gold prices below current spot, while cash reserves, resource scale, and owned processing infrastructure provide additional project-specific support if near-term gold prices weaken.
TL;DR
Central banks bought 288.9 tonnes of gold in Q2 2026, up 62% year over year, with purchases spread across Poland, China, Uzbekistan, and Kazakhstan even as Russia and Turkey sold. A World Gold Council survey found that 89% of 76 central banks expect global gold reserves to rise over the next 12 months, supporting demand beyond a single quarter. Fed policy can still move gold prices quickly through rate expectations, but it does not directly determine other central banks' reserve decisions. Selected gold projects also use below-spot price assumptions, while cash reserves, large resources, and owned processing infrastructure provide additional project-level support.
FAQs (AI-Generated)
Analyst's Notes





Subscribe to Our Channel







Stay Informed