High Gold Prices Shift Asian Buyers Toward Bullion as Gold Supply Stays Flat



High gold prices shift Asian buying from jewelry toward bullion, while slow mine growth, changing investment flows, and Fed rate expectations shape gold prices
- China’s first-half bar and coin demand was more than twice its jewelry demand. The World Gold Council (WGC) reported 314 tonnes of bar and coin buying against 136 tonnes of jewelry demand, which fell 30% year over year. World Gold Council
- High gold prices and China’s value-added tax (VAT) treatment led some buyers to favor lower-premium bars and coins over jewelry. World Gold Council
- Central banks bought a net 288.9 tonnes in the second quarter, while gold exchange-traded fund (ETF) holdings rose 121 tonnes in August. The ETF gain followed 44.8 tonnes of second-quarter outflows, showing how quickly that source of demand can change. World Gold Council
- Second-quarter mine output rose 2% year over year to 965.6 tonnes, but a 6% decline in recycling kept total gold supply nearly flat at 1,268.9 tonnes. World Gold Council
- Spot gold fell 3% to $4,156.45 an ounce in early trading on September 28 as higher oil prices strengthened Fed rate-hike expectations. Higher interest rates raise the income forgone by holding gold.
High Gold Prices Shift Asian Buying Toward Investment Gold
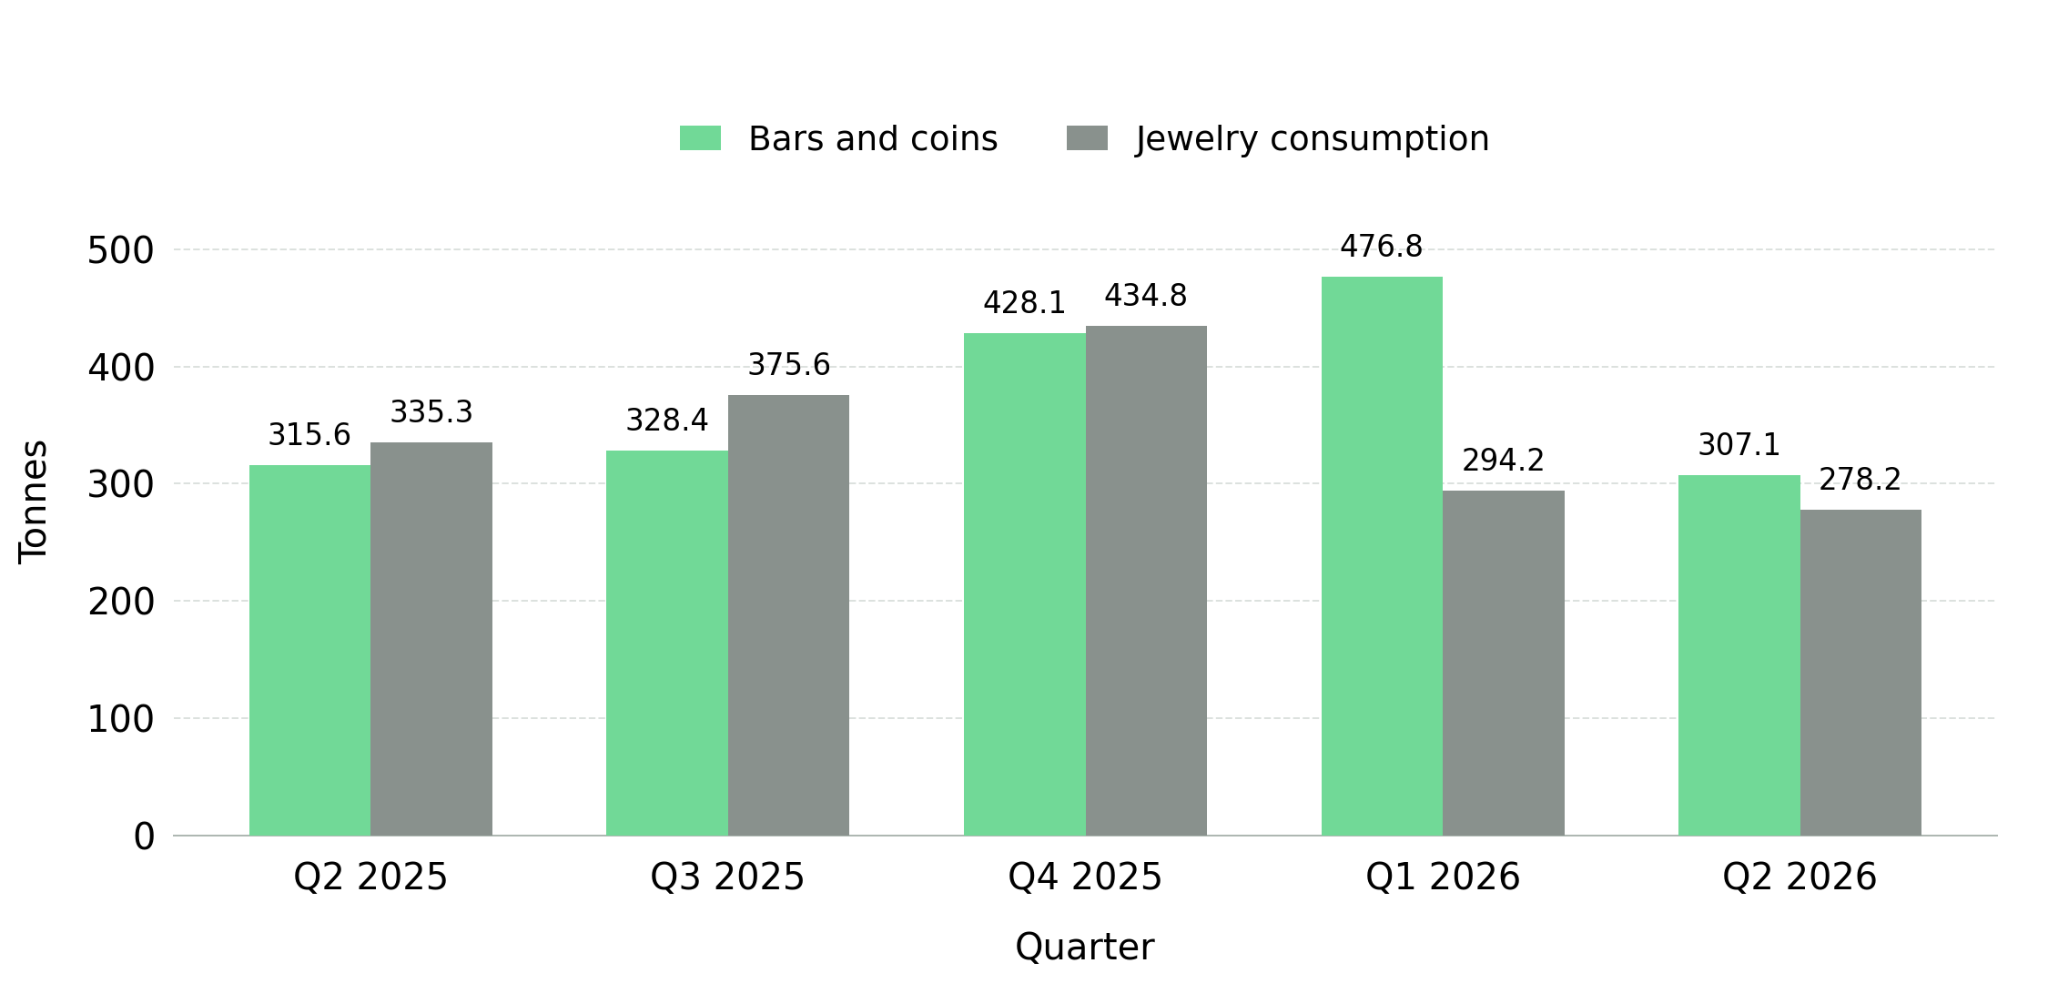
The WGC’s July 30 Gold Demand Trends: Q2 2026 reported global jewelry demand of 278.2 tonnes, down 17% year over year, as high prices reduced the weight of gold buyers purchased. Across Asia, some buyers chose lighter jewelry or lower-premium bars and coins, keeping gold within reach while reducing the cost of each purchase.
Investment is the main potential source of gold demand growth through the rest of 2026, with Asian and over-the-counter (OTC) buying taking a larger role. Higher real yields could still restrain Western ETF buying by increasing the income forgone from holding gold.
China’s VAT Favors Bullion, Yet Wholesale Gold Demand Falls
China’s VAT treatment also affects the cost of holding gold in different forms. The WGC says higher tax costs can pass through jewelry supply chains, while the treatment of investment products bought directly from Shanghai Gold Exchange (SGE) members is unchanged; that difference has helped favor bars, coins, and gold accumulation products over jewelry.
Chinese gold ETFs added 11 tonnes in August, while SGE withdrawals, an indicator of wholesale demand, fell 27% year over year to 62 tonnes. In its September 14 China update, the WGC attributed the withdrawal decline partly to slower bullion investment and weak jewelry demand, indicating softer physical buying even as ETF holdings rose.
High Gold Prices Cut Indian Jewelry Demand as Bullion Buying Rises
India’s bar and coin demand rose 9% year over year to 50.3 tonnes in the second quarter, while jewelry demand fell 15% to 75.1 tonnes as high prices reduced purchase weights. First-half bar and coin buying reached 113 tonnes, its strongest first-half total since 2013.
Jewelry demand still exceeded bar and coin demand by 24.8 tonnes in the second quarter. The WGC reported that an import-duty increase from 6% to 15% and uncertainty about near-term prices restrained fresh bullion purchases: bar and coin demand fell 19% from the first quarter despite its year-over-year gain. The WGC also identified below-normal rainfall as a potential risk to rural demand later in 2026, rather than a decline already measured in its second-quarter figures.
Official Buying Supports Gold Demand as ETF Inflows Return
WGC reported Bar and coin demand rose to 307.1 tonnes, close to its five-year quarterly average of 305 tonnes, while central banks and other official institutions bought a net 288.9 tonnes, up 62% year over year. Gold ETFs shed 44.8 tonnes in the same quarter, so official purchases and steady bar and coin demand did not signal gains across every channel. The WGC also recorded 327 tonnes of OTC and stock flows, a category that includes less visible investment activity and a statistical residual; it does not measure how much gold identifiable Asian buyers purchased.
Reserve Diversification Supports Official Buying Despite Quarterly Swings
China’s central bank reported adding 20.2 tonnes to its gold reserves in August, its largest monthly addition since October 2023. The WGC’s September 14 China update put reported holdings at 2,387 tonnes after 22 consecutive months of increases. www.gold.org
Net official purchases rose from a revised 57 tonnes in the first quarter to 288.9 tonnes in the second, a record for that quarter. First-half buying nevertheless totaled 345 tonnes, its lowest first-half level since 2022. The WGC’s July outlook forecasts a 2026 total below 2025, so the second-quarter pace should not be held constant when estimating future gold demand.
Western ETF Inflows Lift Holdings, but Rising Real Yields Threaten Demand
WGC recorded $18 billion of global gold ETF inflows, lifting holdings by 121 tonnes to a record 4,189 tonnes. North American funds attracted $7.7 billion and European funds $7.9 billion, together accounting for about 87% of that month’s dollar inflows. Higher real yields increase the income forgone from holding gold, so ETF demand could weaken again even if central banks continue to buy.
Slow Mine Growth Makes Project Milestones Key to Future Gold Supply
In the second quarter of 2026 (April-June), mine production rose 2% year over year to 965.6 tonnes, while total supply was nearly unchanged at 1,268.9 tonnes as recycling fell 6%. Its outlook identifies operating limits and long project lead times as reasons higher gold prices translate into additional mine supply gradually. A discovery identifies a possible source of gold, a first pour confirms initial output, and sustained commercial production provides data for assessing recurring supply.
Grade measures grams of gold per tonne of rock; at a given recovery rate, higher grade can increase saleable ounces from each tonne processed. Recovery and steady throughput determine how much gold a mine produces regularly, while operating costs determine how much of the sale price remains as margin.
Sustained Throughput Moves First Pours Toward Commercial Gold Production
Cabral Gold reported a first pour of approximately 1,130 ounces of gold at its Cuiú Cuiú mine in Brazil. The company is ramping up ore stacking toward 3,000 tonnes per day and targeting commercial production by the end of 2026, which would give it an operating base for its planned hard-rock expansion.
Alan Carter, President and Chief Executive Officer of Cabral Gold, details the current stacking rate and intended ramp-up:
“We've been stacking in the order of about 1,500 tons a day in the last few days. But the target here is 3,000 tons a day, so there is a gradual ramp-up, and it will take us a few weeks to get up to 3,000 tons a day.”
New Found Gold declared commercial production at its Hammerdown mine in Newfoundland after meeting its operating targets for 60 consecutive days. Hammerdown produced 9,140 ounces of gold in the first eight months of 2026, establishing an operating base as the company advances its separate Queensway project.
Drilling Expands Gold Potential; Permits Move Projects Toward Supply
A higher gold price raises potential revenue per recovered ounce, but a drill intercept cannot establish how much ore a deposit could supply. Further drilling must show whether the gold-bearing rock continues between holes and how thick the zone actually is before those results can inform a mine plan. Tudor’s release states that its reported intervals are drilled lengths and that true widths have not yet been determined.
Tudor Gold’s ten new drill holes expanded the gold-bearing Perfectstorm system at its Treaty Creek project in British Columbia. Located about one kilometer from the Goldstorm deposit, the zone gives the company another area to explore. Two drills remain active, and results from four follow-up holes are pending.
U.S. Gold Corp. highlighted its fully permitted CK Gold project in Wyoming and a recent feasibility study in its September conference announcement. Those milestones give the company an advanced development project, alongside separate exploration opportunities at Keystone in Nevada and Challis Gold in Idaho.
P2 Gold is targeting a Q4 2026 resource update and Q1 2027 feasibility study for its Gabbs gold-copper project in Nevada. The study contemplates a 12-million-tonne annual mill from year three alongside heap leaching, targeting average annual gold production of 150,000 ounces. Estimated gold recovery is 94.5% for sulfide milling versus 85% for oxide heap leaching, with metallurgical testing underway to assess those assumptions. A mining plan submission is targeted for Q1 2027, advancing permitting before potential production.
Oil Prices Lift Fed Hike Bets, Pushing Gold Lower and Testing Mine Margins
Reuters reported spot gold down 3.1% to $4,155.67 an ounce at 10:31 GMT on September 28, its lowest since August 5, as higher oil prices reinforced inflation concerns and Fed hike bets. Rising Treasury yields increased the appeal of interest-bearing assets relative to gold; earlier ETF inflows and central bank purchases did not establish a floor under the spot price.
Gold Price Declines Narrow Operating Margins & Test Project Economics
At an operating mine, lower recovery or higher costs reduce the margin earned per ounce sold at a given gold price. A mine in commissioning needs repeatable throughput and recovery results before early output can support a reliable production estimate. For a developer, permits, committed financing, and a construction schedule determine when a project can begin selling gold.
The Investment Thesis for Gold
- Operating mines need repeatable throughput and recovery to sell gold regularly; the spread between realized prices and AISC indicates how much remains for taxes, financing, and other cash needs. www.gold.org
- A first pour confirms initial output, while repeated processing and recovery results are needed to assess whether a mine in commissioning can sustain production.
- Permits, committed financing, and a construction schedule set a developer’s path to first sales; new road or power requirements add capital needs before revenue begins.
- Drill intercepts and resource size do not establish profit; further drilling, recovery tests, and economic studies test whether the deposit can support a mine plan.
- Gold’s 3.1% decline on September 28 shows why projected margins and financing needs should also be tested at prices below a study’s base case.
China’s record 314 tonnes of first-half bar and coin demand did not prevent gold’s 3.1% decline on September 28, showing that stronger investment buying does not guarantee a higher price. For gold equities, repeatable output and the spread between realized prices and AISC determine operating margins, while permits, financing, and economics tested at lower gold prices determine whether development projects can reach production.
TL;DR
High gold prices have reduced jewelry demand in China and India, while bars and coins have attracted buyers seeking to hold gold as an asset. Central bank purchases and August ETF inflows added demand, but those flows can change quickly. Second-quarter mine output rose 2%, yet lower recycling left total supply nearly flat. Gold’s September 28 decline shows that strong bullion buying does not guarantee a rising price when higher interest rates make other assets more attractive. For gold equities, sustained production, costs, financing, and project economics determine how much value a company can capture.
FAQs (AI-Generated)
Analyst's Notes





Subscribe to Our Channel












Stay Informed