Dollar Reserves at 30-Year Lows & Rising Gold Investment Reshape Gold Project Valuations



IMF and World Gold Council data show rising gold investment and lower dollar reserves are reshaping valuations across gold exploration and development assets.
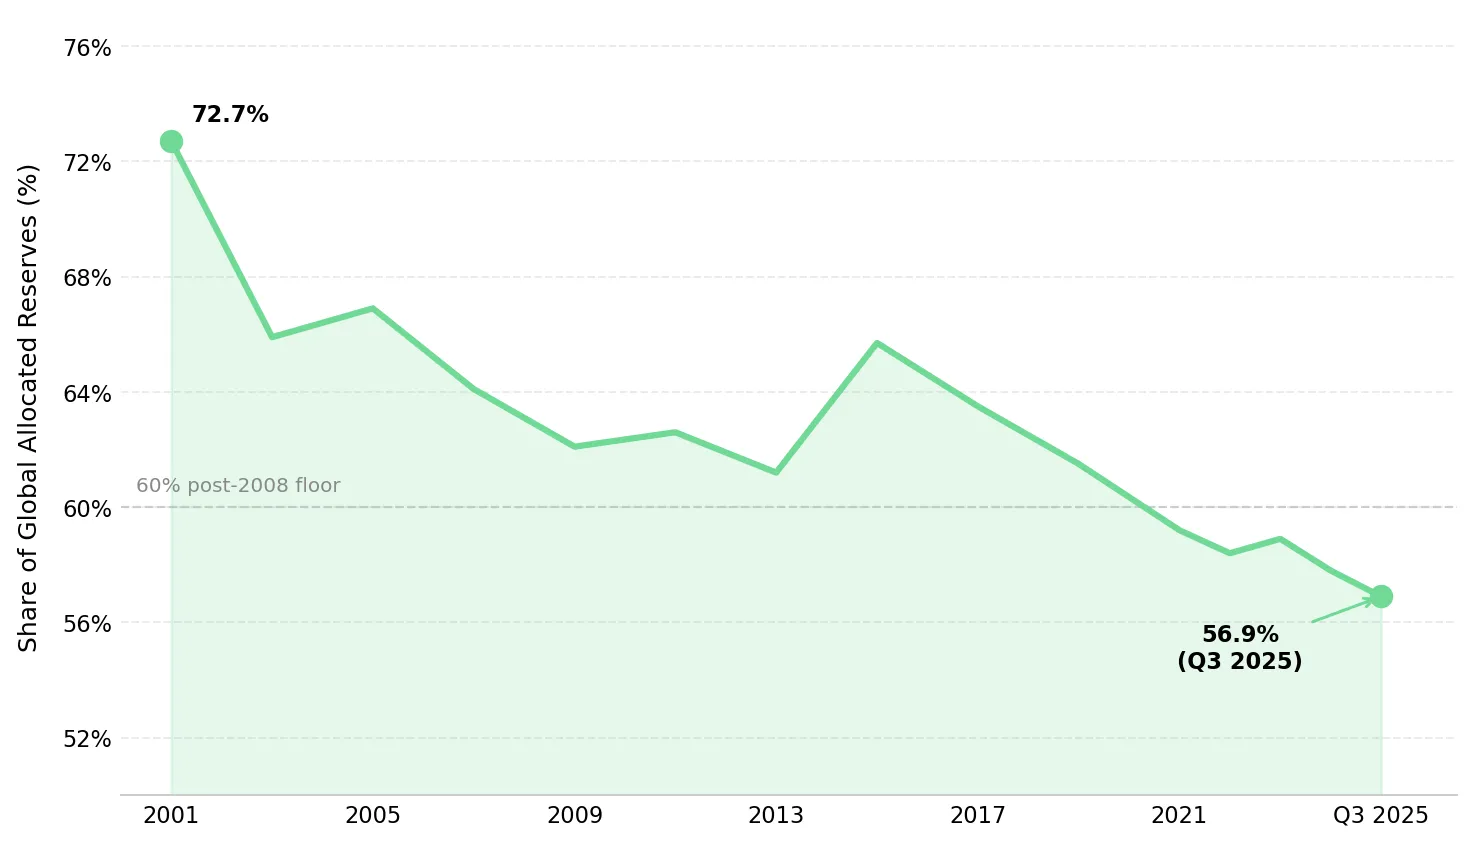
- IMF COFER data showed the US dollar’s share of global reserves falling to 56.9% in Q3 2025, its lowest level since 1995, increasing central bank gold purchases as sovereign reserve managers diversify away from dollar-denominated assets.
- World Gold Council Gold Demand Trends Q1 2026 data showed investment demand exceeding fabrication demand for the first time on record, increasing gold’s sensitivity to capital flows and sovereign reserve allocation rather than industrial consumption trends.
- Central banks purchased a net 244 tonnes of gold in Q1 2026, above the five-year average per the World Gold Council, with Guatemala, Indonesia, and Malaysia joining as net buyers, expanding the sovereign demand base supporting long-term gold prices.”
- Development-stage gold assets continue trading below developer peer EV/oz benchmarks despite larger measured and indicated resource inventories and rising long-term gold price assumptions.
- Near-term preliminary economic assessments, resource estimate updates, and first-production milestones across development-stage gold companies could narrow EV/oz discounts as feasibility models adjust to higher long-term gold price assumptions.
Gold’s Q1 2026 quarterly average of $4,873 per ounce, according to the LBMA PM fix, was not the market’s most consequential signal. The more important threshold was investment demand exceeding fabrication demand for the first time in recorded history. Gold is increasingly being priced as a financial reserve asset rather than solely as a commodity tied to jewellery and industrial consumption.
IMF COFER data showed the US dollar’s share of global reserves falling to 56.9% in Q3 2025 from 72% in 2001, reinforcing gold’s role as the primary alternative reserve asset as sovereign institutions diversify away from dollar exposure. For mining investors, the key question is whether EV/oz multiples, NPV discount rates, and resource valuations for development-stage gold assets fully reflect a market increasingly pricing gold as a reserve asset rather than a commodity. Current valuations suggest they do not.
Dollar Reserve Diversification & Gold Project Valuation Sensitivity
The IMF COFER database showed the US dollar accounting for 56.9% of global allocated reserves in Q3 2025, down from 72% in 2001 and below the post-2008 range that had stabilized near 60%. The IMF’s April 2026 Global Financial Stability Report attributed the shift to financial sanctions, the expansion of alternative payment systems such as China’s CIPS, and broader sovereign reserve diversification into gold. Emerging market central banks increased their share of official gold reserves from 18% in 2000 to approximately 32% by end-2025. For development-stage gold projects modelled at $2,500 to $3,000 per ounce base-case gold, higher long-term price assumptions could increase project NPVs.
The LBMA PM gold price reached a record $5,405 per ounce in January 2026 before a liquidity-driven correction pulled prices into the $4,441 to $4,576 range. Gold declined during the escalation of the US-Iran conflict, reversing its traditional geopolitical safe-haven pattern, as investors liquidated positions to meet margin calls in other asset classes. The price action reinforced gold’s increasing role as a liquid financial reserve asset within institutional portfolios.
EV/oz Valuation Discounts in Development-Stage Gold Assets
EV/oz benchmarks show development-stage gold assets trading below producer and developer peer multiples. Two North American developers illustrate the valuation gap through published EV/oz comparisons and feasibility metrics.
Hycroft Mining & EV/oz Re-Rating Following High-Grade Discovery
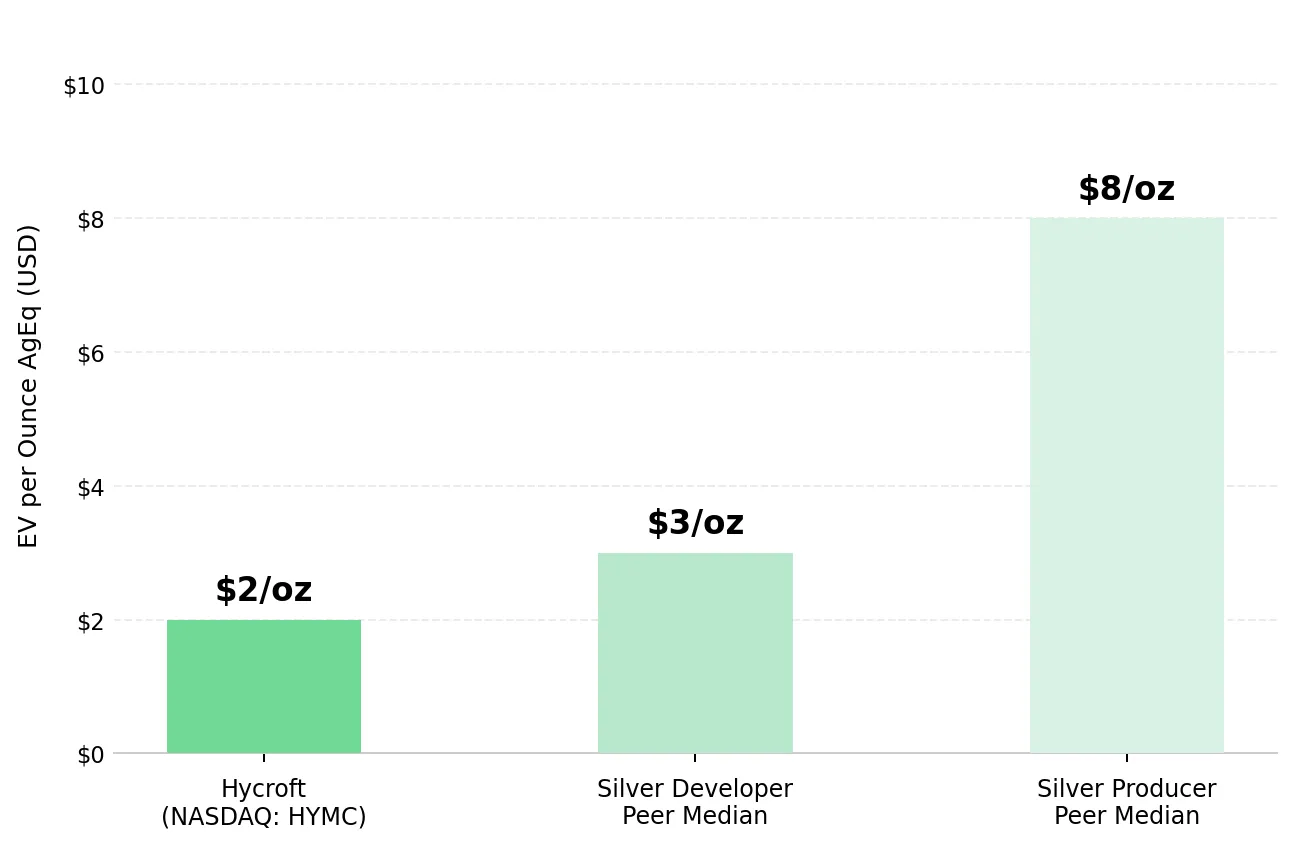
Hycroft Mining Holding Corporation trades at $2 per ounce silver equivalent versus a silver developer peer median of $3 per ounce and a silver producer median of $8 per ounce, according to the company’s May 2026 benchmarking analysis. The 2026 measured and indicated resource totals 16.4 million ounces of gold and 562.6 million ounces of silver, a 55% increase from the 2023 estimate using a $3,100 per ounce gold price assumption. A 2026 preliminary economic assessment and roaster versus pressure oxidation trade-off study could provide the published NPV metrics required for broader institutional valuation comparisons.
Diane Garrett, President and Chief Executive Officer of Hycroft Mining, describes the high-grade discovery reshaping the project’s valuation:
“Hycroft has always been known as one of the world’s largest precious metals deposits, but it’s low-grade. Nobody thought there was high-grade at Hycroft. This is the game-changer, and it’s what’s attracting the attention of the market.”
U.S. Gold Corp & Financing Demand for Fully Permitted Gold Projects
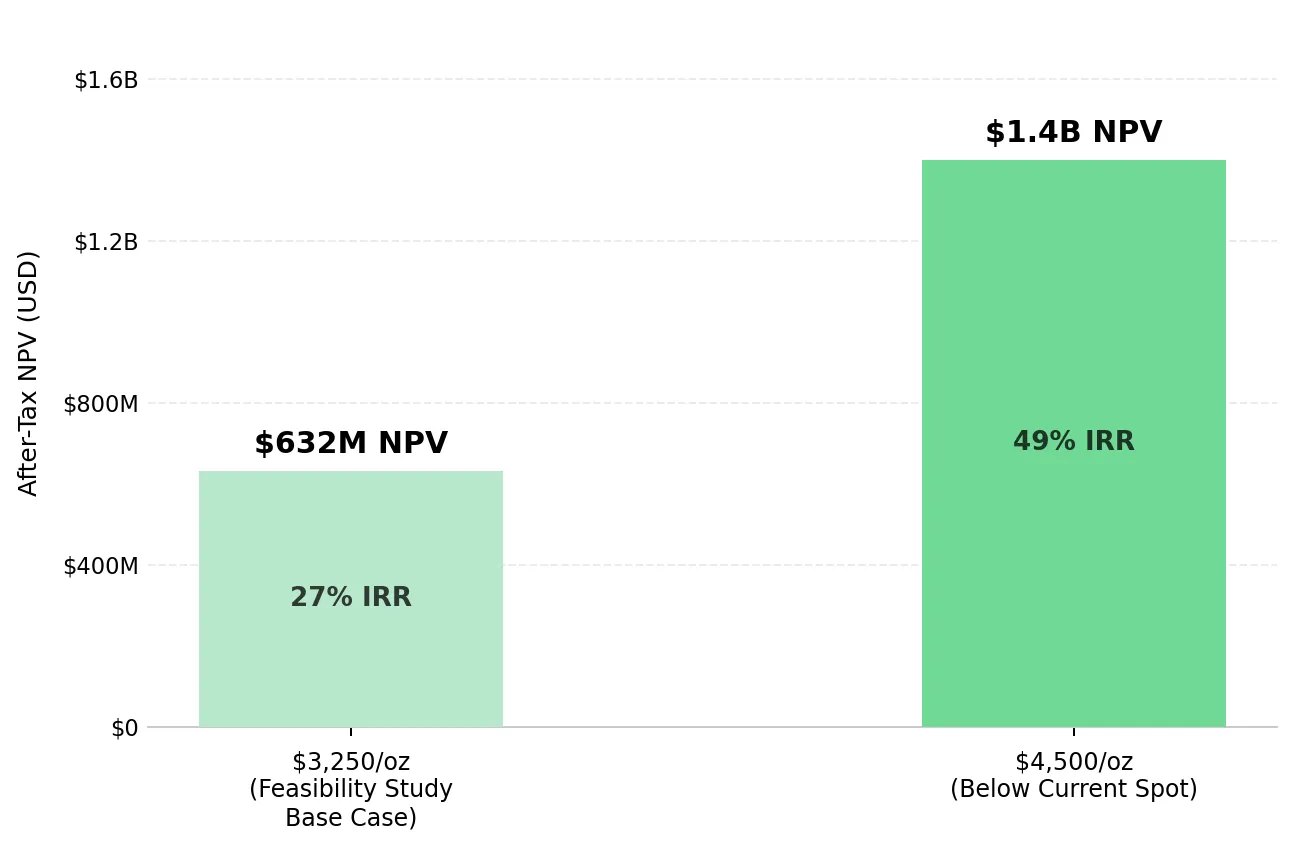
U.S. Gold Corp.’s feasibility study highlights how higher gold price assumptions increase project valuation metrics for permitted development-stage assets. The March 2026 CK Gold Project Feasibility Study reported an after-tax NPV of $632 million at $3,250 per ounce gold, with a 27% after-tax IRR, a 2.5-year payback period, and $394 million in initial capital requirements. At $4,500 per ounce gold, below current spot prices, sensitivity analysis shows NPV approaching $1.4 billion with an IRR of nearly 50%. The project sits on Wyoming state land, where permits become irrevocable once awarded, reducing federal permitting risk and lowering financing uncertainty.
Luke Norman, Chairman of U.S. Gold Corp., discusses the financing terms available for fully permitted, feasibility-stage gold projects:
“We have seen indicative term sheets as high as 80% debt with 20% equity, with equity priced at premiums to market. There’s a lot of money chasing mining opportunities right now, but not many shovel-ready projects like ours. The roughly $400 million CapEx is a sweet spot.”
District-Scale Gold Deposits & Long-Term Valuation Sensitivity
Higher long-term gold price assumptions could increase EV/oz multiples for large, undeveloped gold deposits in stable mining jurisdictions. Three development-stage companies illustrate how resource scale and production timelines affect valuation sensitivity.
Tudor Gold & the PEA Pathway for a District-Scale Gold Deposit
Treaty Creek’s Goldstorm Deposit, held 80% by Tudor Gold in British Columbia’s Golden Triangle, contains Indicated Mineral Resources of 24.9 million gold-equivalent ounces across 912.3 million tonnes, according to the March 9, 2026 NI 43-101 technical report. Metallurgical test results released May 12, 2026 confirmed gold recoveries of 80.3% to 87.3% across all three deposit zones, supporting the upcoming Q3 2026 preliminary economic assessment. Tudor Gold Corp.’s management team previously advanced the Brucejack mine, located 15 kilometers south of Treaty Creek, from discovery in 2009 to first gold pour in 2017.
Joseph Ovsenek, President and Chief Executive Officer of Tudor Gold, discusses the preliminary economic assessment as the next step in advancing Treaty Creek toward production:
“The big one for us is getting that PEA to show people Treaty Creek is not just a big gold discovery, but a mine. The first step is completing a preliminary economic assessment to demonstrate the economics and show we can push this project hard, like Brucejack, and get it into production as quickly as possible.”
Cabral Gold & the EV/oz Re-Rating Potential of District Expansion
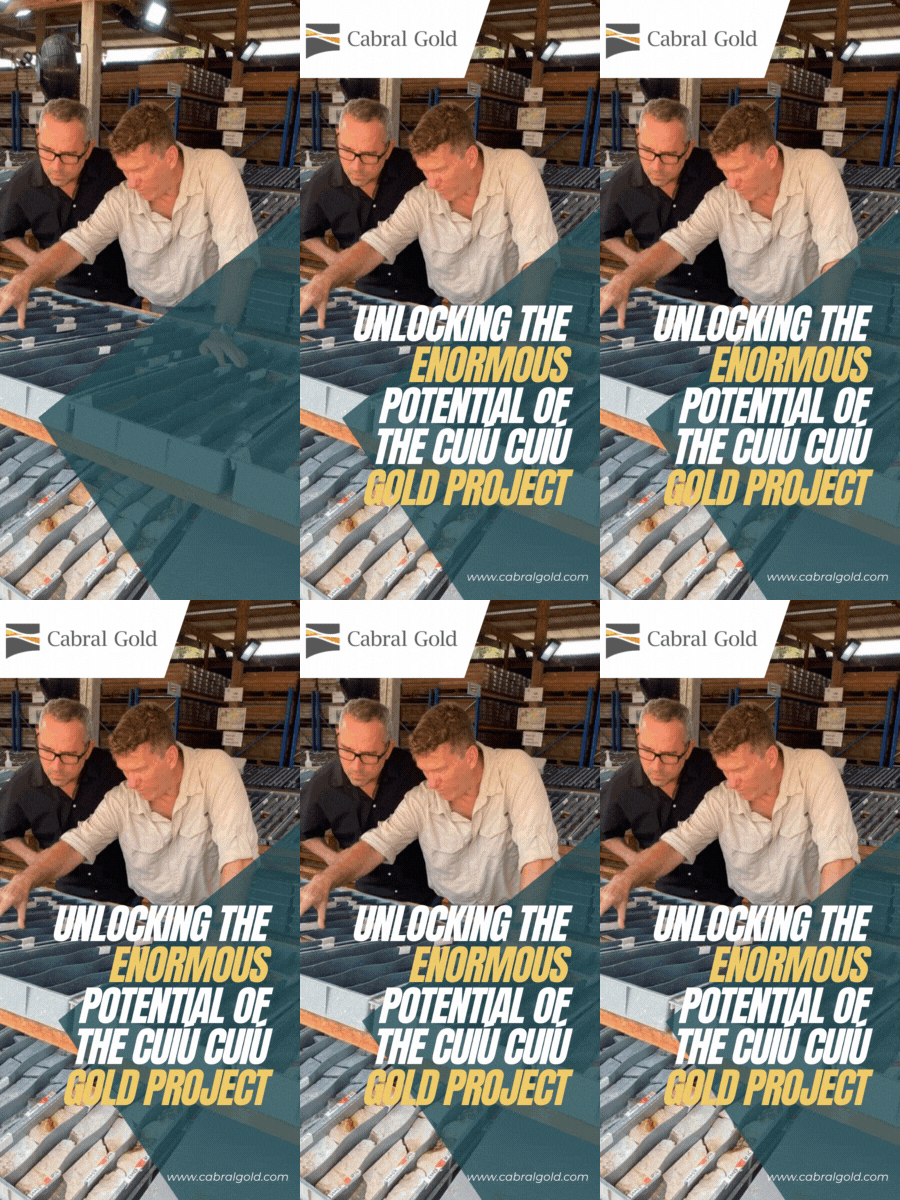
Cabral Gold illustrates how near-term production milestones can accelerate EV/oz re-rating potential. Phase 1 is an oxide gold heap leach operation at the MG deposit within a district containing approximately 1.2 million ounces across NI 43-101 compliant deposits. The Jerimum Cima target, located 3 kilometers outside the existing resource boundary, returned 10.2 meters at 8.7 grams per tonne gold in hole DDH378 in May 2026, including 1.3 meters at 62.5 grams per tonne gold, with mineralization traced across 455 meters of strike. The Licença Prévia received in March 2026 supports Phase 1 expansion toward the 3,000-tonne-per-day capacity outlined in the pre-feasibility study.
Alan Carter, President and Chief Executive Officer of Cabral Gold, explains why the company is accelerating exploration to expand the district resource base ahead of production:
“We think we can increase the value of this company faster by growing the global resource base faster and demonstrating the economic viability of stage two through a PEA.”
Cobra Resources & the Economic Potential of Shallow Porphyry Gold-Copper Mineralization
Cobra Resources provides gold exposure through copper-gold mineralization within its South Australian critical minerals portfolio. The Manna Hill Project sits within a porphyry province with geological characteristics similar to the Cadia Valley district in Australia. At the Blue Rose copper-gold prospect, 2026 drilling returned 74 meters at 1.02% copper and 0.25 grams per tonne gold from 70 meters depth, including 14 meters at 1.52% copper and 0.42 grams per tonne gold. Cobra Resources commenced 1,800 meters of diamond drilling in May 2026 to test the underlying porphyry source.
Rupert Verco, Managing Director of Cobra Resources, highlighted the scale implications from the initial drilling campaign:
“In this gold market, having 0.25 grams gold and comparing that to the porphyries in South America, this is looking pretty encouraging. We’re ticking all the right economic boxes in terms of broad widths of mineralization, very strong grades, and very shallow.”
Near-Term Resource Expansion & Feasibility Milestones
P2 Gold is targeting a Q4 2026 feasibility study based on an existing Inferred Mineral Resource of 1.84 million ounces of gold-equivalent. The October 2025 preliminary economic assessment outlined 109,000 ounces of gold and 33 million pounds of copper annually over a 14.2-year mine life. The feasibility study targets a 12 million tonne-per-year processing rate and annual production of 150,000 ounces of gold, a 38% increase over the preliminary economic assessment base case using the same permitted infrastructure. Drilling results released May 20, 2026 at the Lucky Strike Zone returned 1.04 grams per tonne gold and 0.35% copper over 53.34 meters in hole GBD-021, including 1.52 meters grading 183.0 grams per tonne gold and 4.0% copper from a 100-meter step-out into a previously undrilled area.
Joe Ovsenek, President and Chief Executive Officer of P2 Gold, outlines the role of the updated resource estimate in advancing the project timeline:
“We’ll release an updated resource estimate in Q3 2026, which will form the basis for the feasibility study expected later in Q4. Our target for production is less than three years from today, so we consider this a near-term project.”
New Found Gold & Full Funding for Project Development
New Found Gold secured full project funding on May 19, 2026, after EdgePoint Investment Group advanced C$70 million under a previously announced C$105 million senior secured credit facility. Combined with C$115 million raised through a prior bought deal financing, the company reported C$185 million in total capital against preliminary economic assessment capex of C$155 million for Queensway Phase 1 and Hammerdown, targeting production in late 2027. Queensway covers more than 110 kilometers of strike across two fault zones in Newfoundland and Labrador, supporting long-term district-scale exploration potential.
Keith Boyle, Chief Executive Officer of New Found Gold, describes the company’s fully funded position ahead of project development:
“We’ve drawn down $70 million, bringing total funding for the Queensway project to $185 million. With the PEA outlining $155 million in capex, we are fully funded to advance Queensway through to production.”
The Investment Thesis for Gold
- IMF COFER data showed the US dollar accounting for 56.9% of global reserves in Q3 2025, a 30-year low, increasing central bank demand for gold beyond traditional interest-rate and geopolitical drivers.
- Gold investment demand exceeded fabrication demand for the first time on record in Q1 2026, increasing the likelihood that development-stage gold assets are valued against financial-asset demand trends rather than traditional commodity cycles.
- Annual mine supply growth of approximately 1% to 2% cannot match central bank gold purchases, increasing the risk that current developer feasibility studies use long-term gold price assumptions below future market levels.
- Development-stage projects with completed or near-term preliminary economic assessments and feasibility studies could attract additional institutional capital once published NPV and IRR metrics reflect higher long-term gold price assumptions.
- Fully permitted, construction-ready gold projects on state or provincial land can reduce financing risk and borrowing costs when permits become irrevocable once awarded.
- Exploration-stage companies advancing resource estimates toward feasibility studies in Tier-1 jurisdictions with existing infrastructure generally carry lower execution risk than greenfield projects, increasing the valuation impact of near-term resource updates.
IMF and World Gold Council data show the US dollar’s reserve share at a 30-year low, investment demand exceeding fabrication demand for the first time on record, and central bank gold purchases outpacing annual mine supply growth. EV/oz valuation frameworks for development-stage gold assets have adjusted more slowly than underlying gold demand trends. Many feasibility studies still use base-case gold prices of $2,500-$3,000 per ounce, while EV/oz benchmarks and discount rates remain tied to historical commodity-cycle assumptions. Developers and explorers approaching production decisions, resource updates, and project financing milestones could see the largest valuation changes if institutional investors adopt higher long-term gold price assumptions.
TL;DR
IMF COFER and World Gold Council data show the US dollar’s reserve share falling to its lowest level since 1995 while gold investment demand exceeded fabrication demand for the first time on record in Q1 2026. The article argues this shift is increasing gold’s role as a financial reserve asset rather than a traditional commodity tied to jewellery and industrial demand. Despite stronger long term gold price assumptions, many gold explorers and developers still trade below peer EV/oz benchmarks. Companies advancing feasibility studies, PEAs, resource updates, financing milestones, and near term production could see significant valuation changes as institutional investors adjust to higher long term gold pricing assumptions.
FAQs (AI-Generated)
Analyst's Notes





Subscribe to Our Channel












Stay Informed